
Research article · 2025 · Full text
International Journal of Geography Geology and EnvironmentAnthropogenic transformation of landscape in the Leh city and its surrounding regions of Leh district, Ladakh, India
Volume 7(12) · Pages 33–39 · DOI: 10.22271/27067483.2025.v7.i12a.458 ↗
Research areasGeotourism and Geoheritage ConservationGroundwater and Watershed AnalysisLandslides and related hazards
Abstract
Author-writtenWith continuous improvements in human lifestyles, people have been increasing their capacity to reshape and utilise nature. As a result, the original geomorphological landscape has been largely changed, and a variety of manmade geomorphological landscapes have been formed. The present study examines the role of human impact in shaping and altering the natural landscapes around Leh city in the Indus Valley, Ladakh, India. A wide range of human activities in transforming the natural landscape has been observed during the field survey in the study region. The results showed that Water management, traffic, urbanisation, and mining activities are some of the interventions that have influenced the transformation of natural landforms into anthropogenic landforms. The most significant changes are related to the construction of road infrastructure and the removal of large volumes of material resulting from mining activities. The anthropogenic macro- and micro-features significantly impact the study region's environment and surface. Without adequate planning, land alterations lead to landslides, increased sedimentation risks, and increased soil erosion.
Summary
Source-checkedPlain-language reading of the full paper, prepared with AI and checked against the text. Each point links to the authors' own words.
Why it matters
- Human activities are significantly altering the fragile Himalayan landscape, which increases its natural vulnerabilities and leads to broad environmental and socio-economic consequences. View evidence ↗
- The biodiversity of Ladakh is threatened by the rapid growth of human activities and the effects of climate change on the region's physical landscape. View evidence ↗
- Humans now act as a primary geomorphic agent, capable of changing the Earth's surface much faster than natural processes. View evidence ↗
The question
- The study aims to examine how human impact shapes and alters the natural landscapes surrounding Leh city in the Indus Valley of Ladakh, India. View evidence ↗
What they did
- The researchers used a combination of field recording, remote sensing, and process-based interpretation to identify and classify human-driven landscape alterations. View evidence ↗
- To assess Land Use and Land Cover (LULC) changes over a 30-year period from 1990 to 2020, the study employed GIS-based analysis and multi-temporal satellite imagery. View evidence ↗
- Field surveys, GPS geotagging, and high-resolution satellite image interpretation were used to record anthropogenic landforms at specific observation points. View evidence ↗
What they found
- The urban population of Leh district grew from 3,720 (8.53% of the total population) in 1961 to 45,671 (34.21% of the total population) by 2011. View evidence ↗
- Mining activities have significantly altered the landscape, with the Phey 2 area being the most affected, covering 310,678 square meters. View evidence ↗
- Irrigation efforts transformed barren land into cultivable land in the Indus Valley, increasing from 88 km in the late 1960s to 100 km by 2009. View evidence ↗
- The practice of cutting slopes for building construction has led to more frequent and larger debris flows in Leh. View evidence ↗
What it means
- The authors conclude that while several factors contribute to landscape change, urbanization and mining have caused the most significant and lasting impacts on Leh's natural landforms. View evidence ↗
- The authors recommend sustainable development strategies, regulated resource extraction, and careful planning to protect the fragile high-mountain ecosystem from future landscape changes. View evidence ↗
Visual summary
2 visualsIllustrations explain the paper; charts are replotted from the paper's own table values.
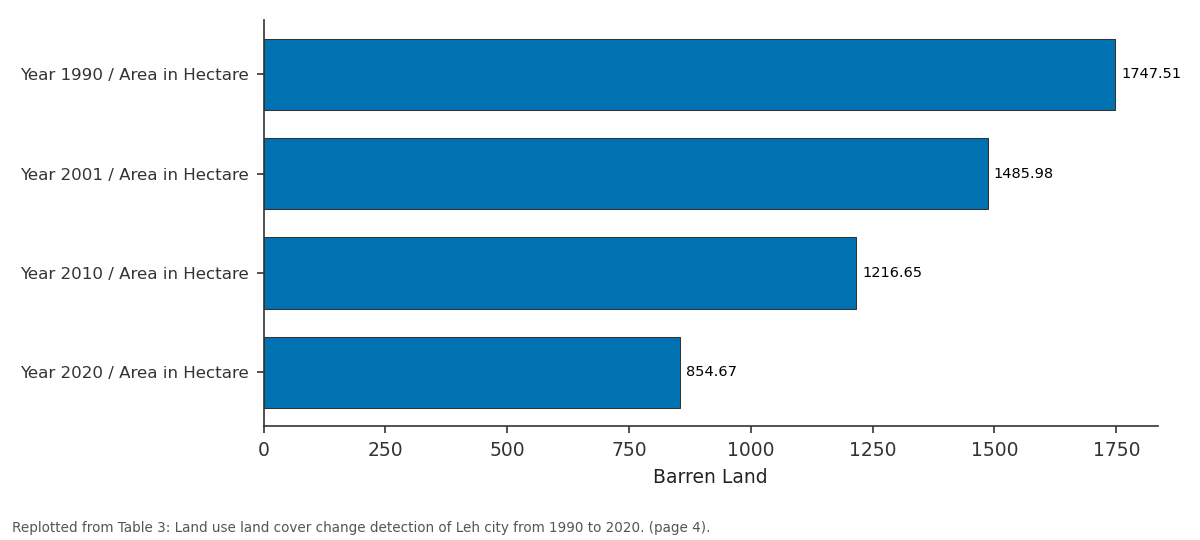
Barren Land: Year 1990 / Area in... vs Year 2001 / Area in... vs Year 2010 / Area in... vs Year 2020 / Area in...
Replotted from Table 3 (page 4) of the original paper. Every bar is the paper's own table value.
View source evidence ↗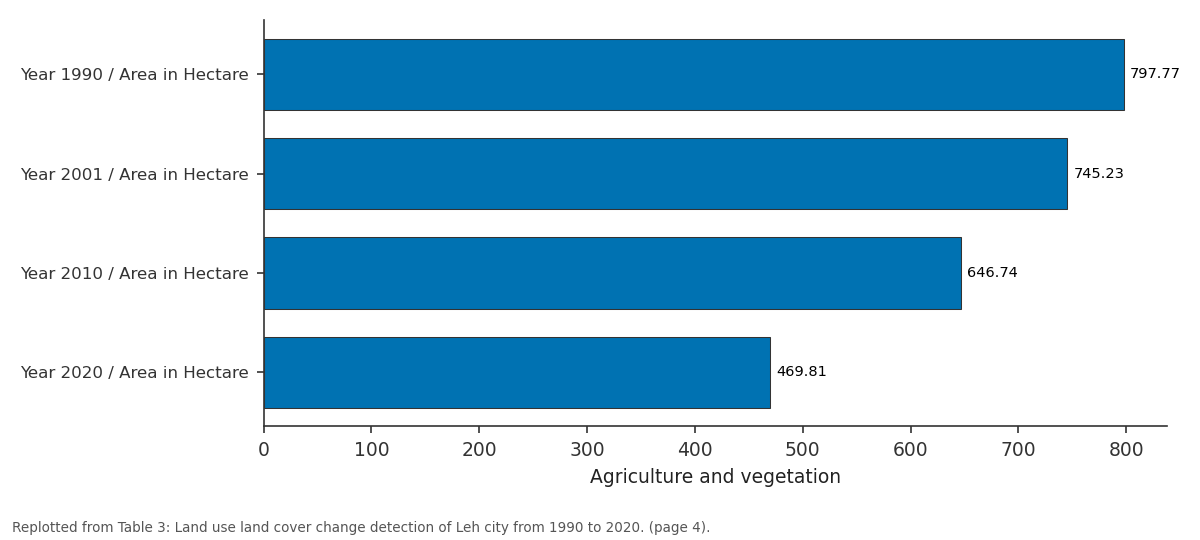
Agriculture and vegetation: Year 1990 / Area in... vs Year 2001 / Area in... vs Year 2010 / Area in... vs Year 2020 / Area in...
Replotted from Table 3 (page 4) of the original paper. Every bar is the paper's own table value.
View source evidence ↗Figures & tables
From the original paper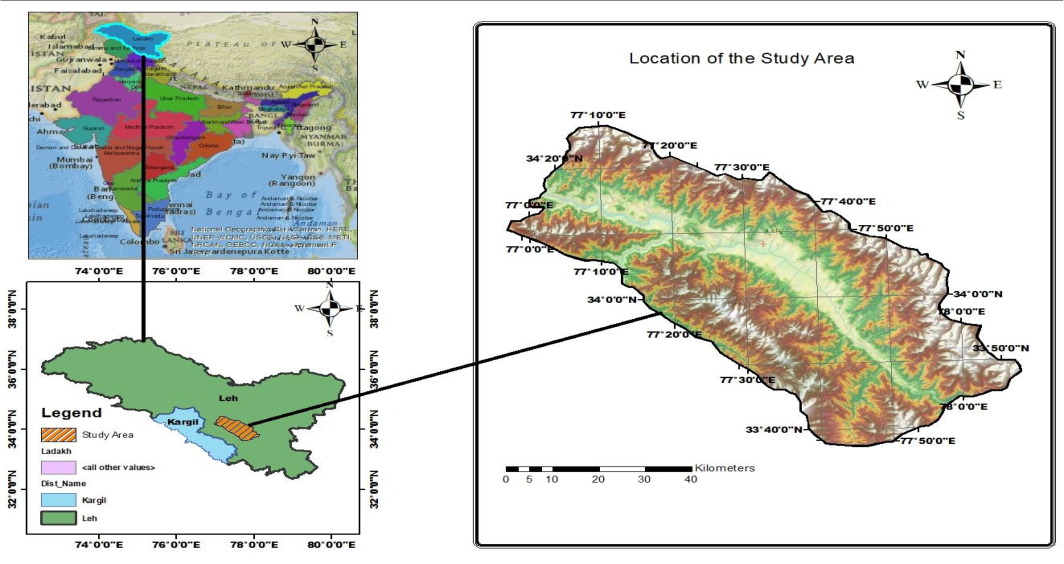 Figure 1
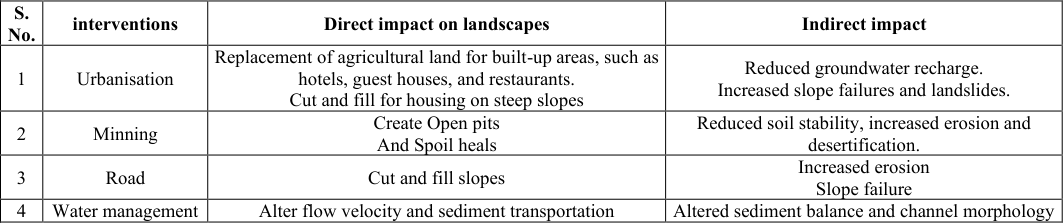 Table 1
 Table 2
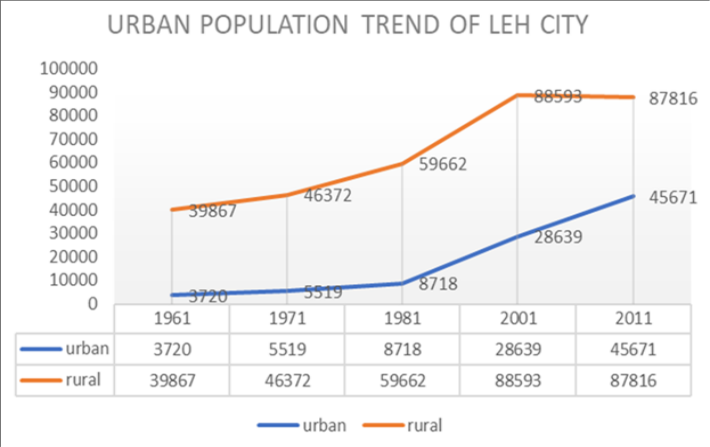 Figure 2
 Table 3
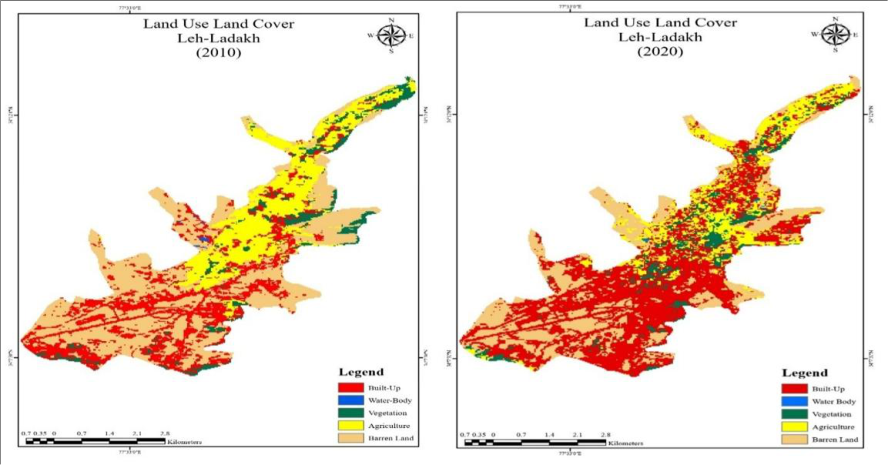 Figure 3
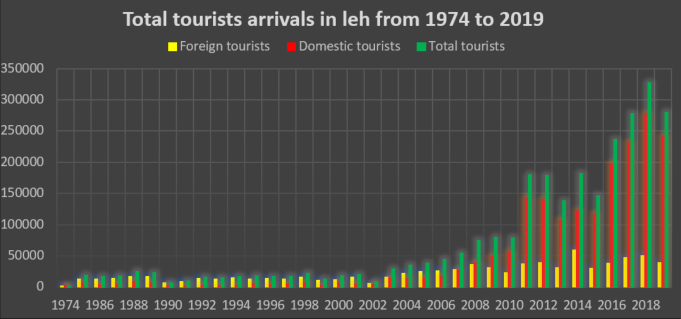 Figure 4
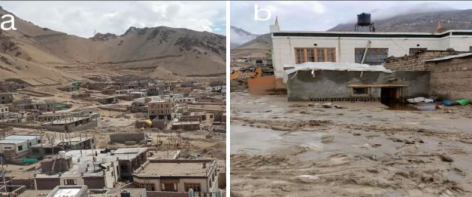 Figure 5
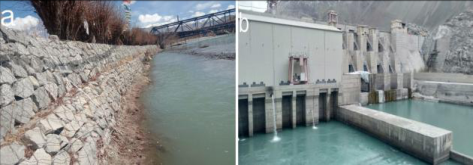 Figure 6
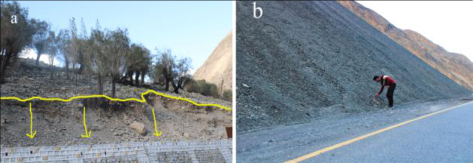 Figure 7
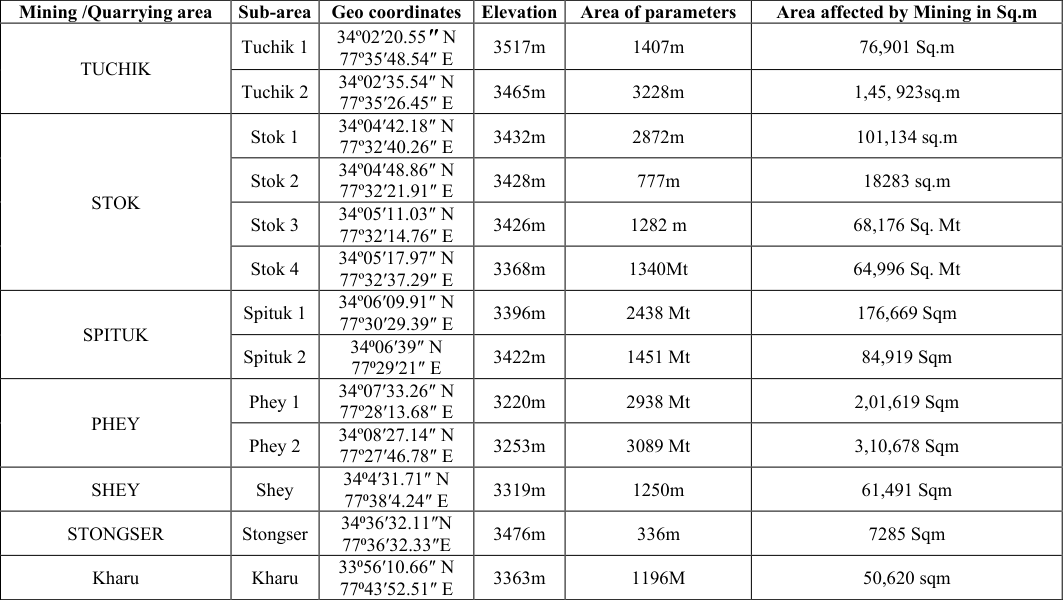 Table 4
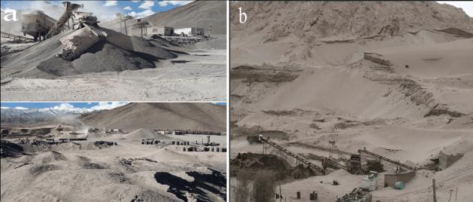 Figure 8
Introduction
Nowadays, humans have become an important geomorphic agent or process, able to alter the surface of the earth at a rate many times faster than natural geomorphological processes (Nir, 1983) [11] . Anthropogenic landforms result from human activities and can directly or indirectly alter the environment or modify the surface of the Earth. According to estimates from Hookie et al (2012) [6] , more than 50% of the world's ice-free land area has now been directly altered by human intervention. These estimates are based on the land area modified by humans in 2007. Nemours' work has focused on the positive and negative impacts of human influence on landscapes. Nowadays, human activities that alter the earth's landscapes have become a major issue worldwide. To meet the demands of the population, humans have continuously modified natural landscapes. Human activities are profoundly altering the fragile Himalayan landscape, exacerbating its natural vulnerabilities to produce wide-ranging environmental and socio-economic impacts. These transformations are driven by rapid population growth, increased demand for resources, large-scale infrastructure projects, and the indirect effects of global climate change caused by human emissions (Pandit et al., 2014) [13] . Leh, the largest district of the Union Territory of Ladakh, is located in the trans-Himalayan region of northern India. The region lies between the Karakoram Range to the north and the Great Himalayas to the south, making it one of the highest regions in the world and often referred to as a cold desert. Ladakh is one of India's popular tourist destinations, known for its stunning natural beauty, mountain vistas, high-altitude lakes, rich Tibetan Buddhist culture, and a wide array of adventure activities. The unique biodiversity of Ladakh faces challenges arising from both the exponential growth of anthropogenic activities and the significant threat of climate change to the region's environmental landscape and physiographical variations (Gaur et al., 2024) [5] . Human activity has significantly impacted the fragile landscape and environment of Leh Ladakh, with the most prominent drivers being tourism, urbanization, and infrastructure development.
Study area
Leh city is the administrative centre of the Leh district in the Union Territory of Ladakh, which lies in the northernmost Part of India. Leh is situated in the upper Indus River basin at an altitude of approximately 3,500 m above sea level, surrounded by the high-altitude ranges of the Ladakh and Zanskar mountains (Kumar & Srivastava, 2018) [8] . The area is one of the most elevated permanently inhabited regions in the world, characterized by harsh environmental conditions, barren vegetation, and a predominantly cold-arid climate (Rizvi, 1999) [14] . The geographic remoteness and unique physiography of the region have created a distinct cultural, ecological, and geomorphological environment, rendering Leh an important location for landscape research. Climatically, the Leh region belongs to a cold desert ecosystem, and its annual precipitation is less than 100 mm, which is mainly in the form of snowfall (Ali et al., 2022) [1] . In this upper part of the Indus, the river passes through a broad alluvial valley with steep side-mountain slopes and vast glaciogenic and fluvio-glacial formations (Nusser et al., 2012) [10] . The human settlement is concentrated on the Indus River and its tributary streams, where irrigation with glaciers has long supported small-scale irrigation, which includes barley, wheat, and vegetables.
Methodology
The research approach in this study consists of a descriptive and evaluation-based methodology to categorize human activities impact on the landscapes. The technique incorporates field recording, remote sensing, and processbased interpretation to determine and classify the anthropogenic alteration. Anthropogenic landforms at each observation point were recorded by field surveys, GPS geotagging, and visual interpretation of high-resolution satellite images. The features of landforms were documented under: surface modification (cutting, filling, levelling), removal of vegetation, Hydrological alteration, and construction of artificial structures. The anthropogenic landscapes in this study were also classified according to the type of human interference, which was categorized under the Szabo and Dávid anthropogenic landform classification system. The study also uses multi-temporal satellite images and GIS-based analytical approaches to detect, quantify, and assess LULC changes in Leh during a 30-year period (1990-2020). The study aims to identify major land transformation processes, spatial patterns of change, and their consequences for landscape stability and resource management in this high-altitude cold desert environment using a uniform classification scheme and change detection approach.
Results and Discussion
The landscapes of Leh city and its surrounding areas are undergoing a profound change due to multiple forms of anthropogenic intervention. Urban expansion, intensification of tourism, infrastructural development, road construction, water management, agricultural change, resource extraction, and climate adaptation action measures all contribute to the reshaping of the natural and cultural environment of the region. These interventions have transformed Leh from a traditional high-altitude settlement with an agrarian base into a quickly urbanising, serviceoriented and strategically important centre. Using the modified Szabo and David classification, the identified anthropogenic landforms in each observation point were categorized based on the type of intervention and process, as shown in (Table 1). [9] . Leh City's urban growth is driven by several factors, including the development of administration and infrastructure, migration from rural to urban areas, the expansion of the tourism industry, and the region's geopolitical significance (Dame et al., 2019) [4] . Rapid changes in infrastructure development, the socioeconomic conditions of society, and the expansion of urbanization and population began after 1975, when the region opened to tourists. This is the turning point for the gradual expansion of urbanization in Leh Town. The urban population of Leh increased gradually from 1961 to 1981, but after 1981 it increased rapidly, as shown in the graph (Figure 2).
Anthropogenic impact on landscapes due to irrigation and water management
Humans have intentionally transformed fluvial landscapes by constructing artificial embankments, irrigation channels, dams, and reservoirs (Hudson & Middelkoop, 2015) [7] .
Almost the entire agricultural Land in Ladakh is dependent on Irrigation canals. Two types of irrigation systems can be distinguished in the study area 1) the glacier-fed irrigation in the tributary valleys, and the main valley irrigation system fed by the Indus River. Numerous large and small artificial irrigation canals have been constructed by farmers to divert water from the Glacial-fed streams and the Indus River to carry water to their fields. These artificial irrigation canals, on the one hand, play a major role in agricultural land use in the study region, and on the other hand, they alter river flows and sediment transport by diverting large amounts of water. Major land cover changes from barren to cultivable land in areas under irrigation in the Indus Valley and its tributary valleys increased from 88km in the late 1960s to 100km in 2009 (Nusser et al., 2012) [10] . The most massive human intervention in the development of the irrigated area was the government-funded launch of the Igu-Phey canal in 1979. The purpose of these 43 km-long canals is to divert water from the Indus River to arable barren lands along the left bank of the Indus River from Igoo to Phey. Another major human influence on the region's hydrological regime is the river embankment and the hydroelectric project Dam. River embankments are observed in the wide flood plain between Stakna in the west to Spituk in the east. Steel net stone cage river embankments (Figure 6a) are used to protect land on flood plains from river flooding and also to divert water from the Indus to irrigate the field located on the edge of the braided channel. The Nimmo-Basgo hydroproject (Figure 6b) situated on the Indus River at Alchi village acts as a barrier to trap a huge quantity of sediments in the upstream and also changes the flow of stream.
Anthropogenic influence on the Landscape due to Road infrastructure
Road reconstruction in the Leh-Ladakh region has become one of the most important agents of anthropogenic landscape modification within the last few decades. Ladakh, its geopolitical importance, and the road infrastructure development in the region have been maintained and monitored by the Border Road Organization under the Ministry of Defence. Owing to its geopolitical importance, harsh climate, and difficult terrain, the region is undergoing continuous upgradation, widening, and realignment of existing roads to enhance connectivity and facilitate tourism and military mobility. Lying in the trans-Himalaya, road construction in the region often requires cutting into the hillside to create a level for the road. This alteration of natural slopes during road construction destabilizes them and leads to increased soil erosion and landslides (Figure 7a).
Anthropogenic impact on landforms due to Mining and Quarrying
Mining and Quarrying extract a wide range of useful materials (such as sand, stone, gravel, coal, and iron) directly from the surface and from the ground. These substances are widely used in the building and manufacturing industries, and they have been directly
altering the landscape by creating new landforms (Bell et al., 2001) [2] . Stone crushing and sand Quarrying are dominant activities in the study area. Due to the increasing demand for building materials and the rapid growth of construction activity in Leh city and the nearby areas, to meet society's needs for housing and infrastructure development, as well as the modern requirements of an expanding population, several stone crushing and quarrying units are opening around the peripheral areas of Leh town.
During the field observation, 13 stone crushers and mining units were identified, of which two are not in Operation.
The most significant area affected by mining activities in the study area is Phey 2, where mining has transformed 3,10,678 Sqm. These mining and quarrying activities create large open pits, and the waste materials excavated from mines are frequently deposited on the ground surface as spoil heaps (Figure 8a). Stone crushing and quarrying activities in this area have a significant impact on the environment and the health of people in the surrounding areas.
Figures and tables from the paper
| Year | Urban population of Leh district | Total population of Leh district | The percentage of the population living in urban areas |
|---|---|---|---|
| 1961 | 3720 | 43,587 | 8.53 |
| 1971 | 5519 | 51,891 | 10.63 |
| 1981 | 8718 | 68,380 | 12.74 |
| 2001 | 28,639 | 1,17,232 | 24.42 |
| 2011 | 45671 | 1,33,487 | 34.21 |
Table text extracted from the original PDF; superscript letters are shown inline. The original table image is below.
View original table image
| Class | Year 1990 | — | Year 2001 | — | Year 2010 | — | Year 2020 | — |
|---|---|---|---|---|---|---|---|---|
| Area in Hectare | Area in Hectare | Area in Hectare | Area in Hectare | |||||
| Barren Land | 1747.51 | 65.94% | 1485.98 | 55.88% | 1216.65 | 45.75 | 854.67 | 32.14% |
| Agriculture and vegetation | 797.77 | 30% | 745.23 | 28% | 646.74 | 24.32% | 469.81 | 17.68% |
| Build-up | 112.20 | 4% | 422.19 | 15.91% | 790.97 | 29.76 | 1331.98 | 50.09% |
| Water Bodies | 1.60 | 0.06% | 5.68 | 0.21% | 4.72 | 0.17% | 2.62 | 0.09% |
| Total | 2659.08 | 100% | 2659.08 | 100% | 2659.08 | 100% | 2659.08 | 100% |
Table text extracted from the original PDF; superscript letters are shown inline. The original table image is below.
View original table image
| Mining /Quarrying area | Sub-area | Geo coordinates | Elevation | Area of parameters | Area affected by Mining in Sq.m |
|---|---|---|---|---|---|
| TUCHIK | Tuchik 1 | 34º02′20.55″ N 77º35′48.54″ E | 3517m | 1407m | 76,901 Sq.m |
| Tuchik 2 | 34º02′35.54″ N 77º35′26.45″ E | 3465m | 3228m | 1,45, 923sq.m | |
| STOK | Stok 1 | 34º04′42.18″ N 77º32′40.26″ E | 3432m | 2872m | 101,134 sq.m |
| Stok 2 | 34º04′48.86″ N 77º32′21.91″ E | 3428m | 777m | 18283 sq.m | |
| Stok 3 | 34º05′11.03″ N 77º32′14.76″ E | 3426m | 1282 m | 68,176 Sq. Mt | |
| Stok 4 | 34º05′17.97″ N 77º32′37.29″ E | 3368m | 1340Mt | 64,996 Sq. Mt | |
| SPITUK | Spituk 1 | 34º06′09.91″ N 77º30′29.39″ E | 3396m | 2438 Mt | 176,669 Sqm |
| Spituk 2 | 34⁰06′39″ N 77⁰29′21″ E | 3422m | 1451 Mt | 84,919 Sqm | |
| PHEY | Phey 1 | 34º07′33.26″ N 77º28′13.68″ E | 3220m | 2938 Mt | 2,01,619 Sqm |
| Phey 2 | 34º08′27.14″ N 77º27′46.78″ E | 3253m | 3089 Mt | 3,10,678 Sqm | |
| SHEY | Shey | 34⁰4′31.71″ N 77⁰38′4.24″ E | 3319m | 1250m | 61,491 Sqm |
| STONGSER | Stongser | 34⁰36′32.11″N 77⁰36′32.33″E | 3476m | 336m | 7285 Sqm |
| Kharu | Kharu | 33⁰56′10.66″ N 77⁰43′52.51″ E | 3363m | 1196M | 50,620 sqm |
Table text extracted from the original PDF; superscript letters are shown inline. The original table image is below.
View original table image
References
14 in the original paper- Ali SN, Singh R, Morthekai P, Sharma A, Phartiyal B, Quamar MF, et al. Perception of climate change from the Himalayan 'cold desert' Ladakh, India. Journal of Palaeosciences. 2022;71(1):89-111.
- Bell F, Bullock S, Hälbich T, Lindsay P. Environmental impacts associated with an abandoned mine in the Witbank Coalfield, South Africa. International Journal of Coal Geology. 2001;45(2-3):195-216.
- Census of India 2011. Leh District: Census 2011-2025 Data. 2011 Available from: http://www.census2011.co.in/census/district/621leh.html.
- Dame J, Schmidt S, Müller J, Nüsser M. Urbanization and socio-ecological challenges in high mountain towns: Insights from Leh (Ladakh), India. Landscape and Urban Planning. 2019;189:189-199.
- Gaur MK, Goyal R, Kanwar MS, Singh N, Choudhary V, Chichaghare A. Prospects and challenges for biodiversity in the anthropogenic-induced cold arid landscape of Ladakh, India. Japan Journal of Research. 2024;5(6):1-12.
- Hooke RL, Martín Duque JF, De Pedraza Gilsanz J. Land transformation by humans: a review. GSA Today. 2012;22(12):4-10.
- Hudson PF, Middelkoop H. Geomorphic approaches to integrated floodplain management of lowland fluvial systems in North America and Europe. In: Geomorphic Approaches to Integrated Floodplain Management. Springer; 2015. p. 1-25.
- Kumar A, Srivastava P. Landscape of the Indus River. In: Springer Hydrogeology. Springer; 2018. p. 47-59.
- McGrane SJ. Impacts of urbanisation on hydrological and water quality dynamics, and urban water management: a review. Hydrological Sciences Journal. 2016;61(13):2295-2311.
- Nüsser M, Schmidt S, Dame J. Irrigation and development in the Upper Indus Basin: characteristics and recent changes of a socio-hydrological system in central Ladakh, India. Mountain Research and Development. 2012;32(1):51-61.
- Nir D. Man, a geomorphological agent: an introduction to anthropic geomorphology. Springer Science & Business Media; 1983.
- Nilsson C, Reidy CA, Dynesius M, Revenga C. Fragmentation and flow regulation of the world's large river systems. Science. 2005;308(5720):405-408.
- Pandit MK, Manish K, Koh LP. Dancing on the Roof of the World: Ecological transformation of the Himalayan landscape. Bioscience. 2014;64(11):980-992.
- Rizvi J. Ladakh: crossroads of High Asia. Oxford: OUP Catalogue; 1999.