
Research article · 2025 · Full text
International Journal of Advanced Chemistry ResearchA novel copper (II)-selective membrane potentiometric sensor based on new imine quinoline derivative ligand: (Z)-3-(((2-((2-Aminophenyl) Thio) phenyl) imino) methyl)-7-chloronaphthalen-2-ol
Volume 7(10) · Pages 39–45 · DOI: 10.33545/26646781.2025.v7.i10a.322 ↗
Research areasAnalytical Chemistry and SensorsMolecular Sensors and Ion DetectionAdvanced Chemical Sensor Technologies
Abstract
Author-writtenThe imine-quinoline derivative ligand, namely (Z)-3-(((2-((2-aminophenyl) thio) phenyl) imino) methyl)-7-chloronaphthalen-2-ol, was synthesized and employed as an ionophore in the fabrication of poly (vinyl chloride) (PVC)-based membrane electrodes selective for Cu (II) ions. Optimal electrode performance was achieved with a membrane formulation consisting of (L): PVC: NaTPB: NPOE in the ratio 5:120:3: 150.The developed sensor exhibited excellent selectivity and sensitivity towards Cu (II) ions over a wide range of competing cations, including alkali, alkaline earth, transition, and heavy metal ions. The effects of membrane composition, solution pH, and the presence of anionic additives on the potentiometric response were systematically examined. The electrode demonstrated near-Nernstian behaviour with a slope of 29.6 mV decade⁻¹ over a broad concentration range of 5.0 × 10⁻⁷ to 1.0 × 10⁻¹ mol L⁻¹, with a detection limit of 3.0 × 10⁻⁷ mol L⁻¹. The sensor provided rapid response times (
Summary
Source-checkedPlain-language reading of the full paper, prepared with AI and checked against the text. Each point links to the authors' own words.
Why it matters
- Measuring copper levels is important because copper is widely found in various environmental settings. View evidence ↗
- While moderate copper levels are tolerable, excessive exposure can cause neurological, gastrointestinal, and tissue irritation symptoms. View evidence ↗
- Existing analytical methods for copper quantification often require expensive equipment and specialized expertise, limiting their use for simple on-site testing. View evidence ↗
What they did
- The IQL ligand was synthesized through a 1:1 condensation reaction of 7-chloro-2-hydroxyquinoline-3-carbaldehyde and 2,2′-thiodianiline. View evidence ↗
- The best-performing sensor membrane used a specific weight ratio of 5 parts ligand (L), 120 parts PVC, 3 parts NaTPB, and 150 parts NPOE. View evidence ↗
- Potentials were measured at 25±0.1 °C using a cell assembly featuring silver/silver chloride reference electrodes. View evidence ↗
What they found
- The optimized sensor showed a near-Nernstian slope of 29.6 mV decade⁻¹ for copper concentrations between 5.0 × 10⁻⁷ and 1.0 × 10⁻¹ mol L⁻¹, with a detection limit of 3.0 × 10⁻⁷ mol L⁻¹. View evidence ↗
- The sensor responded quickly to changes in copper concentration, with response times under 15 seconds. View evidence ↗
- The electrode's potential remained stable across a pH range of 3.5 to 7.5. View evidence ↗
- The sensor demonstrated high selectivity for Cu²⁺ over various other mono-, di-, and trivalent cations, as indicated by selectivity coefficients significantly lower than 1.0. View evidence ↗
- The sensor remained reliable in mixed solvent environments containing up to 20% (v/v) of methanol, ethanol, or acetone. View evidence ↗
- When used as an indicator electrode for titration with EDTA, the sensor confirmed a 1:1 stoichiometric formation of the Cu-EDTA complex. View evidence ↗
- The sensor's measurements of copper in wastewater (e.g., 1.64±0.02 mg L⁻¹ for sample 1) were in good agreement with results from atomic absorption spectrometry (AAS). View evidence ↗
What it means
- The authors conclude that their sensor performs as well as or better than previously reported copper-selective electrodes regarding response time, pH tolerance, concentration range, and detection limit. View evidence ↗
- The authors recommend this electrode as a valuable tool for routine analytical applications requiring reliable Cu²⁺ detection. View evidence ↗
Visual summary
3 visualsIllustrations explain the paper; charts are replotted from the paper's own table values.
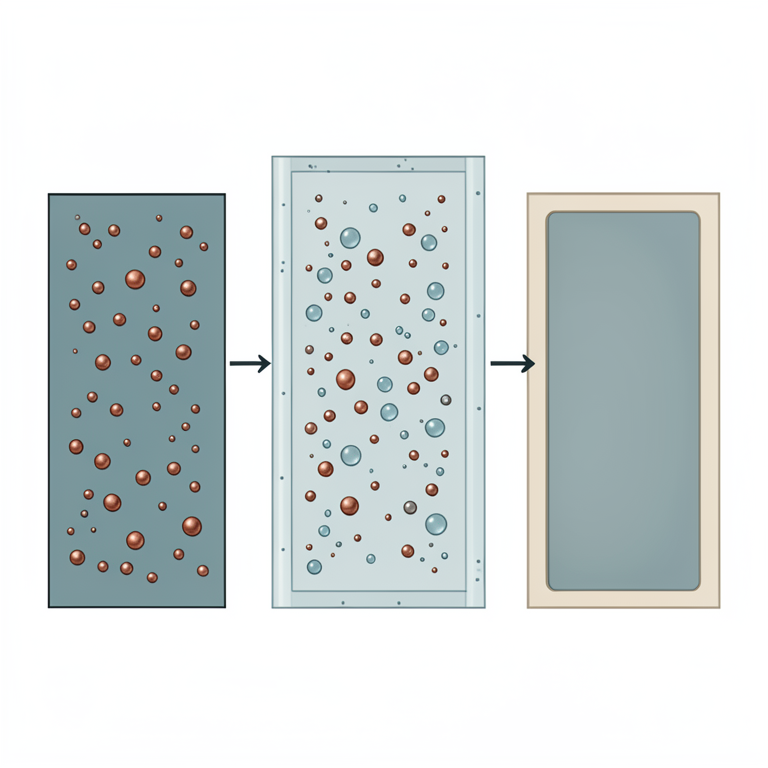
Sensor Composition Diagram
AI-generated conceptual illustration (A PVC-based ion-selective membrane sensor for copper ions). It explains the idea and does not show study data.
View source evidence ↗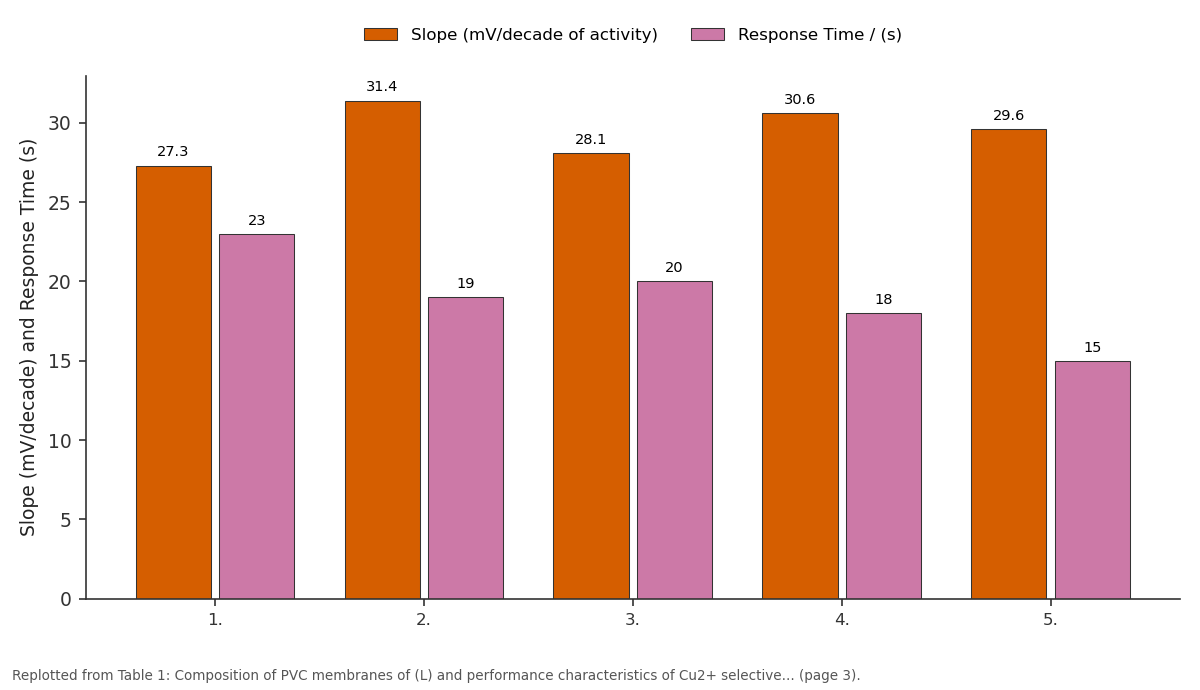
Slope (mV/decade of activity) and Response Time / (s): 1. vs 2. vs 3. vs 4. vs 5.
Replotted from Table 1 (page 3) of the original paper. Every bar is the paper's own table value.
View source evidence ↗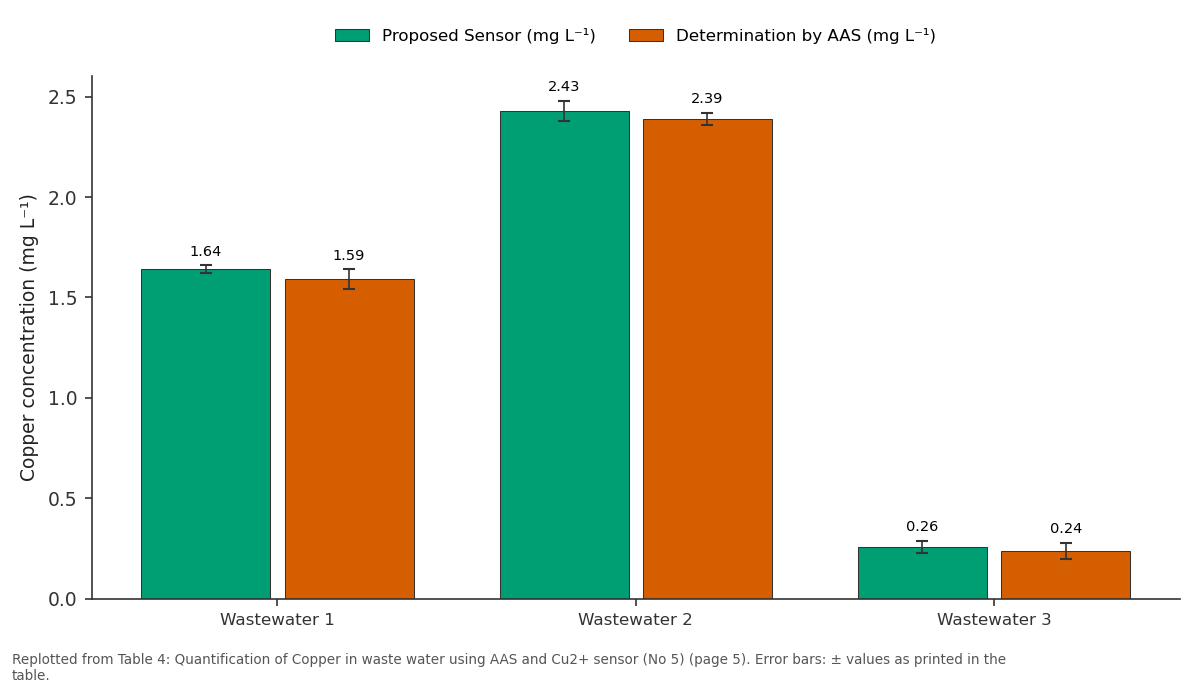
Proposed Sensor (mg L⁻¹) and Determination by AAS (mg L⁻¹): Wastewater 1 vs Wastewater 2 vs Wastewater 3
Replotted from Table 4 (page 5) of the original paper. Every bar is the paper's own table value.
View source evidence ↗Figures & tables
From the original paper Table 1
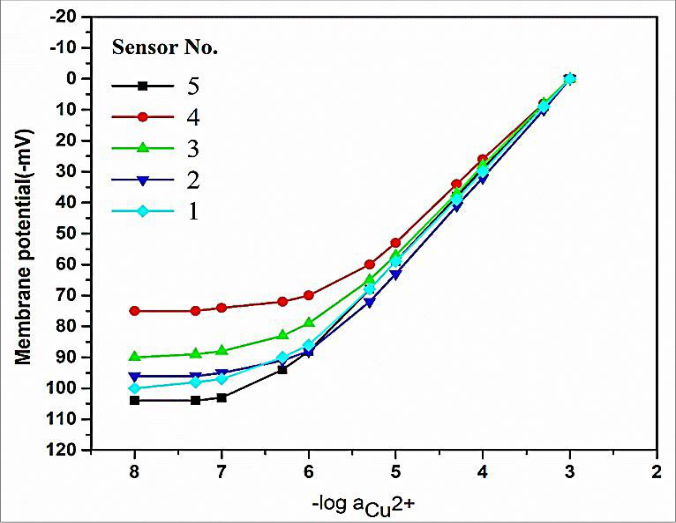 Figure 1
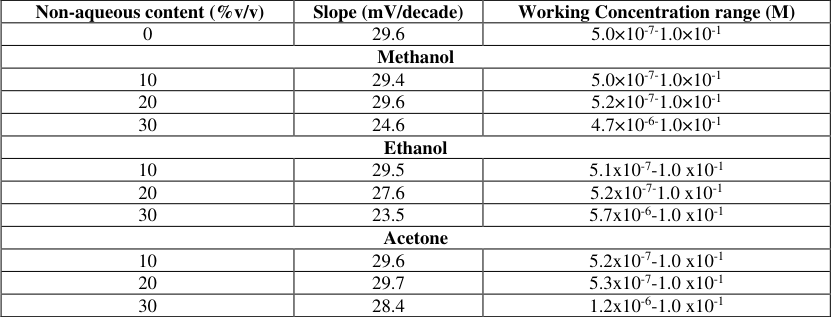 Table 2
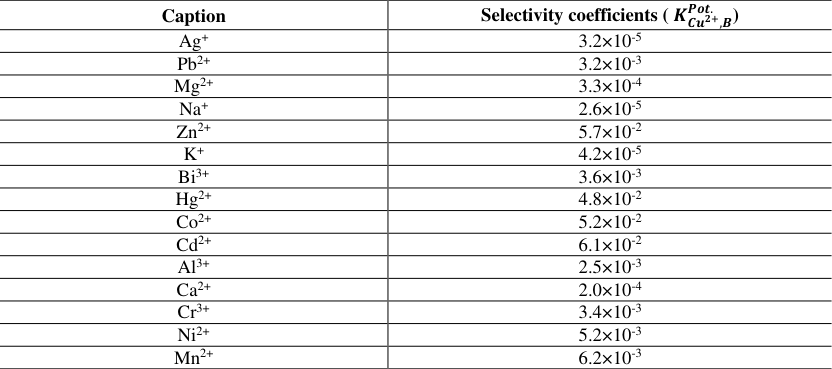 Table 3
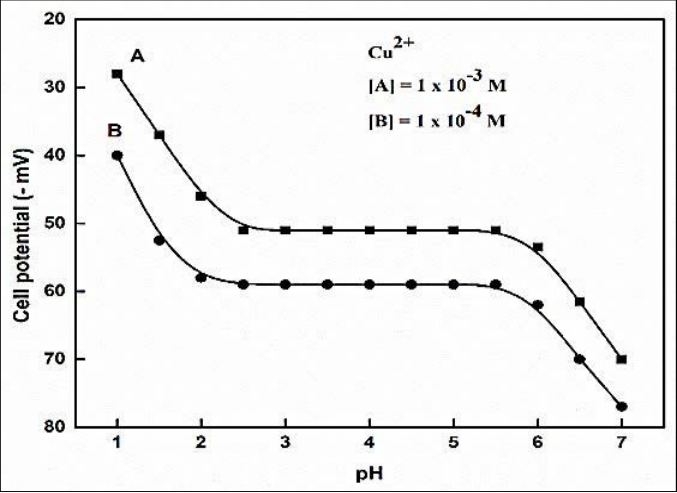 Figure 2
 Table 4
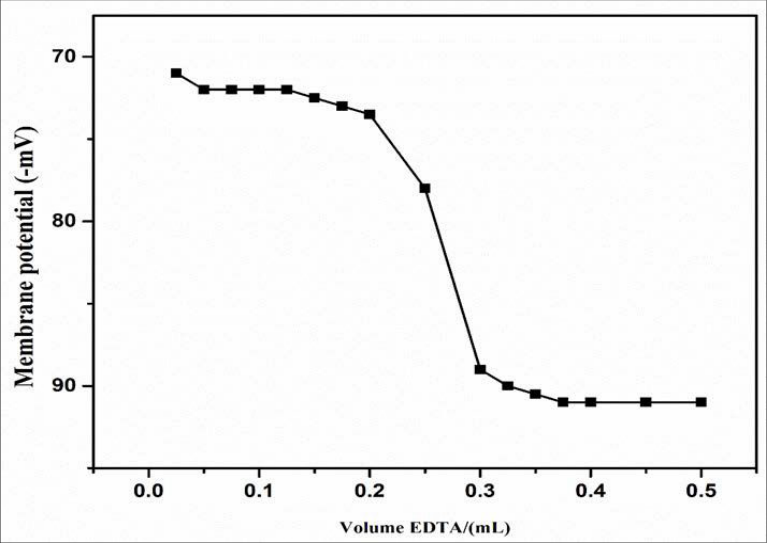 Figure 4
Text
The selective interaction between metal ions and ligands constitutes a fundamental recognition mechanism in the design of potentiometric sensors [25] . Given the critical demand for highly selective potentiometric detection of trace-level copper ions particularly in food and water matrices numerous ionophores have been explored as potential ion carriers in the fabrication of Copper (II) ionselective electrodes (ISEs) [26][27][28][29][30][31] . In the present communication New Imine Quinoline Ligand (IQL) viz (Z)-3-(((2-((2-Aminophenyl) Thio) phenyl) imino) methyl)-7chloronaphthalen-2-ol has been synthesized and explored for the preparation of Cu 2+ sensors and results are presented in the present paper.
Experimental Section 2.1 Reagents and Materials
High-molecular weight polyvinyl chloride (PVC) was obtained from Aldrich (USA). 2-Nitrophenyl octyl ether (NPOE) was procured from ACROS Organics (New Jersey, USA), dioctyl phthalate (DOP) from Reidel (India), chloronaphthalene (CN) from Merck (Germany), and tri-nbutyl phosphate (TBP) from BDH (England). Sodium tetraphenyl borate (NaTPB) was supplied by BDH (UK). All reagents were used without further purification. Stock solutions of 0.1 M concentration were prepared by dissolving analytical reagent (AR) grade metal nitrates in double-distilled water and were standardized when required. Working solutions of desired concentrations were subsequently obtained by appropriate dilution of the stock solutions. Solvents and reagents were purified and dried by distillation
Synthesis of the Imine Quinoline Derivative Ligand (IQL):(Z)-3-(((2-((2-Aminophenyl) Thio) phenyl) imino) methyl)-7-chloronaphthalen-2-ol
The ligand, (Z)-3-(((2-((2-aminophenyl) thio) phenyl) imino) methyl)-7-chloronaphthalen-2-ol [L], was synthesized [32] as outlined in Scheme 1, via the condensation reaction of 7-chloro-2-hydroxyquinoline-3carbaldehyde with 2,2′-thiodianiline in an equimolar ratio (1:1).
Specifically, a solution of 7-chloro-2hydroxyquinoline-3-carbaldehyde (10 mmol, 1.5 g) was prepared in 15 mL of ethanol, to which a solution of 2,2′thiodianiline (10 mmol, 2.2 g) in 15 mL ethanol was added gradually under continuous stirring. The reaction mixture was stirred for 1-2 h at ambient temperature, resulting in the formation of a yellow solution. Subsequently, 5-10 drops of glacial acetic acid were introduced into the mixture while stirring. The progress of the reaction was monitored by thinlayer chromatography (TLC). Upon completion, a yellow precipitate was obtained, which was collected by filtration, washed thoroughly with 20 mL ethanol, and dried to constant weight. The product was isolated as a yellow crystalline solid with a yield of 89.2%, melting point 145-150 °C, and molecular weight 405.9 g/mol. The infrared spectral analysis exhibited characteristic absorption bands at 3854 cm⁻¹ and 1734 cm⁻¹ (ν-NH), 3742 cm⁻¹ (ν-OH), and 1601, 1560 cm⁻¹ (ν-C=N).
Preparation of Membrane Electrodes
The PVC membranes were prepared according to the following general procedure. The required amounts of membrane ingredients: 30 mg PVC, 50 mg NPOE, 15 mg OA and 5 mg DIBAE was mixed and dissolved completely in 5 mL THF. The resulting mixture was transferred into a glass dish of 2 cm diameter. The solvent was evaporated slowly until an oily concentrated mixture was obtained. A Pyrex tube (3-5 mm in top) was dipped into the oily mixture for about 10s, so that a nontrans parent film of about 0.3 mm thickness was formed. The tube was then pulled out from the mixture and kept at room temperature about 2 h. The tube was then filled with internal filling solution (1.0 x 10 -3 M copper nitrate). The electrode was finally conditioned for 24 h by soaking in a 1.0 x 10 -2 M solution of Cu (NO 3 ) 2 . A silver-silver chloride electrode was used as an internal reference electrode.
Equilibration of Membranes and Potential Measurements
The membranes were equilibrated for 4 days in 1.0 × 10 -1 mol L -1 Cu(NO 3 ) 2 solution. The potentials were measured by varying the concentration of Cu(NO 3 ) 2 in test solution in the range 1.0 × 10 -8-1.0 × 10 -1 mol L -1 . Each solution was stirred and the potential reading was recorded when it became stable, and then plotted as logarithmic function of Cu 2+ cation activity. The activities of metal ions were calculated using the following modified form of the Debye-Huckel equation:
Where µ is the ionic strength and Z the valency, The potential were measured at 25±0.1 °C using silver electrodes as reference electrodes with the following cell assembly:
Results and Discussion
Results and Discussion
Potential Response of the membranes
The electrochemical response of the fabricated sensors was evaluated as a function of Cu²⁺ ion concentration (Figure 1).
From these calibration plots, the linear working concentration ranges and slopes were determined, and the corresponding data including membrane composition and response times are summarized in Table 1. As evident from Figure 1, the sensor designated as No 1, consisting of the Imine Quinoline Derivative Ligand (I) incorporated into a PVC matrix without any plasticizer, exhibited a linear response within the concentration range of 7.0 × 10⁻ 6 to 1.0 × 10⁻¹ M. The electrode displayed a near-Nernstian slope of 27.3±0.1 mV per decade of activity with a response time of 23 s. However, the relatively narrow linear range necessitated further optimization.
| — | Components in membranes (w/w) | — | — | — | — | — | — | — | — | — |
|---|---|---|---|---|---|---|---|---|---|---|
| Sr. No. | L | PVC | NaTPB | CN | TBP | DOP | NPOE | Working Concentration range | Slope (mV/decade of activity) | Response Time |
| M | (s) | |||||||||
| 1. | 5 | 120 | 3 | - | - | - | - | 7.0 × 10⁻⁶ to 1.0 × 10⁻¹ | 27.3 | 23 |
| 2. | 5 | 120 | 3 | 150 | - | - | 6.3 × 10⁻⁶ to 1.0 × 10⁻¹ | 31.4 | 19 | |
| 3. | 5 | 120 | 3 | - | 150 | - | - | 6.1 × 10⁻⁶ to 1.0 × 10⁻¹ | 28.1 | 20 |
| 4. | 5 | 120 | 3 | - | - | 150 | - | 5.5 × 10⁻⁶ to 1.0 × 10⁻¹ | 30.6 | 18 |
| 5. | 5 | 120 | 3 | - | - | - | 150 | 5.0 × 10⁻⁷ to 1.0 × 10⁻¹ | 29.6 | 15 |
Table text extracted from the original PDF; superscript letters are shown inline. The original table image is below.
View original table image
To enhance the electro analytical performance, plasticizers were introduced into the membrane composition. Incorporation of plasticizers not only facilitated improved mechanical flexibility and durability of the membranes but also broadened the concentration range, enhanced stability, and extended the operational lifetime of the sensors [33,34] . Nevertheless, the selectivity characteristics remained predominantly governed by the specific metal-ionophore interactions. An ideal plasticizer for membrane preparation should possess high lipophilicity, elevated molecular weight, negligible exudation tendency from the polymer matrix, low vapor pressure, and sufficient solvating capacity for the ionophore and additives. Furthermore, appropriate viscosity and dielectric constant values are essential to ensure optimal membrane performance [35] .
pH and solvent effect
The pH response characteristics of the membrane sensor (No. The operational characteristics of the sensor were additionally evaluated in partially non-aqueous environments, specifically in methanol-water, ethanolwater, and acetone-water binary mixtures. The experimental data are presented in Table 2. It was observed that an increase in the proportion of the aqueous phase led to a slight enhancement in the slope of the calibration curve; however, this was accompanied by a reduction in the linear dynamic concentration range. The electrode exhibited reliable performance in media containing up to 20% (v/v) methanol, ethanol, or acetone. Beyond this threshold, a pronounced decrease in the effective working concentration range was recorded, indicating limitations of the sensor at higher non-aqueous solvent content. )
| Non-aqueous content (%v/v) | Slope (mV/decade) | Working Concentration range (M) |
|---|---|---|
| 0 | 29.6 | 5.0×10⁻⁷-1.0×10⁻¹ |
| Methanol | ||
| 10 | 29.4 | 5.0×10⁻⁷-1.0×10⁻¹ |
| 20 | 29.6 | 5.2×10⁻⁷-1.0×10⁻¹ |
| 30 | 24.6 | 4.7×10⁻⁶-1.0×10⁻¹ |
| Ethanol | ||
| 10 | 29.5 | 5.1x10⁻⁷-1.0 x10⁻¹ |
| 20 | 27.6 | 5.2x10⁻⁷-1.0 x10⁻¹ |
| 30 | 23.5 | 5.7x10⁻⁶-1.0 x10⁻¹ |
| Acetone | ||
| 10 | 29.6 | 5.2x10⁻⁷-1.0 x10⁻¹ |
| 20 | 29.7 | 5.3x10⁻⁷-1.0 x10⁻¹ |
| 30 | 28.4 | 1.2x10⁻⁶-1.0 x10⁻¹ |
Table text extracted from the original PDF; superscript letters are shown inline. The original table image is below.
View original table image
3.2×10 -3 Mg 2+ 3.3×10 -4 Na + 2.6×10 -5 Zn 2+ 5.7×10 -2 K + 4.2×10 -5 Bi 3+ 3.6×10 -3 Hg 2+
4.8×10 -2 Co 2+ 5.2×10 -2 Cd 2+
6.1×10 -2 Al 3+ 2.5×10 -3 Ca 2+ 2.0×10 -4 Cr 3+ 3.4×10 -3 Ni 2+ 5.2×10 -3 Mn 2+ 6.2×10 -3
Potentiometric Selectivity
The selectivity of membrane sensors is one of the most important parameters that determines the utility of the sensor. Thus, selectivity studies were carried out only for sensor no 5, which exhibited the best performance characteristics. The selectivity coefficients (끫롼 끫롬끫롬 2+ ,끫롪 끫뢆끫뢆끫뢆. ) were determined by the modified form of Fixed Interference Method as suggested by Sae's de Viteri and Diamond [36] and are given in Table 3.
| Caption | Selectivity coefficients ( 끫끫룤 끫룮 끫룮룮. ) 끫룔끫룔끫뾠+ ,끫 |
|---|---|
| Ag+ | 3.2×10⁻⁵ |
| Pb2+ | 3.2×10⁻³ |
| Mg2+ | 3.3×10⁻⁴ |
| Na+ | 2.6×10⁻⁵ |
| Zn2+ | 5.7×10⁻² |
| K+ | 4.2×10⁻⁵ |
| Bi3+ | 3.6×10⁻³ |
| Hg2+ | 4.8×10⁻² |
| Co2+ | 5.2×10⁻² |
| Cd2+ | 6.1×10⁻² |
| Al3+ | 2.5×10⁻³ |
| Ca2+ | 2.0×10⁻⁴ |
| Cr3+ | 3.4×10⁻³ |
| Ni2+ | 5.2×10⁻³ |
| Mn2+ | 6.2×10⁻³ |
Table text extracted from the original PDF; superscript letters are shown inline. The original table image is below.
View original table image
A selectivity coefficient of 1.0 signifies an identical response towards both the primary ion and the interfering ion. As presented in Table 3, the obtained selectivity coefficients are considerably lower than 1.0, indicating that the sensor exhibits high selectivity for Cu²⁺ in comparison to the examined mono-, di-, and trivalent cations. Therefore, this sensor is suitable for the determination of Cu²⁺ in the presence of these metal ions, provided their concentrations are equal to or lower than that of Cu²⁺.
Potentiometric Titration
The applicability of the sensor was further evaluated by employing it as an indicator electrode in the potentiometric titration of Cu²⁺ ions. For this purpose, 10 mL of 1.0 × 10⁻³ M Cu(NO₃)₂ solution was titrated against 1.0 × 10⁻² M EDTA. The pH of the medium was adjusted and maintained at 4.0 using dilute HCl and NaOH. The resulting titration curve (Figure 4) exhibited a typical sigmoidal profile, and the equivalence point confirmed the 1:1 stoichiometric formation of the Cu-EDTA complex.
Analytical Application
The sensor was also used to determine the concentration of
Copper in waste water. The result obtained by the proposed sensor is in good agreement with AAS (Table 4).
| Name of Samples | Proposed Sensor (mg L⁻¹) | Determination by AAS (mg L⁻¹) |
|---|---|---|
| Wastewater 1 | 1.64±0.02 | 1.59±0.05 |
| Wastewater 2 | 2.43±0.05 | 2.39±0.03 |
| Wastewater 3 | 0.26±0.03 | 0.24±0.04 |
Table text extracted from the original PDF; superscript letters are shown inline. The original table image is below.
View original table image
Conclusion
The present study highlights the effectiveness of the membrane sensor containing the imine-quinoline derivative ligand, (Z)-3-(((2-((2 aminophenyl)thio) phenyl)imino) methyl)-7-chloronaphthalen-2-ol (IQL), as the electroactive component for the selective detection of Cu²⁺ ions. The sensor exhibits a wide linear response over the concentration range of 5.0 × 10⁻⁷ to 1.0 × 10⁻¹ mol L⁻¹ with an optimal working pH window of 2.8-5.8. Interfering ions commonly coexisting with Cu²⁺ in real samples show negligible effect on its performance. The electrode has also been successfully applied as an indicator in the potentiometric titration of Cu(II) with EDTA, demonstrating its analytical applicability. The sensor offers rapid response, high reproducibility, and prolonged operational stability exceeding six months in both aqueous and mixed solvent systems. Compared with previously reported copperselective electrodes, the proposed sensor displays either equivalent or superior performance in terms of detection limit, concentration range, pH tolerance, and response time. Thus, this electrode represents a valuable contribution to the development of reliable Cu²⁺ ion-selective sensors for routine analytical applications.
Acknowledgement
AcknowledgementsThe authors express their sincere gratitude to MS College, Saharanpur, and the IIC, Roorkee, for extending the essential facilities required for this work.
Figures and tables from the paper
References
36 in the original paper- Scheinberg H, Morell AG. Inorganic Biochemistry. Amsterdam: Elsevier; 1973.
- Ali A, Shen H, Yin X. Simultaneous determination of trace amounts of nickel, copper and mercury by liquid chromatography coupled with flow-injection on-line derivatization and preconcentration. Anal Chim Acta. 1998;369(3):215-223.
- Harvey D. Modern Analytical Chemistry. New York: Wiley; 2000, p. 816.
- Thakur M, Deb MK. The use of 1-[pyridyl-(2)-azo]- naphthol-(2) in the presence of TX 100 and N,N'- diphenylbenzamidine for the spectrophotometric determination of copper in real samples. Talanta. 1999;49:561-569.
- Barreto SRG, Nozaki J, Barreto WJ. Spectrophotometric determination of copper in metallic alloy using a bidithiolene: A comparative study. Microchem J. 1999;62:223-228.
- Chimpalee N, Chimpalee D, Lohwithee S, Nakwatchara L, Burns DT. Spectrophotometric determination of copper after extraction of its chelate with bis(acetylacetone)ethylenediimine. Anal Chim Acta. 1996;329:315-318.
- Karabocek S, Nohut S, Dalman O, Guner S. A new spectrophotometric reagent for copper: 3,3-(1,3propanediyldiimine)bis-[3-methyl-2-butanone]dioxime. Anal Chim Acta. 2000;408:163-168.
- Van Staden JF, Botha A. A spectrophotometric determination of Cu(II) with sequential injection analysis. Talanta. 1999;49:1099-1108.
- Neudachina LK, Oshintseva EV, Skorik YA, Vshivkovа AA. N-Aryl-3-amino-propionic acids as selective reagents for the determination of copper in metallurgical products. J Anal Chem. 2005;60:240-246.
- Ivaska A, Kubiak WW. Application of sequential injection analysis to anodic stripping voltammetry. Talanta. 1997;44:713-723.
- Mashhadizadeh MH, Pesteh M, Talakesh M, Sheikhshoaie I, Ardakani MM, Karimi MA. Solid phase extraction of lead(II), copper(II), cadmium(II) and nickel(II) using gallic acid-modified silica gel prior to determination by flame atomic absorption spectrometry. Spectrochim Acta B. 2008;63:885-888.
- Cassella RJ, Magalhaes OIB, Couto MT, Lima ELS, Neves MAFS, Coutinho FMB. Synthesis and application of a functionalized resin for flow injection/F AAS copper determination in waters. Talanta. 2005;67:121-128.
- Haasw O, Klarre M, Broaekaert JAC, KrengelRothensee K. Evaluation of the determination of mercury at the trace and ultra-trace levels in the presence of high concentrations of NaCl by flow injection-cold vapour atomic absorption spectrometry using SnCl2 and NaBH4 as reductants. Analyst. 1998;123:1219.
- Magalhães EC, Krug FJ, Fostier AH, Berndt H. Direct determination of mercury in sediments by atomic absorption spectrometry. J Anal At Spectrom. 1997;12:1231-1234.
- Almeida AA, Jun X, Lima JLF, Flame AAS determination of copper in urine using a flow injection on-line preconcentration system based on a polyamine chelating ion exchange column. Atom Spectrosc. 2000;21:187-193.
- Campos RC, Santos HR, Grinberg P. Determination of copper, iron, lead and nickel in gasoline by electrothermal atomic absorption spectrometry using three component solutions. Spectrochim Acta B. 2002;57:15-28.
- Ferreira SLC, Queiroz AS, Fernandes MS, dos Santos HC. Application of factorial designs and Doehlert matrix in optimization of experimental variables associated with the preconcentration and determination of vanadium and copper in seawater by inductively coupled plasma optical emission spectrometry. Spectrochim Acta B. 2002;57:1939-1950.
- Chan CC, editor. Analytical method validation and instrument performance verification. New York: Wiley; 2004, p. 303.
- Potts LW. Quantitative Analysis: Theory and Practice. New York: Harper and Row; 1987, p. 656.
- Vogel AI. Textbook of Macro and Semimicro Qualitative Inorganic Analysis. New York: Bungay; 1979, p. 605.
- Mohadesi A, Taher MA. Voltammetric determination of Cu(II) in natural waters and human hair at a meso2,3-dimercaptosuccinic acid self-assembled gold electrode. Talanta. 2007;72:95-100.
- Christian GD. Analytical Chemistry. New York: Phoenix Color Corp.; 1994. p. 812.
- Fries J, Getrost H. Organic Reagents for Trace Analysis. Darmstadt: E. Merck; 1977, p. 453.
- Jakmunee J, Grudpan KJ. Flow injection amperometry for the determination of iodate in iodized table salt. Anal Chim Acta. 2001;438:299-304.
- Hutchins RS, Bachas LG. Nitrate-selective electrode developed by electrochemically mediated imprinting/ doping of polypyrrole. Anal Chem. 1995;67:1654-1660.
- Singh AK, Jain AK, Singh J, Mehtab S. Development of an electrochemical sensor based on Schiff base for Cu(II) determination at nano level in river water and edible materials. Int J Environ Anal Chem. 2009;89:1081-1098.
- Kopylovich MN, Mahmudov KT, Pombeiro AJL. Poly(vinyl) chloride membrane copper-selective electrode based on 1-phenyl-2-(2hydroxyphenylhydrazo)butane-1,3-dione. J Hazard Mater. 2011;186:1154-1162.
- Vlascici D, Popa I, Chiriac VA, Cosma FG, Popovici H, Cosma FE. Potentiometric detection and removal of copper using porphyrins. Chem Cent J. 2013;111:1-7.
- Chandra S, Toma PK, Kumar A, Malik A, Singh A. Fabrication of copper-selective PVC membrane electrode based on newly synthesized copper complex of Schiff base as carrier. J Saudi Chem Soc. 2016;20:S293-S299.
- Topcu C, Caglar B, Guner EK, Coldur F, Caglar S, Yıldırım O, et al. Novel copper(II)-selective potentiometric sensor based on a folic acidfunctionalized carbon nanotube material. Anal Lett. 2019;16:2524-2545.
- Kumar N. A new Cu2+-selective sensor based on Schiff base as an ionophore in PVC matrix. Int J Chem Anal Sci. 2025;12(1):132-139.
- Shumi G, Demissie TB, Koobotse M, Kenasa G, Beas IN, Zachariah M, et al. Cytotoxic Cu(II) complexes with a novel quinoline derivative ligand: synthesis, molecular docking, and biological activity analysis. ACS Omega. 2024;9(23):25014-25026.
- Zhang W, Jenny L, Spichiger UE. Anal Sci. 2000;16:11.
- Heier PC, Ammann D, Morf WE, Simon W. In: Koryta J, editor. Medical and Biological Application of Electrochemical Devices. New York: Wiley; 1980.
- de los A M, Perez A, Martin LP, Quintana JC, YazdaniPedram M. Sens Actuat B. 2003;89:262.
- Viteri SDFJ, Diamond D. Analyst. 1994;119:749.