
Research article · 2025 · Full text
International Journal of Agriculture and Food ScienceImpact of moist and dry cooking on nutritional qualities of chicken meat
Volume 7(7) · Pages 576–583 · DOI: 10.33545/2664844x.2025.v7.i7h.568 ↗
Research areasFood Industry and Aquatic BiologyMeat and Animal Product Quality
Abstract
Author-writtenA thorough investigation was carried out to evaluate the nutritional qualities of broiler chicken meat by moist (boiling) and grill (dry) cooking. Samples of meat were cooked to reach two internal core temperatures of 75°and 95°C and were evaluated for the composition, vitamin, mineral, amino acid profile and fatty acid profile. The moisture content decreased with a concomitant increase in the other constituents of cooked meat samples of both cooking methods. The protein, fat and ash content increased considerably (P
Summary
Source-checkedPlain-language reading of the full paper, prepared with AI and checked against the text. Each point links to the authors' own words.
Why it matters
- Meat is valued as a high-biological-value source of protein and essential micronutrients, including zinc, iron, and vitamin B12. View evidence ↗
- Cooking is a critical step in meat preparation that can significantly alter the nutritional quality of the final product. View evidence ↗
- Heat treatment may cause negative nutritional changes through protein fraction alterations, vitamin and mineral loss, and lipid oxidation. View evidence ↗
The question
- The study aimed to evaluate how moist (boiling) and dry (grilling) cooking methods affect the nutritional composition, vitamins, minerals, and amino and fatty acid profiles of chicken meat. View evidence ↗
What they did
- The researchers used 30 broiler breast meat samples (approximately 200 g each), cooking them via boiling or grilling to reach internal core temperatures of either 75°C or 95°C. View evidence ↗
- Boiling was performed in a stainless steel pot with a 1:5 water ratio at temperatures above 100°C, while grilling was conducted at 150-160°C using an electrical griddle. View evidence ↗
- Nutritional analysis included HPLC for thiamine, riboflavin, and niacin, and AOAC (2016) recommended methods for mineral determination. View evidence ↗
What they found
- In both cooking methods, increasing the temperature led to a significant decrease in moisture and a corresponding increase in protein, fat, and ash content. View evidence ↗
- Grilled chicken breast meat retained significantly higher concentrations of thiamin, riboflavin, niacin, and cyanocobalamin than boiled meat. View evidence ↗
- Grilled meat showed significantly higher levels of calcium, phosphorus, iron, zinc, and copper compared to boiled meat. View evidence ↗
- Increasing the internal core temperature significantly reduced the content of essential amino acids in both boiling and grilling methods. View evidence ↗
- Compared to raw meat, cooked samples showed decreased total saturated fatty acids (SFA) and increased polyunsaturated (PUFA) and monounsaturated (MUFA) fatty acids, with the SFA reduction being more pronounced in grilled meat. View evidence ↗
- Both the PUFA/SFA ratio and the n-6/n-3 ratio increased regardless of the cooking method used. View evidence ↗
What it means
- The authors conclude that cooking reduces moisture, which increases the relative concentration of protein, fat, and ash, especially at higher temperatures. View evidence ↗
- The authors conclude that grilling is superior to boiling for the retention of B-complex vitamins in chicken breast meat. View evidence ↗
Visual summary
2 visualsIllustrations explain the paper; charts are replotted from the paper's own table values.
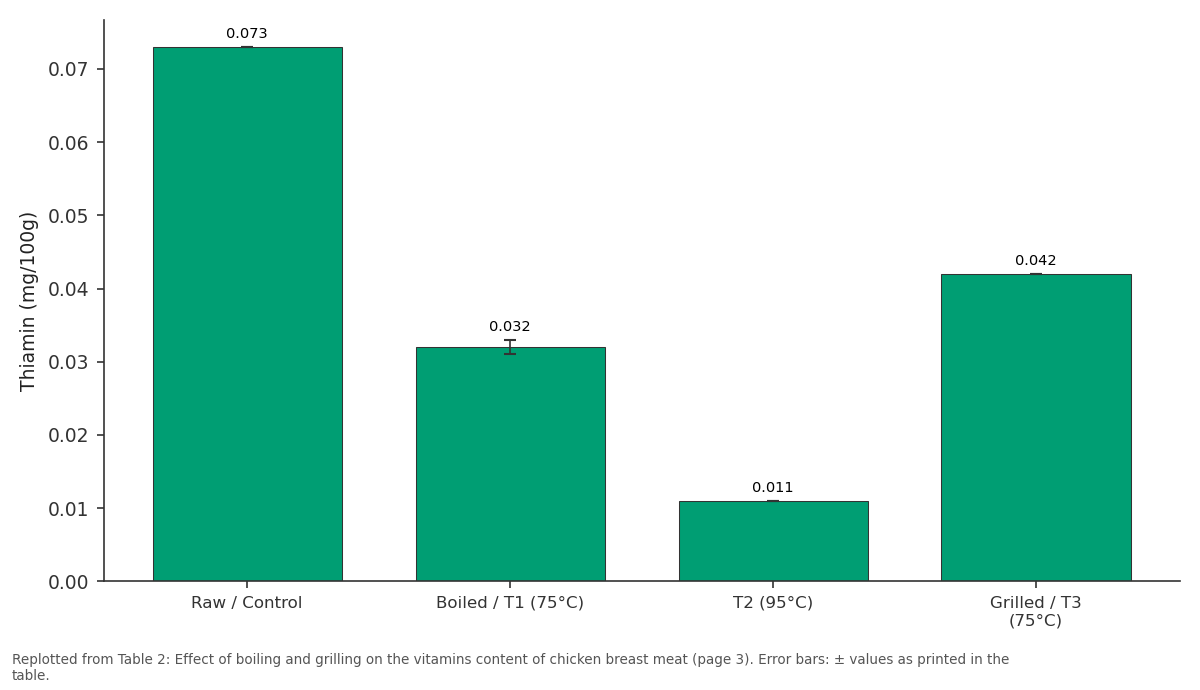
Thiamin (mg/100g): Raw / Control vs Boiled / T1 (75°C) vs T2 (95°C) vs Grilled / T3 (75°C)
Replotted from Table 2 (page 3) of the original paper. Every bar is the paper's own table value.
View source evidence ↗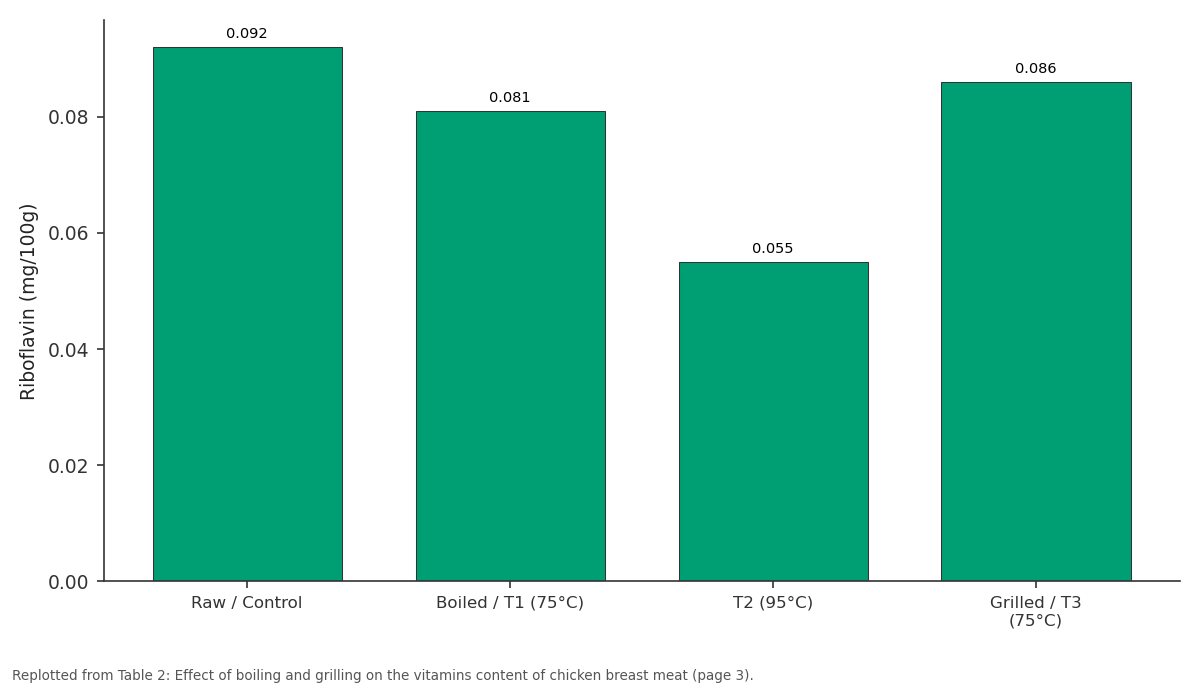
Riboflavin (mg/100g): Raw / Control vs Boiled / T1 (75°C) vs T2 (95°C) vs Grilled / T3 (75°C)
Replotted from Table 2 (page 3) of the original paper. Every bar is the paper's own table value.
View source evidence ↗Figures & tables
From the original paper Table 1
 Table 2
 Table 3
 Table 4
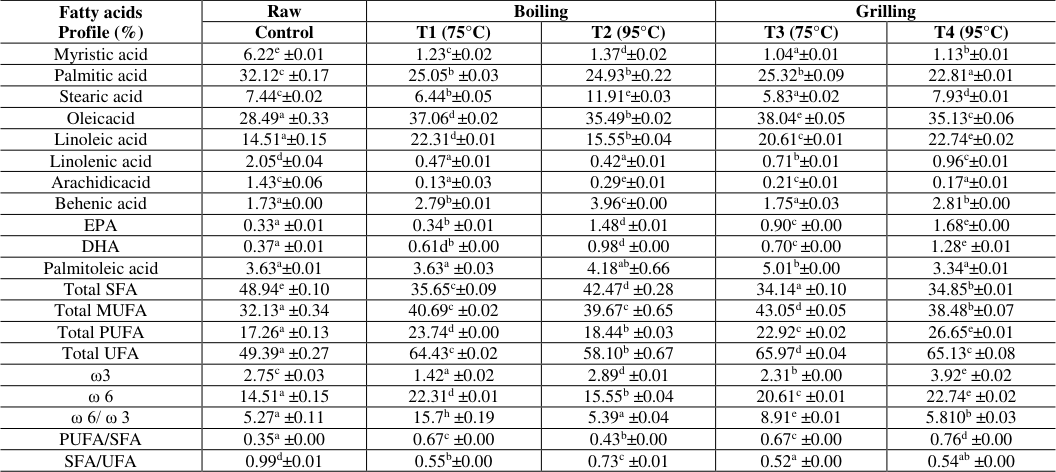 Table 5
Introduction
Meat is a form of food from animal flesh and is considered a protein-rich source with high biological value as well as micronutrients like iron, selenium, zinc and vitamin B12 is higher. Offal meats like liver are also crucial sources of vitamin A and folic acid (Biesalski, 2005) [9] . The settlements in the Neolithic Revolution allowed the domestication of chickens, sheep, rabbits, pigs, and cattle. It eventually led to their use in meat production on an industrial scale in slaughterhouses. During the prehistoric period, meat was consumed raw, but today it is usually consumed after it is cooked with delicate culinary techniques and skills. Meat proteins have been distinguished by their essential amino acid content. Consumption of highquality animal protein has been reported to be associated with better human nutrition, growth, development, and health (Wu, 2022) [58] . Cooking is a vital part of the processing and preparation of meat products and significantly affects the nutritional quality of cooked meat. Muthulakshmi et al. (2022) [37] reported that meat cooking at high-end point temperatures affects the meat quality by degradation of muscle proteins and changes in muscle structure. The degree of protein denaturation was dissimilar for each cooking method's temperature and the chicken meat parts, demonstrating a difference in protein and amino acid content. Moreover, cooking can have a major influence on meat fat and fatty acid composition. Heat treatment can lead to undesirable changes in the nutritional value of meat, mainly due to lipid oxidation, changes in the protein fraction, and losses of some vitamins and mineral compounds (Pathare and Roskilly, 2016) [43] . The unsaturated fatty acids are more heat-labile, and as the degree of unsaturation increases, they usually become less stable, making PUFA the most unstable (Larsen Lea et al., 2010) [29] . Boiling (meat without skin) caused a slight decrease, while grilling and oven convection roasting caused an increase of Ʃ MUFA compared to raw goose meat samples (Wereńska et al., 2021) [55] . The fatty acid compositions of the fractions differ greatly, with polyunsaturated fatty acids located predominately in the membrane fraction. Shehab (2016) [48] reported that the broiler chicken breast and thigh meat samples by pressure cooking retained the highest amount of total essential, non-essential and total amino acids when compared in decreasing order with boiling, microwave and roasting methods. These different distributions of fatty acids between storage and membrane fractions result in different responses to cooking (Duckett and Wagner, 1998) [16] . The grilling of broiler meat had a cooking loss of vitamin B1, B2, total vitamin B3, nicotinic acid, and nicotinamide in meat samples by 45, 38, 46, 70, and 45 per cent, respectively (Çatak and Reyhan., 2022) [13] . The vitamin B1, B2 and folic acid content of spent hen muscle cooked by moist heat cooking were 117.72, 6.94 and 38.75 mg/100 g, respectively. The reduction of vitamins with increasing cooking temperature could be attributed to thermal denaturation (Alugwu and Alugwu, 2022) [2] . Moist-heat cooking (employing water or steam) provides meats with a fresh, aromatic, light, delicate taste, unique texture and colour. Steaming is now considered a healthy, low fat option that amplifies the natural meat flavour of products. Consumers are now adopting grilling as a 'healthy' low-fat cooking option which allows excess fat to cook out of the product during heating. The rapid cooking technique is usually reserved for tender/ select meat cuts owing to the intensity of heat applied (Kerry, 2011) [26] . The nutrient content of cooked meat available in food composition databases is quite limited. The present study aimed to assess the effect of moist and dry cooking on chicken meat's composition, amino acid and fatty acid profile, vitamins and minerals content.
Materials and Methods
Materials and Methods
Preparation of samples
The broiler breast meat used in this study was obtained from the local market in the study area. The meat samples were trimmed off to separate the fat and loose connective tissue, then cut into 20 to 25 mm thick pieces. Further, these samples were divided into five groups according to the cooking methods and two internal core temperatures of each method and one group were kept without cooking as control. A total of 30 samples weighing approximately 200 g were cooked by boiling and grilling methods. Samples of meat were cooked to reach two internal core temperatures of 75°and 95°C in both cooking method. The meat sample was boiled in a stainless steel pot by heating above 100°C after adding water at a 1:5 ratio and the grilling was done at 150-160°C using an electrical griddle (Model Bajaj Majesty 1603 TSS 16 L Oven Toaster Griller, Bajaj Electrical Ltd.). The internal core temperature of the meat is monitored during cooking using a digital probe thermometer (Testo thermocouple, Mod. 735-1, Lenzkirch, Germany). After cooking and cooling, meat samples were vacuum-packed and stored at 20°C until laboratory analysis.
Composition of meat samples
The composition of raw and cooked meat samples was determined as per AOAC (1997) [3] . The crude protein content was determined by the Kjeldahl method and the crude fat content was determined by the Soxhlet method. The total ash content was determined by ashing the samples overnight at 550˚C. Moisture content was determined by drying the samples overnight at 105˚C.
Mineral content
The mineral content of raw and cooked meat samples was determined as per the method recommended by AOAC (2016) [4] . Calcium was estimated by the permanganimetric titration method. Phosphorus and copper were estimated by the spectrophotometric method using the wavelength of 660 nm and 440 nm. Iron was estimated by the pyridine method using the wavelength of 519 nm. Zinc and copper estimated by Atomic Absorption Spectrometry.
Vitamin content
The vitamin content of raw and cooked meat samples was determined as per the method recommended by AOAC (2019) [5] . Thiamine, riboflavin and niacin were separated and quantified by HPLC after acidic and enzymatic (Takadiastase) hydrolysis of the samples, following the procedure described by Barna and Dworschak (1994) [7] . The vitamin B12 content was measured by Mun et al. (2017) [35] . Analyses of vitamins were performed by HPLC, a detector operating at 200 nm to 600 nm. Chromatographic separation was achieved on a C18 column (250 cm x 5µm) (Simmetry Waters). The mobile phase was phosphate buffer: methanol (gradient). Flow rate: 1 mL/min. Identification of the peaks of interest was performed by comparison with retention times of external standards. Analyses were performed in triplicate.
Amino acid composition
The amino acid profile of raw and cooked meat samples was analysed in a private laboratory using the standard amino acids at different concentrations provided in the kit (Hewlett Packard). The analysis was done following the procedure of Bruckner et al. (1991) [11] in high-performance liquid chromatography and a chromatogram was obtained.
Fatty acid estimation
Lipid was extracted from the raw and cooked chicken meat samples as per the method followed by Folch et al. (1957) [19] . The fatty acid profile of chicken meat was analysed and measured by Gas Chromatography (Chemito GC 8610, India) fitted with an SP TM-2380 capillary GC Column (LX I.D 30 m x 0.25 mm, df 0.20 um film thickness) and a flame ionization detector. Fatty acid estimation was carried out following the procedure of Wang et al. (2000) [54] .
Statistical analysis
The result generated from this study were statistically analysed as per the procedure of Snedecor and Cochran (1994) and means were compared by using Dunkan's multiple range test (Dunkan, 1995) [17,50] .
Result and discussion
Result and discussion
Effect of boiling and grilling on the proximate composition of chicken breast meat
A high level of significance (P<0.01) was noticed in moisture, protein, fat, total ash content and energy value of control and cooked meat samples at two different internal core temperatures by both the cooking methods (Table 1). Decreased moisture content with a concomitant increase with other constituents of cooked meat samples of both cooking methods was noticed. The findings agreed with the reports of Nandini et al. (2017) [38] and Muthulakshmi et al. (2021) [36] , who reported that the reduced moisture content of pressure and sous vide cooked chicken meat samples compared with uncooked meat. Further increase in the internal core temperature of meat samples during the cooking of meat samples in both methods was inversely related to the moisture content. In grilled mutton chops, the moisture level was significantly reduced as the endpoint cooking temperature (51°C, 65°C, 71°C and 79°C) increased (Sen et al., 2014) and however, after attaining the endpoint temperature of 65°C, no significant change was observed in the moisture content of cooked mutton chops. However, the higher cooked internal temperature resulted in higher cooking losses because of the prolonged cooking time, causing extra moisture loss via evaporation and releasing excess juice inside the meat samples (Li et al. 2017 and Haghighi et al. 2021) [21] . As per the reports of Heymann et al. (1990) [22] and Cobos et al. (2000) [14] , the cooking process caused an increase in the dry matter of the meat because of the reduction in the water content and the same situation was observed in all kinds of meat samples. Breast meat cooked by boiling, grilling, pan frying without fat or oil, pan frying with oil, deep-fat frying, oven and microwave showed a very significant (P<0.01) increase in the protein content as reported by Oz and Celik (2015) [42] . Further, the similar increase in protein content of grilled, roasted, fried and sous-vide cooked, pressure cooked, sous-vide cooked samples were also reported by Silva et al. ( 2016) [49] , Nandini et al. (2017) [38] and Muthulakshmi et al. (2021) [36] respectively. The higher protein content of grilled meat cooked at higher temperatures might be due to higher moisture loss. A significant difference (P<0.01) in fat content between raw and cooked samples has been reported in this study. There was a higher fat content in cooked meat samples reported by Verma (2012) [53] , Asmaa et al. (2015), Nandini et al. (2017) [38] , and Muthulakshmi et al. (2021) [6,36] . The elevated fat content of the grilled meat sample might be due to higher moisture loss during the cooking process and the present results agree with Hussain et al.( 2013), Nandini et al. (2017) [38] , according to Muthulakshmi et al. (2021) [36] , who reported a higher ash content in grilled, boiled, fried, microwave cooked, pressure cooked and sous-vide cooked chicken meat samples. Verma (2012) [53] also reported no notable change in the ash content of broiler meat samples cooked by different methods. The sous-vide cooked desalted chicken charqui showed a significantly lower ash content (Silva et al., 2016) [49] .
| Composition (n =6) | Raw | Boiling | — | Grilling | — |
|---|---|---|---|---|---|
| Control | T1 (75°C) | T2 (95°C) | T3 (75°C) | T4 (95°C) | |
| Moisture (per cent | 74.17e±0.04 | 67.74c±0.02 | 65.55b±0.17 | 68.61d±0.05 | 52.44a±0.03 |
| Protein (per cent) | 23.84a±0.02 | 31.96c±0.03 | 32.76d±0.14 | 27.89b±0.04 | 43.57e±0.02 |
| Ether extract (per cent) | 0.66a±0.00 | 0.97b±0.00 | 1.25d±0.00 | 0.81c±0.01 | 2.45e±0.01 |
| Total ash (per cent) | 1.00a±0.00 | 1.24b±0.01 | 1.75d±0.01 | 1.35c±0.01 | 2.08d±0.01 |
Table text extracted from the original PDF; superscript letters are shown inline. The original table image is below.
View original table image
Effect of boiling and grilling on the vitamins content of chicken breast meat
A significant difference (P<0.01) in thiamin, riboflavin, niacin and cyanocobalamin content of control and cooked chicken (Table 2). Further, a decreasing trend in the various vitamin content is exerted due to the cooking process (Boiled and Grilled). The higher internal core temperature significantly reduced cooked chicken meat's thiamin, riboflavin, niacin, and cyanocobalamin content. The grilled chicken meat had a higher thiamin, riboflavin, niacin and cyanocobalamin content than boiled chicken meat. [60] , who reported beef strips cooked by three methods to the same internal temperature of 71°C (160°F), the mean thiamin contents were 70.2% for stirfrying, 63.9% for microwaving, and 61.8% for broiling. The true retention value of thiamin was significantly higher in strips cooked by stir-frying than in those cooked by microwaving or broiling. Polidori et al. (2021) [44] reported that the cooking procedure decreased the vitamin B complex content, mainly thiamin by thermal degradation, becoming hard to detect in the cooked meat when analyzed. The reduction of riboflavin content of cooked meat in the current study agrees with the findings of Gerber et al. (2009) [20] , who reported that riboflavin losses in grilling, boiling and braising were 48.60 to 53.40, 83.40 and 67.60 per cent, respectively. Lombradi-Boccia et al. (2005) found that the raw and pan-cooked chicken breast samples' riboflavin content was 0.03 and 0.01, respectively. However, Polidori et al. (2021) [44] reported the riboflavin content of raw and cooked (Cooked in an oven at 170°C for 45 min) donkey meat as 0.22±0.07 and 0.18±0.05, respectively. The reduction of niacin content of cooked meat in the present study is in accordance with the results of Gerber et al. (2009) [20] , who reported that niacin losses in grilling, boiling and braising were 39.5 to 53.4, 65.2 and 64.0 per cent, respectively. As per the report of Lombradi-Boccia et al. (2005), the niacin content in the raw and pan-cooked chicken breast was 0.03 and 0.01, respectively. Further, Karimian-Khosroshahi et al. (2016) [25] reported the niacin content of raw and cooked rainbow trout samples were 6.21, 5.36, 4.48, 5.37, and 5.41 mg /100g for control, baked, boiled, microwaved and fried samples and opined that the boiling process reduced the niacin content significantly (P<0.05). Polidori et al. (2021) [44] reported that raw and cooked donkey meat's niacin content was 6.09 and 5.22 mg /100g. The cyanocobalamin content of the current study results agrees with the report of Bennink and Ono (1982) [8] , who reported that the vitamin B-12 content of raw and cooked separable lean meat ranged from 1 -10 μg/100g. Czerwonka et al. (2014) [15] observed that roasting and grilling had little effect on vitamin B12 while frying reduced the content of this vitamin by 32 per cent when compared with raw meat. However, Polidori et al. (2021) [44] reported that the cyanocobalamin content of raw and cooked donkey meat was 1.80 and 1.10 mg /100g.
| Vitamin content (n =6) | Raw | Boiled | — | Grilled | — |
|---|---|---|---|---|---|
| Control | T1 (75°C) | T2 (95°C) | T3 (75°C) | T4 (95°C) | |
| Thiamin (mg/100g) | 0.073±0.00 | 0.032±0.001 | 0.011±0.00 | 0.042±0.00 | 0.020±0.00 |
| Riboflavin (mg/100g) | 0.092±0.00 | 0.081±0.00 | 0.055±0.00 | 0.086±0.00 | 0.079±0.00 |
| Niacin (mg/100g) | 7.23±0.021 | 4.933±0.021 | 4.267±0.042 | 5.533±0.021 | 5.267±0.076 |
| Cyanocobalamin (μg/100 g) | 1.233±0.021 | 0.637±0.002 | 0.397±0.002 | 0.93±0.004 | 0.673±0.002 |
Table text extracted from the original PDF; superscript letters are shown inline. The original table image is below.
View original table image
Effect of boiling and grilling on the minerals content of chicken breast meat
A significant difference (P<0.01) in the various minerals viz., calcium, phosphorus, iron, zinc and copper content of control and cooked chicken (Table 3). The grilled chicken meat had higher calcium, phosphorus, iron, zinc and copper content when compared to boiled meat. It is evident that an increasing trend in mineral content was noticed as a result of the cooking process and this might be due to the cooking loss of meat during heat treatment. [45] , who reported increased calcium in cooked meat compared to raw meat. Kim et al. (2015) [27] studied the calcium content in the blanched beef by immersion in boiling water (1-10 min), steaming (1-10 min), or pan-frying in oil (30-240 s) and observed that calcium content was high in the pan-fried samples, but the boiled and steamed samples had the same content. The phosphorus content of the results of the samples are in agreement with Tomovic et al. (2015) [51] , who studied the effects of endpoint temperatures of 51, 61, 71, 81 and 91°C on the mineral content of pork loin and all cooking treatments led to significantly increased mineral content. As the endpoint temperature increased, the mineral content also increased and reached numerically or significantly the highest contents at 71°C for phosphorus, after which mineral contents decreased in pork loin. In contrast to this study, grilling and boiling pork and beef decreased the contents of phosphorus content in cooked meat (Gerber et al., 2009) [20] when compared to raw meat. The iron content of the samples are in agreement with Gerber et al. (2009) [20] , who reported that iron content increased in grilled, boiled, pan-fried and then steamed meat samples. Purchas et al. (2014) [45] found an increased iron content in cooked meat than in uncooked lean beef. Kim et al. (2015) [27] reported that the highest iron content was observed in boiled beef samples, followed by pan-fried samples.
| Minerals (n =6) | Raw | Boiling | — | Grilling | — |
|---|---|---|---|---|---|
| Control | T1 (75°C) | T2 (95°C) | T3 (75°C) | T4 (95°C) | |
| Calcium (per cent) | 0.10a±0.00 | 0.13b±0.01 | 0.24d±0.00 | 0.16c±0.01 | 0.33e±0.00 |
| Phosphorus (per cent) | 0.20a±0.00 | 0.22a±0.02 | 0.28b±0.00 | 0.29b±0.01 | 0.35c±0.01 |
| Iron (ppm) | 161.67a±0.56 | 207.00b±0.37 | 215.73c±0.15 | 224.07d±0.1 | 233.83e±0.20 |
| Zinc (mg/kg) | 2.90a±0.01 | 3.93b±0.01 | 4.04d±0.00 | 3.57c±0.01 | 5.16e±0.01 |
| Copper (ppm) | 5.93a±0.01 | 7.90b±0.01 | 15.48d±0.0 | 9.63c±0.02 | 22.14e±0.03 |
Table text extracted from the original PDF; superscript letters are shown inline. The original table image is below.
View original table image
The zinc content of the meat samples corresponds with the report of Gerber et al. (2009) [20] , who reported a significant increase in zinc due to the cooking of beef cut. Purchase et al. (2014) [45] recorded an increased zinc level in cooked meat compared to raw meat. Reports indicated that the minerals are very stable during the cooking process, whereas others have noticed rising mineral concentrations after cooking because of increased dry matter (Campo et al., 2013) [12] . The current study copper content agrees with Purchas et al. (2014) [45] , who reported an increased copper in cooked meat compared to raw meat. Uran and Gokoglu (2014) [52] reported that the lowest concentration of copper was found in fried samples and the highest in grilled samples. Additionally, the retention of minerals in sous-vide cooking (Falowo et al., 2017; Silva et al., 2016) [18,49] was similar to raw meat and higher than boiled samples.
Effect of boiling and grilling on the amino acid profile of chicken breast meat:
The results of the amino acid content of broiler breast meat samples cooked by grilling and boiling with two different internal core temperatures are presented in Table 4. The boiled meat had a higher content of histidine, isoleucine, leucine, lysine, methionine, phenylalanine, threonine, and valine when compared to grilled meat. In general, most of the amino acids increased significantly (P<0.01) after cooking except arginine, alanine and methionine. Also, higher internal core temperatures in both cooking methods significantly reduced the amino acid content. Superscripts within classes do not differ significantly (p>0.05). n =6 for each treatment.
| Amino acid profile (n =6) | Raw | Boiling | — | Grilling | — |
|---|---|---|---|---|---|
| Control | T1 (75°C) | T2 (95°C) | T3 (75°C) | T4 (95°C) | |
| Arginine | 6.78c ±0.17 | 2.44a ±0.03 | 2.36a ±0.03 | 5.06b±0.04 | 4.89b± 0.00 |
| Histidine | 9.77a ±0.16 | 13.15c±0.03 | 12.59b ±0.26 | 9.92a ±0.05 | 9.87a± 0.10 |
| Isoleucine | 13.58a ±0.09 | 18.82c ±0.03 | 18.01c±0.59 | 14.95b ±0.02 | 14.48b ±0.01 |
| Leucine | 20.79a ±0.22 | 28.24d ±0.04 | 27.45c ±0.07 | 22.56b ±0.04 | 22.33b ±0.04 |
Table text extracted from the original PDF; superscript letters are shown inline. The original table image is below.
View original table image
The loss of moisture in the cooked meat enhanced the contents of other nutritive components (Lopes et al., 2015). Also, Kim et al. (2017) [28,31] reported that the arginine, histidine, methionine and valine in chicken breast meat showed differences by cooking methods and the amount increased after cooking and opined that the amino acid content increased due to reducing water retention capacity to thermal denaturation of the protein. The degree of protein denaturation was different for each cooking method, temperature and chicken part, demonstrating a difference in protein as well as amino acid content. The lysine was lost due to the formation of Maillard reaction products by heating, while threonine was converted to other compounds, as reported by Oduro et al. (2011) [39] . Further, Lea et al.
(1960) [30] reported that the lysine was lost by auto-oxidation of fat at temperatures below 100°C, while at high temperatures (i.e. 115-130°C), the loss was apparently independent of the presence of fat.
According to Macy et al. (1964) [34] , most free amino acids increased in concentration during roasting at an internal temperature of 77°C except for threonine, serine, glutamic acids, histidine, arginine and the increase in amino acids content was due to hydrolysis of protein by photolytic enzymes. The reduction of total essential amino acid values was more pronounced in the fried samples as compared to the boiled and roasted samples (Oluwaniyi et al., 2010) [40] . Histidine and taurine, in particular, have been found to show low retention rates of 69.8 and 52.4% when cooked at 75°C (Wilkinson et al., 2014) [56] . Veal showed a high retention rate of over 100% for all amino acids while cooked by microwaving, boiling, and grilling and the cooking method only showed a difference in the leucine rate (Lopes et al., 2015) [31] .
Shehab (2016) [48] reported a noticeable amount of sulfurcontaining amino acids such as leucine, tyrosine, phenylalanine and lysine (as essential amino acids), as well as serine, glycine, alanine, histidine and arginine (as nonessential amino acids), were destroyed, while as the slight decrease was noticed in all the other amino acid contents under cooking of chicken breast or thigh meat samples by microwave cooking, boiling, pressure and roasting. Muthulakshmi et al. (2021) [36] found an increase in essential amino acid content in pressure cooked meat when compared to sous-vide cooked meat at 75 °C. Moreover, Oshibanjo et al. (2019) [41] reported that the breakfast sausage grilled at 80°C had the highest essential amino acid scores than those grilled at 90°C and 100°C.
Effect of boiling and grilling on the fatty acids profile of chicken breast meat
The results of the fatty acids profile of broiler breast meat samples cooked using various methods, with various internal core temperatures, are presented in Table 5 and a significant difference (P<0.01) was observed among samples. The most abundant fatty acids found in raw meat samples were palmitic acid (32.12 per cent), oleic acid (28.49 per cent), linoleic acid (14.51 per cent), stearic acid (7.44 per cent), and myristic acid (6.22 per cent). The myristic acid, palmitic acid, stearic acid, linolenic acid and arachidic acid showed a decreasing trend irrespective of cooking method and temperature of cooking. The oleic acid, linoleic acid, behenic acid, eicosapentaenoic acid (EPA) and docosahexaenoic acid (DHA) showed an increasing trend in irrespective of cooking method and cooking temperatures. With regard to the total SFAs, a significant (P<0.01) decrease was found irrespective of cooking methods and cooking temperature when compared to the raw meat and remarkable decreases were noticed in the grilled meat when compared to the boiled meat. Upon comparison of cooking methods, significant decreases were noticed in the grilled meat sample compared to the boiled meat sample. Also, increasing internal core temperature significantly increased total SFAs. Bosco et al. (2001) [10] reported no differences in the total SFA percentage in raw and cooked (boiled, fried, roasted) rabbit meat. Current results agree with Gerber et al.
| Fatty acids Profile (%) | Raw | Boiling | — | Grilling | — |
|---|---|---|---|---|---|
| Control | T1 (75°C) | T2 (95°C) | T3 (75°C) | T4 (95°C) | |
| Myristic acid | 6.22e ±0.01 | 1.23c±0.02 | 1.37d±0.02 | 1.04a±0.01 | 1.13b±0.01 |
| Palmitic acid | 32.12c ±0.17 | 25.05b ±0.03 | 24.93b±0.22 | 25.32b±0.09 | 22.81a±0.01 |
| Stearic acid | 7.44c±0.02 | 6.44b±0.05 | 11.91e±0.03 | 5.83a±0.02 | 7.93d±0.01 |
| Oleicacid | 28.49a ±0.33 | 37.06d ±0.02 | 35.49b±0.02 | 38.04e ±0.05 | 35.13c±0.06 |
| Linoleic acid | 14.51a±0.15 | 22.31d±0.01 | 15.55b±0.04 | 20.61c±0.01 | 22.74e±0.02 |
| Linolenic acid | 2.05d±0.04 | 0.47a±0.01 | 0.42a±0.01 | 0.71b±0.01 | 0.96c±0.01 |
| Arachidicacid | 1.43c±0.06 | 0.13a±0.03 | 0.29e±0.01 | 0.21c±0.01 | 0.17a±0.01 |
| Behenic acid | 1.73a±0.00 | 2.79b±0.01 | 3.96c±0.00 | 1.75a±0.03 | 2.81b±0.00 |
| EPA | 0.33a ±0.01 | 0.34b ±0.01 | 1.48d ±0.01 | 0.90c ±0.00 | 1.68e±0.00 |
| DHA | 0.37a ±0.01 | 0.61db ±0.00 | 0.98d ±0.00 | 0.70c ±0.00 | 1.28e ±0.01 |
| Palmitoleic acid | 3.63a±0.01 | 3.63a ±0.03 | 4.18ab±0.66 | 5.01b±0.00 | 3.34a±0.01 |
| Total SFA | 48.94e ±0.10 | 35.65c±0.09 | 42.47d ±0.28 | 34.14a ±0.10 | 34.85b±0.01 |
| Total MUFA | 32.13a ±0.34 | 40.69c ±0.02 | 39.67c ±0.65 | 43.05d ±0.05 | 38.48b±0.07 |
| Total PUFA | 17.26a ±0.13 | 23.74d ±0.00 | 18.44b ±0.03 | 22.92c ±0.02 | 26.65e±0.01 |
| Total UFA | 49.39a ±0.27 | 64.43c ±0.02 | 58.10b ±0.67 | 65.97d ±0.04 | 65.13c ±0.08 |
| ω3 | 2.75c ±0.03 | 1.42a ±0.02 | 2.89d ±0.01 | 2.31b ±0.00 | 3.92e ±0.02 |
| ω 6 | 14.51a ±0.15 | 22.31d ±0.01 | 15.55b ±0.04 | 20.61c ±0.01 | 22.74e ±0.02 |
| ω 6/ ω 3 | 5.27a ±0.11 | 15.7h ±0.19 | 5.39a ±0.04 | 8.91e ±0.01 | 5.810b ±0.03 |
| PUFA/SFA | 0.35a ±0.00 | 0.67c ±0.00 | 0.43b±0.00 | 0.67c ±0.00 | 0.76d ±0.00 |
| SFA/UFA | 0.99d±0.01 | 0.55b±0.00 | 0.73c ±0.01 | 0.52a ±0.00 | 0.54ab ±0.00 |
Table text extracted from the original PDF; superscript letters are shown inline. The original table image is below.
View original table image
(2009) [20] , who reported that the adipose tissue contains a higher proportion of SFA than PUFA and the decrease in SFA results from lipid losses during cooking. The total SFA content of the breast meat decreased with boiled, pan fried with oil and deep-fat fried, while other cooking methods (grill, oven and microwave) caused an increase in the total SFA content of the breast meat (Oz and Celik, 2015) [42] . Further, Muthulakshmi et al. (2021) [36] also reported an increase in the total SFA content of sous-vide and pressure cooked chicken meat. In contrast, Xiong et al. (2020) [59] found that the fatty acids content in chicken meat after heating to different temperatures (50°,60°, 70°, 80°, 90°, and 100° C), the saturated fatty acids were increased. The total MUFAs, significant increases were found in the cooked chicken meat samples when compared to the control meat. The cooking process caused an increase in total MUFA, although between cooking methods and internal core temperature showed a significant difference (P<0.01).
Oz and Celik (2015) [42] reported that total SFA content of goose leg meat decreased with cooking while total MUFA content increased. There was an increase in the total MUFA content of sous vide and pressure cooked chicken meat samples reported by Muthulakshmi et al. (2021) [36] . Werenska et al. (2021) reported that boiling (goose meat without skin) and pan-frying (with skin and without skin) caused a slight decrease, while grilling and oven convection roasting (with skin and without skin) caused an increase of total MUFA compared to raw samples. The total PUFAs content showed a significant (P<0.01) increase irrespective of cooking methods and cooking temperatures when compared to the control. However, in cooking methods, the grilled meat samples had a significantly higher value (22.92 and 26.65%) than boiled meat samples (23.74 and 18.44%). Igene and Pearson (1979) [23] reported that cooking caused a decrease in total SFA content in beef and chicken, while total MUFA and PUFA contents of the samples increased with cooking. Scheeder et al. (2001) [46] observed that cooking meatballs decreased the total SFA content and increased the total MUFA and PUFA contents. PUFA, being part of cell membrane structure (phospholipids) might remain bound to the membrane (Gerber et al., 2009) [20] and therefore, its relative proportion increased in the meat. There was an increase in the total PUFA content of sous-vide and pressure cooked chicken meat samples observed by Muthulakshmi et al. (2021). Alfaia et al. (2010) [1,36] cooked beef had lower concentrations of total PUFA (5.8% microwaved, 5.9%-boiled, 7.1%-grilled meat) than raw meat due to a significant loss of some n-6 and n-3 PUFA. In the present study, the results exhibit that the boiled meat with higher cooking temperature reduced total PUFA content and agreed with Xiong et al., (2020) [59] , who reported that PUFA decreased significantly (P<0.05) with the elevation of heating temperature. The grilled chicken meat was the lowest and pan frying had the highest total PUFA content after heat treatment (Werenska et al., 2021).
The PUFA/SFA ratio increased with both cooking methods and internal core temperature. The recommended ratio of polyunsaturated fatty acids (PUFAs) to SFAs (P/S) should be above 0.4, with the normal P/S ratio of meat at around 0.1 (Wood et al., 2003) [57] . Heat treatment caused an increase in the PUFA n-6/n-3 ratio. [24,36] .
Conclusion
Chicken meat is an important component of a healthy and well balanced diet. Various cooking methods greatly impact the nutritional quality of meat and meat products. The study revealed a decrease in moisture content with a concomitant increase in the other constituents of cooked meat samples of both cooking methods. The increased cooking temperature significantly (P<0.05) increased the protein, fat and ash content. The grilled meat retained higher vitamins such as thiamin, riboflavin, niacin and cyanocobalamin compared to boiled chicken breast meat. Cooking processes significantly increased the calcium, phosphorus, iron, zinc and copper content of grilled meat compared to boiled meat. In cooked meat, vitamin content was inversely proportional to internal core temperature and mineral content was directly proportional to cooking temperature. The essential amino acid (EAA) content of chicken breast meat cooked in both methods was significantly higher (P<0.05) when compared to the raw meat and also, the increasing the internal core temperature significantly (P<0.05) reduced EAA content.
The fatty acid profile of cooked chicken meat showed decreasing trends of total SFA content and increasing trends of total PUFA and total MUFA content compared to raw meat. Total SFA reduction was higher in grilled meat compared to boiled meat.
Chicken meat cooked at higher internal core temperatures showed significantly (P<0.01) higher total SFA content. Further, the total MUFA content was higher in grilled meat and the total PUFA content was higher in boiled meat at 75°C internal core temperature. The PUFA/SFA ratio increased irrespective of cooking methods and cooking temperature as compared to the control. Similarly, an increasing trend of PUFA n-6/n-3 ratio has been noticed in the cooked meat samples irrespective of cooking temperature and cooking methods.
Acknowledgement
AcknowledgementThe authors are highly grateful to Tamil Nadu Veterinary and Animal Sciences University, Chennai for the necessary facilities provided to carry out the research work.
References
60 in the original paper- Alfaia CM, Alves SP, Lopes AF, Fernandes MJ, Costa AS, Fontes CM, et al. Effect of household cooking methods on fatty acids conjugated isomers of linoleic International Journal of Agriculture and Food Science https://www.agriculturaljournals.com acid and nutritional quality of beef intramuscular fat. Meat Sci. 2010;84:769-777.
- Alugwu UB, Alugwu SU. Effect of roasting, steaming and internal temperatures on proximate composition, vitamins and sensory properties of spent hen muscle. Asian J Adv Res Rep. 2022;81-89.
- AOAC. Official methods of analysis. 16th ed. 3rd rev. Vol.1. Washington (DC): Association of Official Analytical Chemists; 1997.
- AOAC. Official methods of analysis. 20th ed. 3rd rev. Vol.1. Washington (DC): Association of Official Analytical Chemists; 2016.
- AOAC. Official methods of analysis. 21st ed. Washington (DC): Association of Official Analytical Chemists; 2019.
- Asmaa AA, Zzaman W, Tajul AY. Effect of superheated steam cooking on fat and fatty acid composition of chicken sausage. Int Food Res J. 2015;22:598-605.
- Barna E, Dworschak E. Determination of thiamine (vitamin B1) and riboflavin (vitamin B2) in meat and liver by high-performance liquid chromatography. J Chromatogr. 1994;668:359-363.
- Bennink M, Ono K. Vitamin B12, E and D content of raw and cooked beef. J Food Sci. 2006;47:1786-1792.
- Biesalski HK. Meat as a component of a healthy dietare there any risks or benefits if meat is avoided in the diet? Meat Sci. 2005;70(3):509-524.
- Bosco A, Castellini C, Bernardini M. Nutritional quality of rabbit meat as affected by cooking procedure and dietary vitamin E. J Food Sci. 2001;66:1047-1051.
- Bruckner H, Winter R, Godel H. Fully automated HPLC separation of DL amino acids derivatized with OPA together with N-isobutryl-cystine-applications to food samples. Chromatographia. 1991;32:383-388.
- Campo M, Muela E, Olleta JL, Moreno LA, Santaliestra-Pasias AM, Mesana ML, et al. Influence of cooking method on the nutrient composition of Spanish light lamb. J Food Compos Anal. 2013;31:185-190.
- Çatak J, Çaman R. Effect of baking and grilling on B vitamins of selected fishes and chicken parts. J Culin Sci Technol. 2022;20:1-16.
- Cobos A, Veiga A, Diaz O. Chemical and fatty acid composition of meat and liver of wild ducks (Anas platyrhynchos). Food Chem. 2000;68:77-79.
- Czerwonka M, Szterk A, Waszkiewicz-Robak B. Vitamin B12 content in raw and cooked beef. Meat Sci. 2014;96:1371-5.
- Duckett SK, Wagner DG. Effect of cooking on the fatty acid composition of beef intramuscular lipid. J Food Compos Anal. 1998;11:357-362.
- Dunkan JD. Multiple range and multiple F test. Biometrics. 1995;1:1-8.
- Falowo AB, Muchenje V, Hugo A. Effect of sous-vide technique on fatty acid and mineral compositions of beef and liver from Bonsmara and non-descript cattle. Ann Anim Sci. 2017;17. doi:10.1515/aoas-2016-0078
- Folch J, Lees M, Sloane Stanley GH. A simple method for the isolation and purification of total lipids from animal tissues. J Biol Chem. 1957;226:497-509.
- Gerber N, Scheeder MRL, Wenk C. The influence of cooking and fat trimming on the actual nutrient intake from meat. Meat Sci. 2009;81(1):148-154.
- Haghighi H, Belmonte AM, Masino F, Minelli G, Lo Fiego DP, Pulvirenti A. Effect of time and temperature on physicochemical and microbiological properties of sous vide chicken breast fillets. Appl Sci. 2021;11:3189.
- Heymann H, Hedrick HB, Karrasch MA, Eggeman MK, Ellersieck MR. Sensory and chemical characteristics of fresh pork roasts cooked to different endpoint temperatures. J Food Sci. 1990;55(3):613-617.
- Igene JO, Pearson AM. Role of phospholipids and triglycerides in warmed-over flavor development in meat model systems. J Food Sci. 1979;44:1285-1290.
- Juarez M, Dugan MER, Aldai N, Aalhus JL, Parience JF, Zijlstra RT, et al. Feeding co-extruded flaxseed to pigs: Effects on growth performance and backfat fatty acid composition. Meat Sci. 2010;84:578-584.
- Karimian-Khosroshahi N, Hosseini H, Rezaei M, Khaksar R, Mahmoudzadeh M. Effect of different cooking methods on minerals, vitamins, and nutritional quality indices of rainbow trout (Oncorhynchus mykiss). Int J Food Prop. 2016;19:2471-2480.
- Kerry JF. Effects of novel thermal processing technologies on the sensory quality of meat and meat products. In: Processed Meats. Woodhead Publishing; 2011. p. 617-665.
- Kim KI, Lee SY, Hwang IG, Yoo SM, Min SG, Choi MJ. Quality characteristics of beef by different cooking methods for frozen home meal replacements. Korean J Food Sci Anim Resour. 2015;35:441-448.
- Kim H, Do HW, Chung H. A comparison of the essential amino acid content and the retention rate by chicken part according to different cooking methods. Korean J Food Sci Anim Resour. 2017;37:626-634.
- Larsen D, Quek SY, Eyres L. Effect of cooking method on the fatty acid profile of New Zealand King Salmon. Food Chem. 2010;119:785-790.
- Lea CH, Parr LJ, Carpenter RJ. Chemical and nutritional changes in stored herring meal. Br J Nutr. 1960;4:91-113.
- Li KW, McKeith AG, Shen CS, McKeit R. A comparison study of quality attributes of ground beef and veal patties and thermal inactivation of Escherichia coli O157:H7 after double pan-broiling. Foods. 2018;7(1).
- Lombardi-Boccia G, Lanzi S, Aguzzi A. Aspects of meat quality: trace elements and B vitamins in raw and cooked meats. J Food Compos Anal. 2005;18(1):39-46.
- Lopes AF, Alfaia CM, Partidario AM, Lemos JP, Prates JA. Influence of household cooking methods on amino acids and minerals of Barrosã-PDO veal. Meat Sci. 2015;99:38-43.
- Macy RL Jr, Naurman HD, Bailey MF. Soluble flavor odor precursors of meat: qualitative study. J Food Sci. 1964;29:136-148.
- Mun G, Song W, Park S, Jeong B, Jung G, Choi K, et al. Analysis of Vitamin B12 in fresh cuts of Korean pork. Korean J Food Preserv. 2017;24:983-991.
- Muthulakshmi M, Chandirasekaran V, Kalaikannan A, Jagadeeswaran A, Selvaraju G, Muthukumar M, et al. Effect of cooking methods on nutritional quality of chicken meat. Pharma Innov J. 2021;10(11S):10641072.
- Muthulakshmi M, Chandirasekaran V, Kalaikannan A, Jagadeeswaran A, Selvaraju G, Muthukumar M, et al. International Journal of Agriculture and Food Science https://www.agriculturaljournals.com Influence of heat on protein degradation, histology and eating quality indicators of chicken meat. Int J Bioresour Stress Manag. 2022;13(3):205-212.
- Nandini Devi T, Ramani R, Narendra Babu R, Appa Rao V, Ramesh J, Abraham RJJ. Effect of cooking on cholesterol and proximate composition on breast and thigh muscles of chicken and quail meat. Int J Curr Microbiol Appl Sci. 2017;6:3700-3703.
- Oduro FA, Choi ND, Ryu HS. Effects of cooking conditions on the protein quality of chub mackerel. Fish Aquat Sci. 2011;14:257-265.
- Oluwaniyi OO, Dosumu OO, Awolola GV. Effect of local four marine fishes commonly consumed in Nigeria. Food Chem. 2010;123:1000-1006.
- Oshibanjo O, Olusola O, Ogunwole O. Influence of cooking methods and temperature on essential amino acid score of breakfast sausage. Meat Muscle Biol. 2018;1(2).
- Oz F, Celik T. Proximate composition, color and nutritional profile of raw and cooked goose meat. J Food Process Preserv. 2015;39:2442-2450.
- Pathare PB, Roskilly AP. Quality and energy valuation in meat cooking. Food Eng Rev. 2016;8:435-447.
- Polidori P, Girolami PD, Vincenzetti S. Vitamins and minerals in raw and cooked donkey meat [Internet]. 2021 [cited 2025 Jul 29]. Available from: https://www.intechopen.com/chapters/75724
- Purchas R, Wilkinson B, Carruthers F, Jackson F. A comparison of the nutrient content of uncooked and cooked lean from New Zealand beef and lamb. J Food Compos Anal. 2014;35:75-82.
- Scheeder MRL, Casutt MM, Roulin M, Escher F, Dufey PA, Kreuzer M. Fatty acid composition, cooking loss and texture of beef patties from meat of bulls fed different fats. Meat Sci. 2001;58:321-328.
- Sen AR, Naveena BM, Muthukumar M, Vaithiyanathan S. Colour, myoglobin denaturation and storage stability of raw and cooked mutton chops. J Food Sci Technol. 2014;51:970-975.
- Shehab T. Effect of cooking methods on amino acids composition of chicken meat. Theory Pract Meat Process. 2016;1:11-18.
- Silva FAP, Ferreira VC, Madruga MS, Estevez M. Effect of the cooking method on oxidation of thiols and protein cross-linking in jerky chicken. J Food Sci Technol. 2016;53:3137-3146.
- Snedecor GW, Cochran WG. Statistical Methods. 8th ed. Ames (IA): Iowa State University Press; 1994.
- Tomovic V, Jokanovic M, Sojic B, Snezana S, Tasic T, Ikonic P. Minerals in pork meat and edible offal. Procedia Food Sci. 2015;5:293-295.
- Uran H, Gokoglu N. Effects of cooking methods on nutritional characteristics of anchovy. J Food Sci Technol. 2014;51:722-728.
- Verma A. Effect of different cooking methods on quality of broiler chicken meat chat. Haryana Vet. 2012;51:38-40.
- Wang M, Xu YN, Jiang GZ, Li LB, Kuang TY. Membrane lipids and their fatty acid composition in Nostoc flagelliforme cells. Acta Bot Sin. 2000;42:12631266.
- Wereńska M, Haraf G, Wołoszyn J, Goluch Z, Okruszek A, Teleszko M. Fatty acid profile and health lipid indices of goose meat. Poult Sci. 2021;100(8):101237.
- Wilkinson BHP, Lee E, Purchas RW, Morel PCH. Retention and recovery of amino acids from pork longissimus muscle following cooking. Meat Sci. 2014;96:361-365.
- Wood JD, Richardson RI, Nute GR, Fisher AV, Campo MM, Kasapidou E, et al. Effects of fatty acids on meat quality: a review. Meat Sci. 2003;66:21-32.
- Wu ZJ, Li XH, Liu ZW, Li H, Wang YX, Zhuang J. Transcriptome-wide identification of Camellia sinensis WRKY transcription factors. Mol Genet Genomics. 2016;291:255-269.
- Xiong Q, Zhang M, Wang T, Wang D, Sun C, Bian H, et al. Lipid oxidation induced by heating in chicken meat. Poult Sci. 2020;99(3):1761-1767.
- Yang J, Sulaeman A, Setiawan B, Atughonu A, Giraud DW, Driskell JA. Sensory qualities and nutrient retention of beef strips by cooking technique. J Am Diet Assoc. 1994;94:2-5.
Cited by 1
From OpenAlex, OpenCitations and reference lists read by Scinovex
- Study on the effect of pre-treatment on the colour and proximate composition of freeze-dried chicken breast meat chunks
Nalini P, V. Chandirasekaran, Rajkumar R, Krishnakumar S, Arthanarieswaran M, M Muthulakshmi · International Journal of Veterinary Sciences and Animal Husbandry · 2026
The present study was conducted to evaluate the effect of pre-treatment on the colour and proximate composition of freeze-dried chicken breast meat chunks. Boneless chicken breast meat was cut into 2.0 cm chunks and subjected to four pre-treatments, namely control (T?), treatment with 0.25% turmeric powder (T?), blanching at 90 °C for 2 min (T?) and cooking to an internal temperature of 75 °C (T?). The meat chunks were frozen at ?40 °C for 12 h subsequently freeze-dried for 10 h with the condenser maintained between ?70 and ?80 °C and the chamber pressure below 10 P. The proximate composition