
Research article · 2025 · Full text
International Journal of Agriculture and Food ScienceEvaluating agricultural patterns and crop shifts in Vadodara-Chhotaudepur District of Gujarat, India
Volume 7(5) · Pages 55–61 · DOI: 10.33545/2664844x.2025.v7.i5a.380 ↗
Research areasAgricultural Economics and PracticesAgricultural risk and resilience
Abstract
Author-writtenIndia is an agrarian country, and agriculture is one of the major sources of food and income in India. Around 20% of Gujarat's economy comes from agriculture sectors. There are observable shifts in Gujarat's crop patterns, land use, and productivity. Many districts in Gujarat are experiencing administrative and environmental changes. The study assesses long-term agriculture patterns from the year 1997-98 to 2022-23 in five-year intervals. The analysis focuses on ten major crops of the region, representing both Kharif and Rabi seasons. Parameters such as agricultural area, production, and yield were examined to evaluate the crop performance. Further, relative yield gap analysis was done to compare the state yield to the study region, which revealed insights into the crop selection and potential of the study area as an agricultural region. The results indicate a significant decline in the area and yield of food crops, while there are significant increases in high-value cash crops such as cotton, tobacco, and oilseeds. These patterns reflect a growing emphasis on commercial agriculture, driven by urban expansion, climate variability, and changing market incentives.
Summary
Source-checkedPlain-language reading of the full paper, prepared with AI and checked against the text. Each point links to the authors' own words.
Why it matters
- Agriculture is a primary source of food and income in India, contributing approximately 20% to the economy of Gujarat. View evidence ↗
- Gujarat's districts are seeing changes in environmental and administrative factors, leading to observable shifts in land use, productivity, and crop patterns. View evidence ↗
The question
- The study aims to assess long-term agricultural patterns for ten major Kharif and Rabi crops in the Vadodara-Chhotaudepur region from 1997-98 to 2022-23. View evidence ↗
What they did
- Crop performance was evaluated by examining three main parameters: agricultural area, production, and yield. View evidence ↗
- The researchers used a relative yield gap analysis to compare the production performance of the Vadodara-Chhotaudepur district against the state of Gujarat. View evidence ↗
What they found
- The area used for foodgrain production saw a substantial decrease, falling from 2909 thousand hectares in 1997-98 to 1786.34 thousand hectares in 2022-23. View evidence ↗
- Cash crop areas increased over the study period, with oilseed cultivation growing from 297 to 682.69 thousand hectares and cotton farming increasing from 1498 to 1854.79 thousand hectares. View evidence ↗
- Rice yields showed steady growth, increasing from 1000 kg/ha in 1997-98 to 1690 kg/ha in 2022-23. View evidence ↗
- Rabi foodgrain production grew significantly from 1333 kg/ha to 2721 kg/ha, outperforming the growth of kharif foodgrains, which rose from 1052 kg/ha to 1477 kg/ha. View evidence ↗
- Rice production in the district consistently underperformed compared to the state average, with negative yield gaps ranging from -29.90% to -35.48%. View evidence ↗
- Wheat's relative performance declined over time, shifting from a 32.32% advantage over the state average in 1997-98 to a -3.69% disadvantage in 2022-23. View evidence ↗
- Tobacco cultivation showed a significant decline relative to the state, with yield gaps reaching -79.30% and -65.20% in recent years. View evidence ↗
What it means
- The authors conclude that the region has shifted from staple foodgrain production toward more profitable commercial crops. View evidence ↗
- The authors recommend strategic investments in irrigation, pulse productivity projects, and crop rotation to eliminate yield gaps and optimize land use. View evidence ↗
Visual summary
3 visualsIllustrations explain the paper; charts are replotted from the paper's own table values.
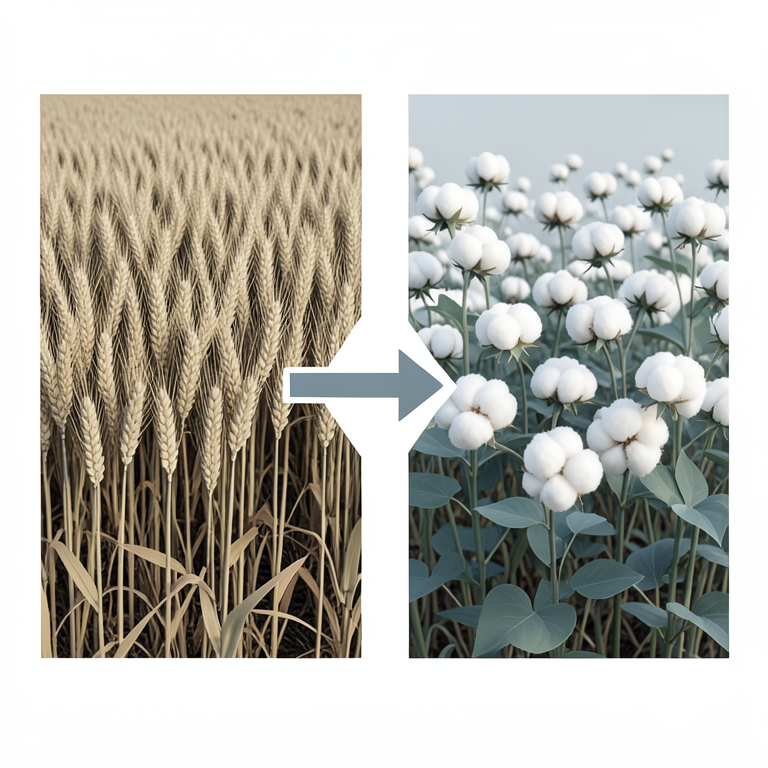
Shift from Foodgrains to Cash Crops
AI-generated conceptual illustration (Agricultural fields in Gujarat, India, featuring wheat, rice, cotton, and oilseed plants). It explains the idea and does not show study data.
View source evidence ↗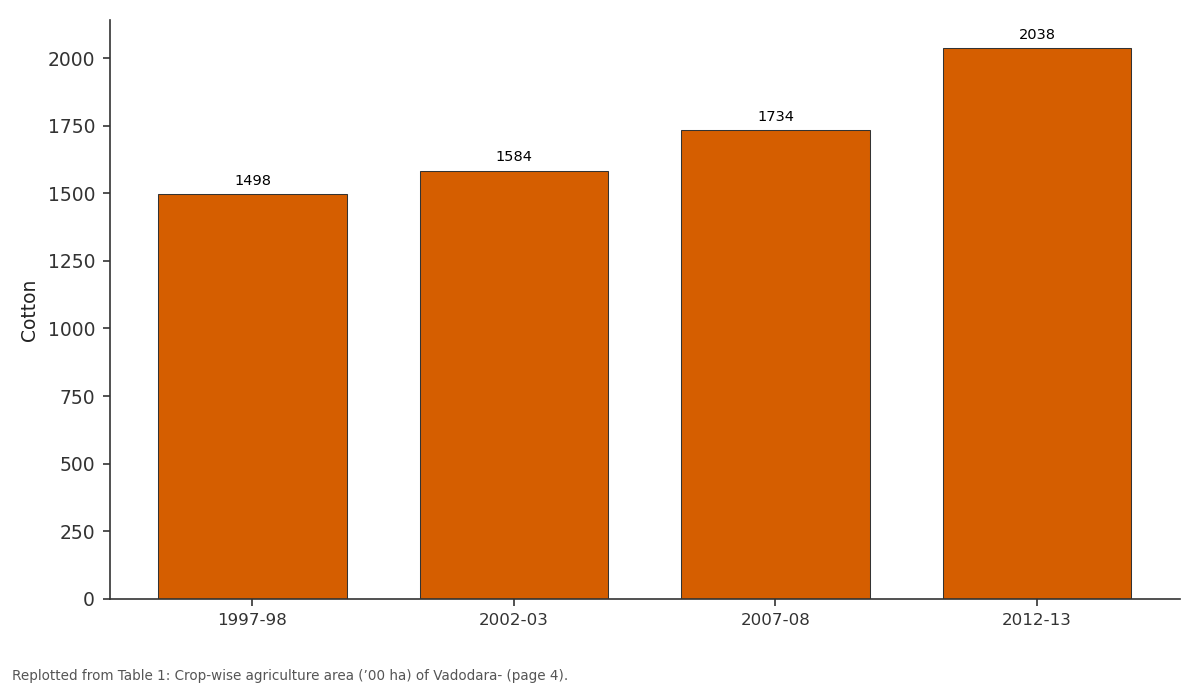
Cotton: 1997-98 vs 2002-03 vs 2007-08 vs 2012-13
Replotted from Table 1 (page 4) of the original paper. Every bar is the paper's own table value.
View source evidence ↗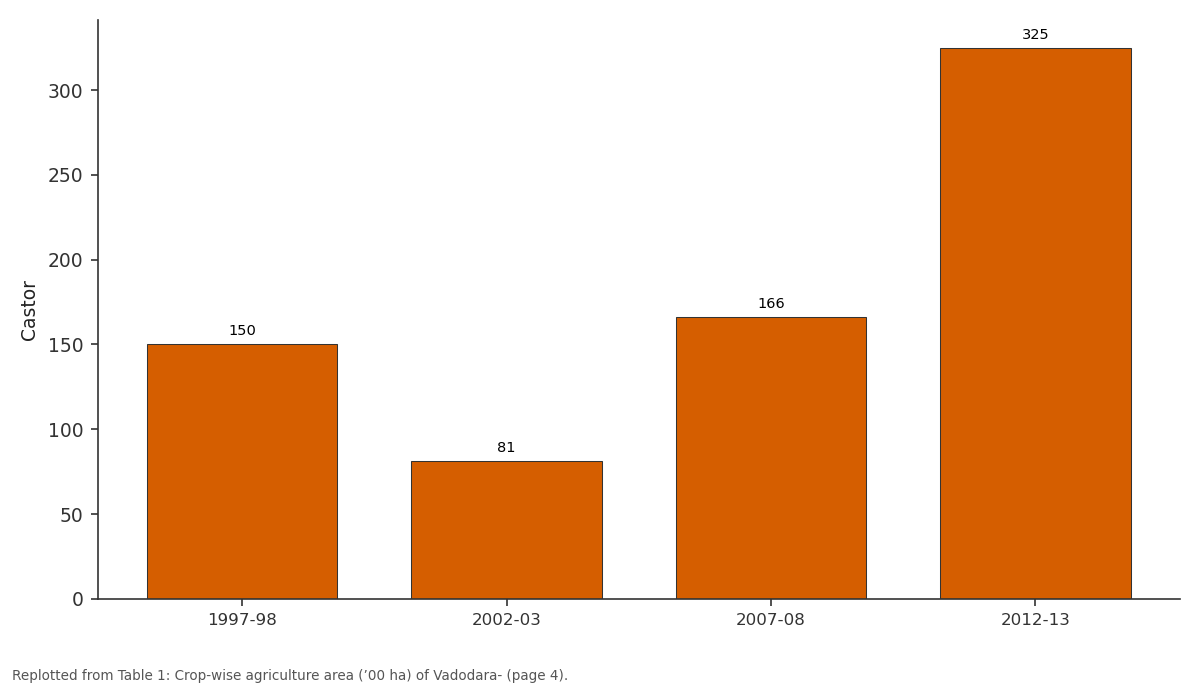
Castor: 1997-98 vs 2002-03 vs 2007-08 vs 2012-13
Replotted from Table 1 (page 4) of the original paper. Every bar is the paper's own table value.
View source evidence ↗Figures & tables
From the original paper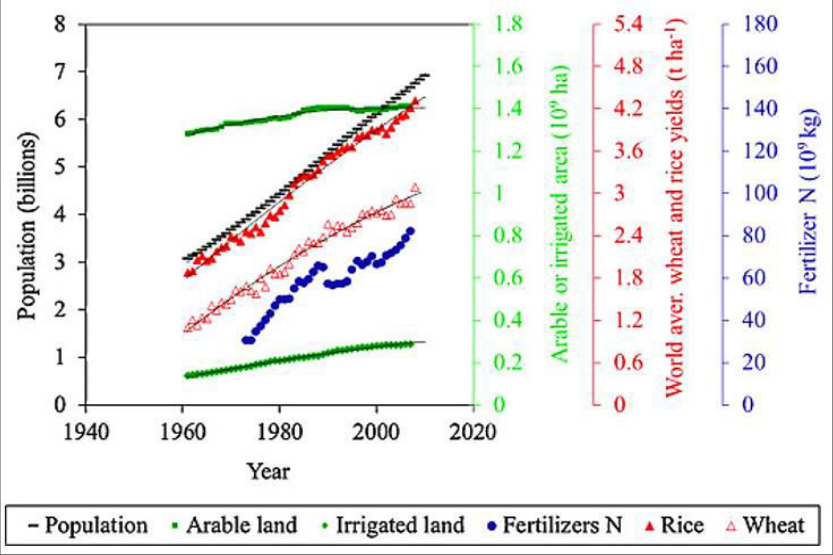 Figure 1
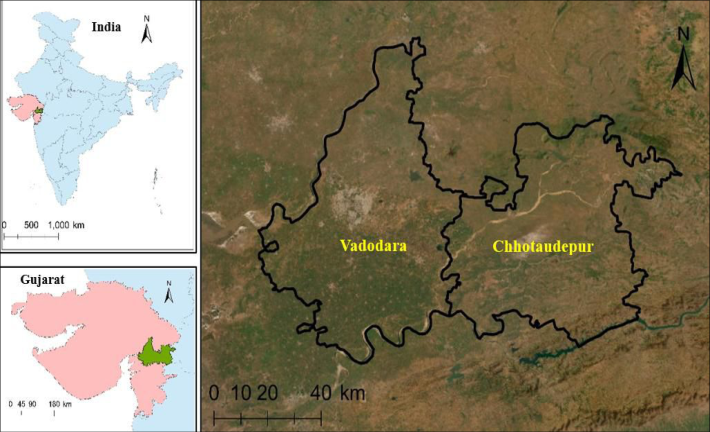 Figure 2
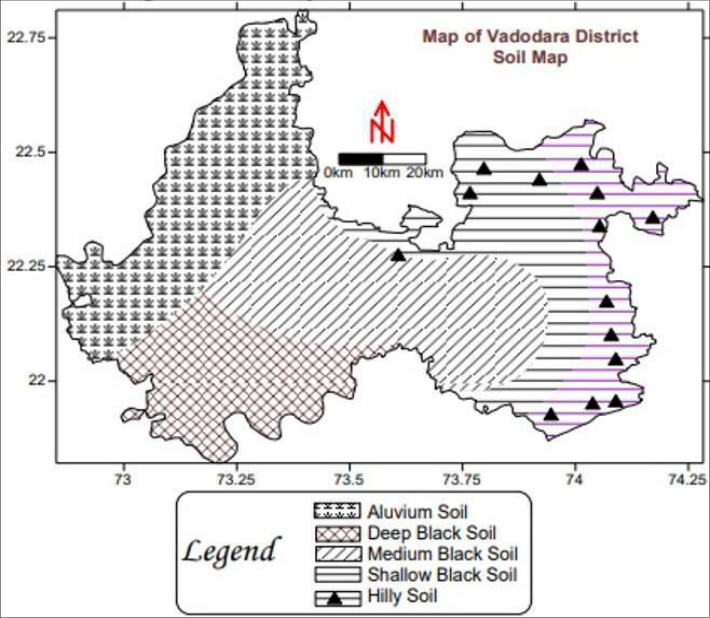 Figure 4
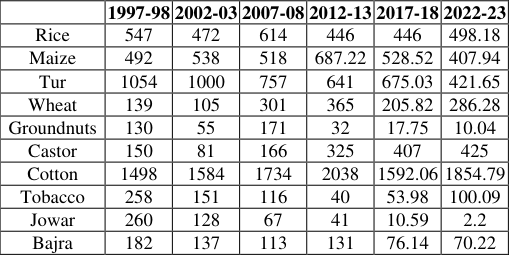 Table 1
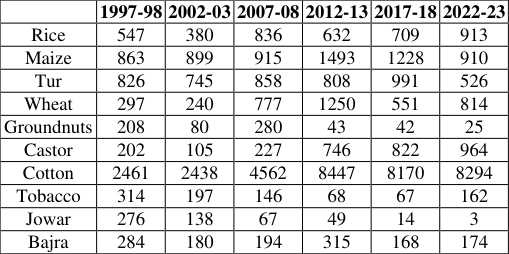 Table 2
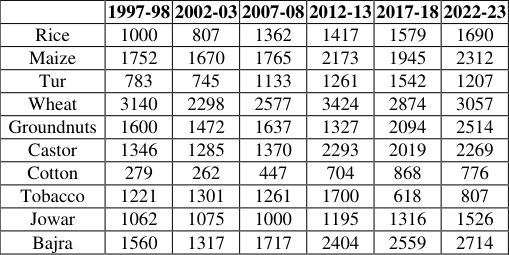 Table 3
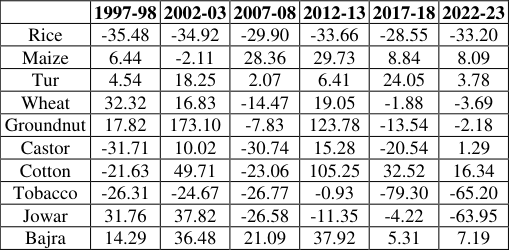 Table 4
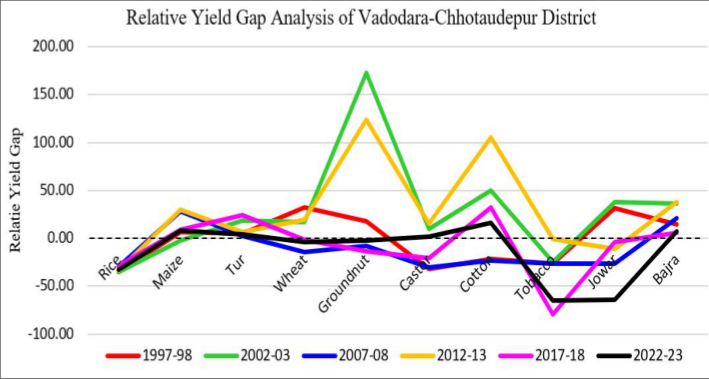 Figure 5
Introduction
During the period from 10,000 to 4,000 years ago, agriculture independently emerged at least seven times worldwide (Taiz, 2013) [14] . A distinct group of crop species were cultivated in each of these seven primary areas of domestication. For instance, the primary domesticated crops in Asia were rice and millet; in Africa, sorghum; in Mexico, maize, squash, and beans; in South America, the potato and sweet potato and in North America, sunflowers (Taiz, 2013) [14] . All of these different crops travelled through historical trade, cultural exchanges & migrants and diversified the agriculture production of particular locality. India also received some of its major crops such as Maize, Potato, Tea, etc from travellers of other countries. Increased reproductive output, non-dehiscent fruits, self-pollination, bigger seeds and fruits, loss of seed dormancy, quick and uniform germination, uniform ripening, annual life cycle, and palatability were all genetic features that were usually selected during domestication (Taiz, 2013) [14] . Since its domestication to the age of industrialization agriculture has remain primary source of food and income to the majority of population. In India Agriculture is still the primary source of earning for the rural population and this sector individually represents 23% of India's Gross National Product (GNP), which is playing an important role in the country's socioeconomic growth (Patel et al., 2020) [9] . While the world's population grew from 3 to 7 billion people between 1960 and 2010, agricultural productivity per person increased as well, despite only 10% more agricultural land being available for production (Van Ittersum & Cassman, 2013) [16] . According to a study by Smil (2001) [13] and Von Braun (2005) [20] food production has kept up with rising demand over the last few decades. Modern day's major concerns are its distribution and access (Pingali, 2006) [10] , and there are growing worries about threats to the world's food supply from growing competition from the production of animal feed, biofuels, and climate change (Verhagen et al., 2007) [11] . To satisfy the rising demand, yields must be increased and pre-and post-harvest losses must be decreased (Roetter and van Keulen, 2007, Meerburg et al., 2009) [11,8] . [16] . To determine the possible scope for increasing average yields by management adjustments, the first step is to estimate the extent of the yield gap and the second step is to determine the main reasons of the yield gap (Lobell, 2013) [7] .
In certain areas, the gap between farmers actual yields and what may be theoretically obtained under optimal management has reduced to such an extent that it is both theoretically challenging and economically less viable to increase farmers yields further (Van Ittersum & Cassman, 2013) [16] . However, because of their favourable climate, high-quality soil, and occasionally access to irrigation, some areas have a considerably greater potential than others to sustain higher yields in a sustainable way (Van Ittersum & Cassman, 2013) [16] .
Fig 1:
Evolution of population, arable land area, world average wheat and rice yields, fertilizer N use and irrigated area between 1960 and 2010 Source: (Van Ittersum, 2011) [15] Study area
In the central region of Gujarat's mainland, between 21°49'19" and 22°48'37" N latitudes and 72°51'05" and 74°16'55" E longitudes, with the area of 7548-squarekilometer is Vadodara district (Bhowmik & Bhatt, 2023) [1] . Fertile ground in Vadodara district is mostly found in agricultural areas and plains, particularly in the district's eastern and central regions (Bhowmik & Bhatt, 2024) [2] . Primarily, the Vadodara district area has a sub-tropical climate with moderate humidity because it is situated south of the Tropic of Cancer and in the area between the parched North Gujarat plains and the South Gujarat regions that have substantial rainfall. [12] . According to the 2011 statistics, there are around 4.17 million population living inside the Vadodara-Chhotaudepur district encompassing total area of 7527 km2, of which 777.8 km2 is forest area (Chandole & Joshi, 2023) [3] . There were 12 Talukas in Vadodara-Chhotaudepur district in 2011, but for better administration and growing population a separate Chhotaudepur district was carved out in year 2014. This explains why two distinct districts were chosen as the entire study area since the available agricultural data from before year 2014 is aggregated for both districts (Vaijnath Kantiram Chavan et al., 2024) [19] . The district's two main rivers, the Narmada and the Mahi, run along its northwest and southern borders, respectively, while the Dhadhar, a distinct small river system with many tributaries, runs through the district's south-central region. In general, the entire district is separated into three river basins: The Dhadhar, the Mahi, and the Narmada (Gupte, 2011) [6] . There are various other rivers also which drains the district like, Dhandhar, Orsang, Vishwamitri and Jambua. Mahi and Narmada Doab, an alluvial plain region with gently sloping terrain, make up the western and southern parts of the Vadodara district. Three general categories can be used to classify the Vadodara district's soils. These Three types of soils are red or hilly, alluvial, brown and black. The agricultural crops grown in the district are diverse and include both food and non-food crops. Food grains such as rice, wheat, jowar, bajra, maize, etc., as well as pulses make up the main food crops. Fruits, vegetables, and sugarcane are other food crops Cotton, Ground nuts, castor, tobacco and many other are example of non-food crops (Gupte, 2011) [6] .
[6] Relative Yield Gap Relative yield gap is an approach used to assess the crop production performance of a particular region (i.e., the Vadodara-Chhotaudepur district) by comparing it to the actual observed yield of a broader reference area (i.e., Gujarat State). This approach focuses on intraregional differences to highlight the performance of a particular region to observe the standard of a larger area and can be calculated by the equation ( 1). Relative yield gap helps policymakers to identify crops that are performing better in that particular state. It also helps to find out the suitable climatic, geographic, and irrigation conditions, infrastructure, and technology adoption for particular crops to perform better.
The relative yield gap results indicate district's yield
performance in relation to state average yield. When the yield gap reaches 0% the district matches the state performance, while district produces greater yields than the state average, the percentage yield gap is positive which indicates its higher agricultural performance at a regional level. The district shows signs of high performance based on its favorable agro-climatic situation and effective farming techniques and efficient input use. When the district yield falls beneath state average the yield gap becomes negative
Results and Discussion
Results and Discussion
Trends of crop-wise agricultural area in Vadodara District (1997-2023)
The agricultural practices in Vadodara district's farming areas underwent substantial changes between the years 1997-98 to 2022-23. Foodgrain production area decreased substantially from its first measurement of 2909 thousand hectares in 1997-98 until it dropped to 1786.34 thousand hectares in 2022-23. Foodgrain cultivation area declined year after year because urban development and land use transition forced farmers to choose profit-generating cash crops. During the kharif season cultivation territory of both cereal and pulse crops reduced drastically. The cultivated area of kharif cereal farming decreased by 598 thousand hectares from 1997-98 until the harvest reached 610.42 thousand hectares in 2022-23. During this corresponding period the kharif pulse cultivation decreased by 767.73 thousand hectares. Two traditional cereal varieties tur and jowar along with bajra have become less popular in cultivation since their farmed land decreased from 1054 to 421.65 thousand hectares respectively (Swagata Bera, 2024) [18] . The reduction in preference or suitability of these coarse grains demonstrates the main reason behind this decline. The cereal group within rabi crops elevates its planting areas consistently and controls its production figures at current levels. The rabi food grain regions managed to restore previous crop swinging patterns and expanded to 545.49 thousand hectares following their initial 384 thousand hectares. The wheat stock for the 2022-23 season expanded its cultivation areas to 286.28 thousand hectares. The production of oilseeds along with cotton has demonstrated increasing trends as cash crops. Over time the area dedicated to oilseed cultivation increased from 297 to 682.69 thousand hectares simultaneously with a cotton farming area grew from 1498 to 1854.79 thousand hectares. The agricultural policy experiences widespread transformation coming from high returns and increasing market requirements and possible governmental support for cash crops. Pulses witnessed a massive decrease in their cultivated land between 1279 and 521.5 thousand hectares throughout both seasons even though they are nutritionally important and economically valuable crop. Statistics showed Vadodara has shifted agricultural production toward more profitable crops like cotton alongside oilseeds because kharif food grain farming has taken a decline. Farmers make such decisions considering agroclimatic conditions and follow policy recommendations while considering economic benefits in each specific period.
Trends of crop production in Vadodara District (1997-2023)
The major crop production records of Vadodara district from 1997-1998 to 2022-2023 give insights into both farming pattern adjustments and technological progress as well as climate variability. The constant production levels of coarse grains and pulses together with yield improvements in certain crops shape an overall rising trend. The 2022-23 foodgrain production in Vadodara district came to 3429.70 ('00 MT) while maintaining its maximum level in 2012-2013 at 4788 ('00 MT) starting from an initial value of 3224 ('00 MT) during 1997-98. High levels of production stemmed from enhanced monsoons combined with better agricultural methods and increased rabi harvests during that time. Field production numbers appear to have decreased because farmers decreased their land cultivation as erratic rain patterns combined with constant harvest output rates. The kharif harvests produced varying results of rice and maize throughout successive years. Rice cultivation area decreased to 913.43 during 2022-23 yet production efficiency along with yield grew from 547 to 913.43. The area used to grow maize decreased to reach 909. 6
Trends of Crop Yield in Vadodara District (1997-2023)
Principal crop yields in Vadodara district from 1997-98 to 2022-23 show that agricultural development took a definite turn due to advanced practices which created improved crop output across the region. Improvements were made to various irrigation and farming technologies and crop management methods which brought significant development in this time period. The output values of cereal crops specifically rice and maize and wheat continue to show steady growth increments. Producers cultivated rice yields at a steady rate from 1000 kg/ha in 1997-98 until they reached 1690 kg/ha in 2022-23. During this time period maize yield production escalated from its initial 1752 kg/ha to 2312 kg/ha. Prior to its peak of 3424 kg/ha in 2012-13 wheat production levels reached 3057 kg/ha because farmers used agricultural inputs effectively to achieve this advancement from 3140 kg/ha. There was significant growth noted in the production levels of oilseed crops. The implementation of crop diversification alongside better seed varieties led India to achieve total oilseed yield of 1810 kg/ha alongside groundnut cultivation yield of 2514 kg/ha. Cotton production in the yearly assessment increased remarkably from 279 kg/ha through 2017-18 reaching its maximum level at 868 kg/ha then dropped slightly to 776 kg/ha during 2022-23 though exceeding traditional historical records. All pulse crops follow their own evaluation patterns differently during this observation phase. Hectare yields of rabi pulse crops increased from 783 to 1608 kg per hectare so kharif pulses demonstrated inconsistent results by showing 1375 kg per hectare in 2017-18 and measuring 1133 kg per hectare presently. The local climate together with minimal technological advancements have made these production numbers irregular because pulse crops respond strongly to variability in monsoons. The downward movement of total pulse yields starting from 2017 requires special attention from experts who need to focus on improving pulse productivity levels. The rabi foodgrains production increased by 1799 kg/ha from 1333 kg/ha to 2721 kg/ha during the period while kharif foodgrains experienced a lower growth from 1052 kg/ha to 1477 kg/ha. The rising gap demonstrates how rabi cultivation with irrigation support has replaced traditional kharif cultivation which now faces severe rainfed challenges. Agricultural modernization became evident through total foodgrain yield growth from 1108 to 1890 kg/ha which happened despite changes in climate along with socioeconomic conditions. The performance evaluation shows that crop yields steadily increased for most agricultural assets including cereals and oilseeds although pulses exhibit slower and less reliable yield growth. The empirical data shows why specific actions need to be directed toward weak production areas while confirming that agricultural initiatives and farmer adoption strategies have been successful within Vadodara's specific agricultural environment. The yield of major ten crops of Vadodara district compare to Gujarat state shows a distinct crop-specific and time-based inequalities. Rice consistently shows negative yield gap across the study period, indicating Vadodara's rice yield is significantly lower than the state. The yield gaps of rice in Vadodara continue to be negative in all years between 29.90% and -35.48% due to its lower production than the state average. which highlights Vadodara's proportional disadvantage in rice production, owing to climatic conditions and improper irrigation facilities. Data indicates that maize and Tur (pigeon pea) exhibit positive yield gaps in most recorded years achieving maximum rates of 29.73% for maize in 2012-13 and 24.05% for Tur in 2017-18. The production results show a comparative advantage for pulses and coarse cereals mainly because of favourable soil conditions and local agricultural practices together with climatic adaptations. ). The Vadodara district reveals significant growth in cotton production which is indicated by two large positive results of 105.25% in 2012-13 and 32.52% in 2017-18 representing strong production capabilities possibly resulting from modified seed variety adoption, improved pest management and suitable soil types. The negative yield gaps recorded in tobacco cultivation for recent years reached their worst levels at -79.30% and -65.20% which demonstrates significant decline when compared to statewide performance. The yield gaps of jowar and Bajra reveal significant changes in the data since moving from early advantage to major negative levels especially jowar reached -63.95% in 2022-23. The poor adaptation together with inadequate crop management practices characterizes the farming practices in the district's ecological zone. This analysis can be used into policy formulation, and district level agricultural planning aiming at increasing overall production and sustainability of the region.
Relative yield gap analysis
Relative yield gap analysis
Conclusion
Throughout a period from 1997-98 until 2022-23 Vadodara district underwent a noticeable shift in its agricultural sector as farmers began focusing on commercial crops instead of foodgrains. The reduction of kharif foodgrain and pulse cultivation areas happened primarily because of shifting land use patterns, altering food preferences, policy incentives and economic profitability changes. The farming of wheat in Rabi season maintained satisfactory foodgrain production levels but commercial farming of cotton and oilseed grew much higher because of strong market demands backed by technological advancements. Statistics from crop yields reveal better productivity in cereal and oilseed production however pulse and coarse grain yields remain inconsistent because of deficient irrigation and unreliable monsoon patterns. Data from yield gap analysis demonstrates that the rice and wheat and bajra production in Vadodara district remains below state averages while the district achieves better results in maize, Tur and cotton results when compared against state levels during particular years. Various sustainability programs for food production require strategic measures for specific crops in designated areas. Strategic investments into irrigation systems along with pulse crop productivity improvement projects combined with proper crop rotation schemes will both eliminate existing negative yield gaps and optimize all land resources across the district.
Acknowledgement
AcknowledgementThis research is financially supported by University Grants Commission, India as UGC-NET/JRF to Kandarp Parmar. Additionally we would like to thank the Directorate of Gujarat, Department of Agriculture, farmer's welfare and co-operation, Government of Gujarat for providing necessary data.
Figures and tables from the paper
| — | 1997-98 | 2002-03 | 2007-08 | 2012-13 | 2017-18 | 2022-23 |
|---|---|---|---|---|---|---|
| Rice | 547 | 472 | 614 | 446 | 446 | 498.18 |
| Maize | 492 | 538 | 518 | 687.22 | 528.52 | 407.94 |
| Tur | 1054 | 1000 | 757 | 641 | 675.03 | 421.65 |
| Wheat | 139 | 105 | 301 | 365 | 205.82 | 286.28 |
| Groundnuts | 130 | 55 | 171 | 32 | 17.75 | 10.04 |
| Castor | 150 | 81 | 166 | 325 | 407 | 425 |
| Cotton | 1498 | 1584 | 1734 | 2038 | 1592.06 | 1854.79 |
| Tobacco | 258 | 151 | 116 | 40 | 53.98 | 100.09 |
| Jowar | 260 | 128 | 67 | 41 | 10.59 | 2.2 |
| Bajra | 182 | 137 | 113 | 131 | 76.14 | 70.22 |
Table text extracted from the original PDF; superscript letters are shown inline. The original table image is below.
View original table image
| — | 1997-98 | 2002-03 | 2007-08 | 2012-13 | 2017-18 | 2022-23 |
|---|---|---|---|---|---|---|
| Rice | 547 | 380 | 836 | 632 | 709 | 913 |
| Maize | 863 | 899 | 915 | 1493 | 1228 | 910 |
| Tur | 826 | 745 | 858 | 808 | 991 | 526 |
| Wheat | 297 | 240 | 777 | 1250 | 551 | 814 |
| Groundnuts | 208 | 80 | 280 | 43 | 42 | 25 |
| Castor | 202 | 105 | 227 | 746 | 822 | 964 |
| Cotton | 2461 | 2438 | 4562 | 8447 | 8170 | 8294 |
| Tobacco | 314 | 197 | 146 | 68 | 67 | 162 |
| Jowar | 276 | 138 | 67 | 49 | 14 | 3 |
| Bajra | 284 | 180 | 194 | 315 | 168 | 174 |
Table text extracted from the original PDF; superscript letters are shown inline. The original table image is below.
View original table image
| — | 1997-98 | 2002-03 | 2007-08 | 2012-13 | 2017-18 | 2022-23 |
|---|---|---|---|---|---|---|
| Rice | 1000 | 807 | 1362 | 1417 | 1579 | 1690 |
| Maize | 1752 | 1670 | 1765 | 2173 | 1945 | 2312 |
| Tur | 783 | 745 | 1133 | 1261 | 1542 | 1207 |
| Wheat | 3140 | 2298 | 2577 | 3424 | 2874 | 3057 |
| Groundnuts | 1600 | 1472 | 1637 | 1327 | 2094 | 2514 |
| Castor | 1346 | 1285 | 1370 | 2293 | 2019 | 2269 |
| Cotton | 279 | 262 | 447 | 704 | 868 | 776 |
| Tobacco | 1221 | 1301 | 1261 | 1700 | 618 | 807 |
| Jowar | 1062 | 1075 | 1000 | 1195 | 1316 | 1526 |
| Bajra | 1560 | 1317 | 1717 | 2404 | 2559 | 2714 |
Table text extracted from the original PDF; superscript letters are shown inline. The original table image is below.
View original table image
| — | 1997-98 | 2002-03 | 2007-08 | 2012-13 | 2017-18 | 2022-23 |
|---|---|---|---|---|---|---|
| Rice | -35.48 | -34.92 | -29.90 | -33.66 | -28.55 | -33.20 |
| Maize | 6.44 | -2.11 | 28.36 | 29.73 | 8.84 | 8.09 |
| Tur | 4.54 | 18.25 | 2.07 | 6.41 | 24.05 | 3.78 |
| Wheat | 32.32 | 16.83 | -14.47 | 19.05 | -1.88 | -3.69 |
| Groundnut | 17.82 | 173.10 | -7.83 | 123.78 | -13.54 | -2.18 |
| Castor | -31.71 | 10.02 | -30.74 | 15.28 | -20.54 | 1.29 |
| Cotton | -21.63 | 49.71 | -23.06 | 105.25 | 32.52 | 16.34 |
| Tobacco | -26.31 | -24.67 | -26.77 | -0.93 | -79.30 | -65.20 |
| Jowar | 31.76 | 37.82 | -26.58 | -11.35 | -4.22 | -63.95 |
| Bajra | 14.29 | 36.48 | 21.09 | 37.92 | 5.31 | 7.19 |
Table text extracted from the original PDF; superscript letters are shown inline. The original table image is below.
View original table image
References
18 in the original paper- Bhowmik S, Bhatt B. Spatiotemporal analysis of land surface temperature owing to NDVI: A case study of Vadodara District, Gujarat. J Geomatics. 2023;17(1):83-90. DOI: 10.58825/jog.2023.17.1.83.
- Bhowmik S, Bhatt B. Drought Monitoring Using MODIS Derived Indices and Google Earth Engine Platform for Vadodara District, Gujarat. J Indian Soc Remote Sens. 2024 Apr;52:1-16. DOI: 10.1007/s12524024-01922-1.
- Chandole V, Joshi GS. Case study of rainfall and temperature assessment through trend and homogeneity analyses in Vadodara and Chhotaudepur district of Gujarat State, India. Environ Monit Assess. 2023 May;195(5):589. DOI: 10.1007/s10661-023-11089-w.
- Vermeulen SJ, Meerburg BG, Schils RLM, Verhagen J, Kuikman PJ. Feeding the world's increasing population while limiting climate change impacts: linking N2O and International Journal of Agriculture and Food Science https://www.agriculturaljournals.com CH4 emissions from agriculture to population growth. Environ Sci Policy. 2010 Feb;13(2):89-96. DOI: 10.1016/j.envsci.2009.11.001.
- Gupte P. Vadodara District Report-CGWB-WCR 2011. 2011 [cited 2025 Apr 29]. Available from: https://www.researchgate.net/publication/234012681_V adodara_District_Report_-_CGWB-WCR_2011.
- Lobell DB. The use of satellite data for crop yield gap analysis. Field Crops Res. 2013 Mar;143:56-64. DOI: 10.1016/J.FCR.2012.08.008.
- Meerburg BG, Singleton GR, Leirs H. The year of the rat ends-time to fight hunger! Pest Manag Sci. 2009 Apr;65(4):351-352.
- Patel MP, Gami B, Patel A, Patel P, Patel B. Climatic and anthropogenic impact on groundwater quality of agriculture dominated areas of southern and central Gujarat, India. Groundwater Sustain Dev. 2020 Jan;10:100306. DOI: 10.1016/j.gsd.2019.100306.
- Pingali P. Economic reforms and food security: the impact of trade and technology in South Asia. Agric Econ. 2006 Dec;35 Suppl 1:115-128.
- Roetter RP, van Keulen H. Food security. In: Roetter RP, van Keulen H, Kuiper M, Verhagen J, Van Laar HH, editors. Science for Agriculture and Rural Development in Low-Income Countries. Dordrecht (Netherlands): Springer, 2007, p. 27-56.
- Sabhaya M, Solanki PM, Pancholi V, Singh P. Geotechnical Characteristics of soils to identify substratification of Vadodara City, Gujarat, Western India. J Indian Geophys Union. 2018;21(2):105-115.
- Taiz L. Agriculture, plant physiology, and human population growth: past, present, and future. Theor Exp Plant Physiol. 2013 Oct;25(3):167-178. DOI: 10.1590/s2197-00252013000300001.
- Van Ittersum MK. Future harvest the fine line between myopia and utopia. Wageningen (Netherlands): Wageningen University, 2011 [cited 2025 Apr 29]. Available from: https://edepot.wur.nl/169680.
- Van Ittersum MK, Cassman KG. Yield gap analysisRationale, methods and applications-Introduction to the Special Issue. Field Crops Res. 2013 Mar;143:1-3. DOI: 10.1016/J.FCR.2012.12.012.
- Verhagen J, Wo¨sten H, Jager DA. Agriculture and environment. In: Roetter RP, van Keulen H, Kuiper M, Verhagen J, Van Laar HH, Editors. Science for Agriculture and Rural Development in Low-Income Countries. Dordrecht (Netherlands): Springer, 2007, p. 57-82.
- Bera S. Spatiotemporal analysis of land use/land cover changes and vegetation health in south Andaman district using remote sensing and GIS. Int J Geogr Geol Environ 2024;6(2):57-65. DOI: 10.22271/27067483.2024.v6.i2a.289
- Chavan VK, Patil PK. A study of agriculture land use efficiency of Dhule district: A geographical analysis. Int J Geogr Geol Environ 2024;6(1):170-173. DOI: 10.22271/27067483.2024.v6.i1c.21
- Braun VJ. Agricultural economics and distributional effects. Agric Econ. 2005 Jan;32(1):1-20.