
Research article · 2024 · Full text
International Journal of Agriculture and Food ScienceConsumers’ buying behaviors towards carbonated beverages in Navsari District of Gujarat
Volume 6(2) · Pages 204–208 · DOI: 10.33545/2664844x.2024.v6.i2c.242 ↗
Research areasBusiness Strategies and InnovationFood Waste Reduction and SustainabilityConsumer Packaging Perceptions and Trends
Abstract
Author-writtenThis study investigates the buying behavior of consumers toward carbonated beverages in Navsari District, Gujarat. Data was collected from 200 respondents across Jalapor and Gandevi talukas using a semi-structured questionnaire and convenience sampling method. This Study focusing on their socio-economic profile and the factors that influence their preferences and purchasing decision the research reveals that the 26 to 35 age group constitutes the largest segment of carbonated beverage consumers, representing 41% of the sample, followed by the 16 to 25 age group (36.5%). Male respondents account for 61% of the sample, with the majority having a school-level education (39.5%) and belonging to nuclear families (73%). Taste emerges as the primary factor influencing purchase decisions, followed by price, brand image, and availability. Consumers most frequently purchase 200 ml quantities from grocery and pan shops, indicating a preference for convenience and affordability. Daily consumption patterns (34.5%) highlight the routine nature of carbonated beverage intake. The findings suggest that flavor variety, competitive pricing, and effective advertising play pivotal roles in shaping consumer behavior. Beverage companies targeting this market segment should focus on enhancing product taste, ensuring affordability, and expanding local retail distribution to align with consumer preferences.
Summary
Source-checkedPlain-language reading of the full paper, prepared with AI and checked against the text. Each point links to the authors' own words.
Why it matters
- The global carbonated beverage market is substantial, valued at USD 440.56 billion in 2020 with a projected growth rate of 5.1% through 2027. View evidence ↗
- Market growth in emerging economies, including India, is driven by rising disposable incomes and less stringent regulations. View evidence ↗
- Carbonated drinks hold cultural significance, often being linked to social gatherings, traditions, and emotional comfort. View evidence ↗
The question
- The study aimed to explore consumer buying behaviors in the Navsari district by analyzing socio-economic profiles and the factors influencing preferences and purchasing decisions. View evidence ↗
What they did
- Primary data was gathered from 200 consumers in the Jalapor and Gandevi Talukas of Navsari District using a semi-structured schedule and convenience sampling. View evidence ↗
- The researchers used Henry Garret's ranking techniques to analyze the order of merit provided by respondents for various consumer preference and behavior factors. View evidence ↗
What they found
- The primary consumer segment consists of young adults, with 41% aged 26-35 and 36.5% aged 16-25. View evidence ↗
- Male consumers were more represented in the study sample, accounting for 61% of respondents. View evidence ↗
- A significant majority of the respondents (73%) live in nuclear family structures. View evidence ↗
- Most consumers make purchase decisions independently (37%), though social influence from friends is a strong secondary driver (30.5%). View evidence ↗
- Daily consumption is the most common pattern, reported by 34.5% of the respondents. View evidence ↗
- Consumers prefer smaller, affordable 200 ml packages (37%) or medium-sized 1 liter bottles (23%). View evidence ↗
- Grocery shops (36.5%) and pan shops (24.5%) are the primary points of purchase, highlighting the importance of local convenience. View evidence ↗
- Taste is the most important factor driving preference (ranked 1st), followed by price (ranked 2nd). View evidence ↗
- When considering factors affecting buying behavior, flavor variety is the top priority (ranked 1st), while advertising is the second most influential (ranked 2nd). View evidence ↗
What it means
- The authors recommend that beverage companies focus on flavor variety, competitive pricing, and strong advertising to attract consumers. View evidence ↗
- The authors conclude that maintaining widespread availability in local retail outlets is essential for meeting consumer needs for convenience. View evidence ↗
Visual summary
2 visualsIllustrations explain the paper; charts are replotted from the paper's own table values.
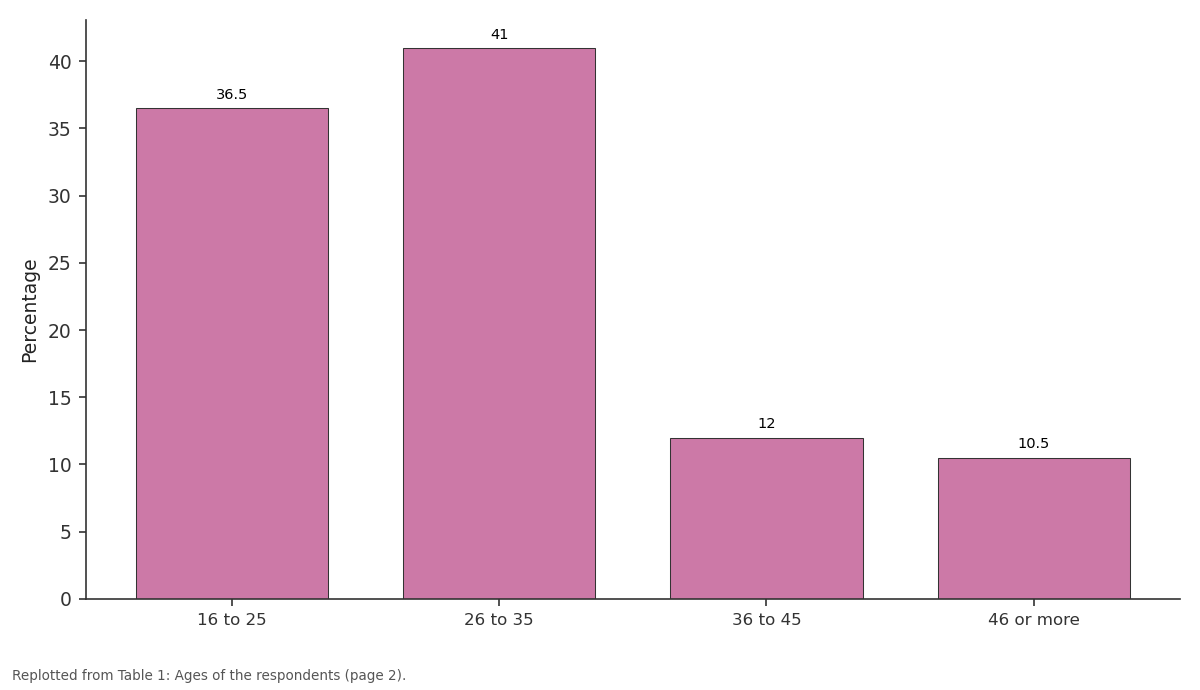
Percentage: 16 to 25 vs 26 to 35 vs 36 to 45 vs 46 or more
Replotted from Table 1 (page 2) of the original paper. Every bar is the paper's own table value.
View source evidence ↗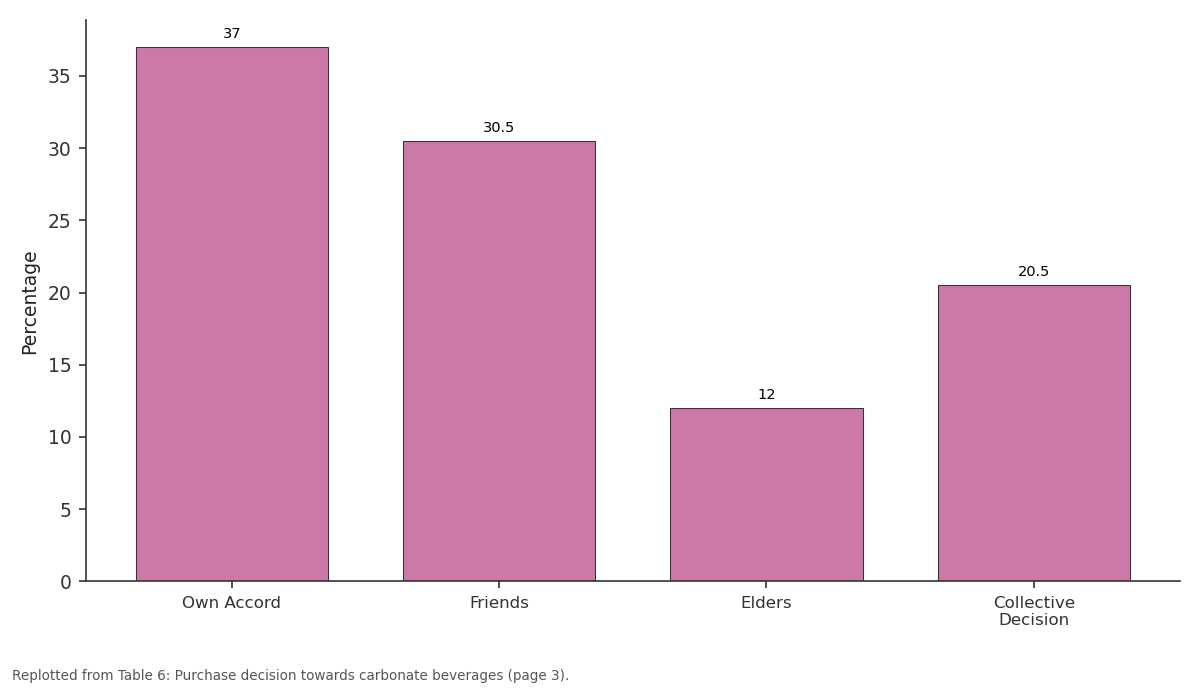
Percentage: Own Accord vs Friends vs Elders vs Collective Decision
Replotted from Table 6 (page 3) of the original paper. Every bar is the paper's own table value.
View source evidence ↗Figures & tables
From the original paper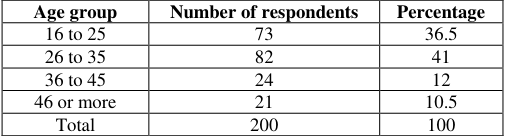 Table 1
 Table 2
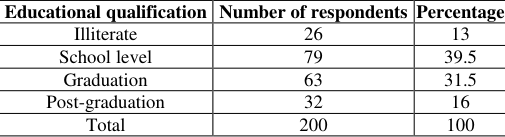 Table 3
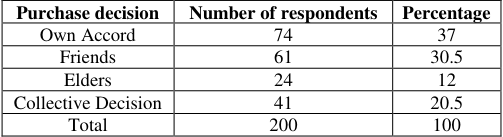 Table 6
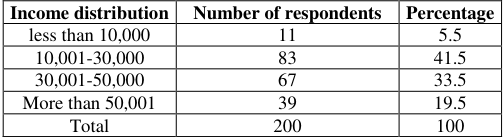 Table 4
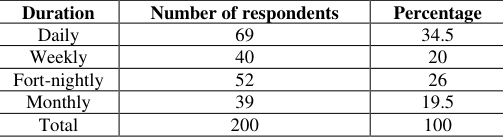 Table 7
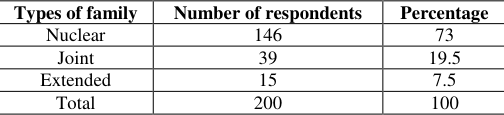 Table 5
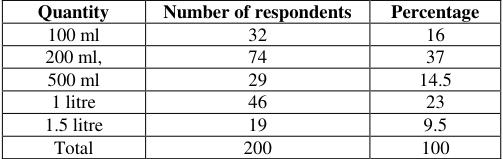 Table 8
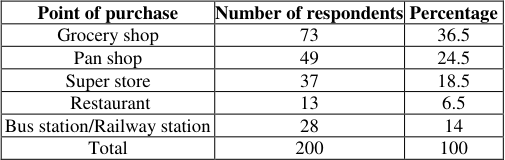 Table 9
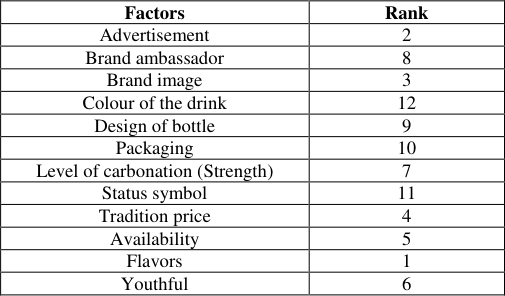 Table 11
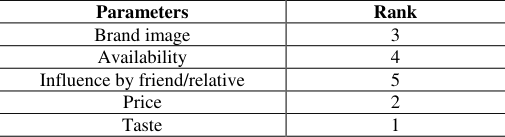 Table 10
Introduction
Carbonated beverages, commonly known as fizzy or soft drinks, are beverages infused with dissolved carbon dioxide and are typically available in bottles, cans, and PET bottles, free of alcohol. In 2020, the global market for carbonated drinks was valued at USD 440.56 billion and is projected to expand at a Compound Annual Growth Rate (CAGR) of 5.1% from 2020 to 2027. While North America currently holds the largest share of the market, the Asia Pacific region is witnessing the most rapid growth. (Statista, 2024) [8] . This growth can be attributed to factors such as less stringent regulations and increasing disposable incomes, particularly in emerging markets like China, India, Southeast Asia, South Korea, and Japan. Beyond their economic impact, carbonated drinks have cultural significance. They are often associated with celebrations, social gatherings, and emotional comfort, becoming ingrained in various traditions and rituals (Kuncoro & Kusumawati, 2021;Grier & Kumanyika, 2008) [4,3] . The social acceptance and normalization of these beverages further strengthen consumer preferences, reinforcing their presence in daily life and social interactions (Sharif et al., 2023) [9] . The popularity of carbonated drinks continues to dominate the global beverage market, with an increasing demand for new product offerings and innovations. Companies are focusing on expanding their market reach through strategies such as product diversification, which include a shift towards low-sugar and diet carbonated options, reflecting a growing consumer preference for healthier alternatives. Additionally, the expanding youth population in emerging economies, coupled with rising disposable incomes, is expected to contribute to the sustained growth of the global carbonated beverage market in the coming years. In 2023, soft drinks accounted for over 44% of the total global beverage revenue (Statista, 2024a) [8] . The market revenue from Carbonated Soft Drinks (CSDs) grew by 7.1% from 2022 to 2023, reaching USD 213 billion. This segment is dominated by both multinational corporations and regional or domestic companies (Statista, 2024a) [8] . The global CSD market, which includes products such as cola beverages, carbonated fruit drinks, lemonades, and tonic water, is projected to generate USD 226 billion in 2024. It is expected to expand at a compound annual growth rate (CAGR) of 5.33% from 2024 to 2028 (Statista, 2024b) [8] . Combined market size of CSDs and energy and sports drinks has been growing at an estimated CAGR of 8.1 percent over the past decade. In terms of retail sales value, sales peaked in 2019, at INR 1, 92,662.6 million. This was followed by a decline of 16.3 percent in 2020, due to various reasons such as supply chain disruptions and lockdowns owing to the coronavirus (COVID-19) pandemic (See Figure 3.1). Although the overall share of these products in the market 18 has been declining at a CAGR of (-) 4.3 percent, from 2011 to 2021, the per capita retail sales value of CSDs, energy drinks, and sports drinks 19 has been increasing at a CAGR of 6.8 percent. In 2011, per capita retail sales were INR 66 per capita, compared to INR 128 per capita in 2021. Similarly, in terms of retail sales volume across the previous decade, although sales volume has grown at a CAGR of 5.7 percent from 2057 million liters in 2011 to 3583 million litres in 2021, its share in the retail sales of all beverages has declined. The decline has been relatively steeper than the decline in retail sales value, at a (-) 6.4 percent CAGR from 2011 to 2021. In terms of volume, sales of carbonated soft drinks, energy drinks and sports drinks account for approximately 1 percent of total beverage sales in 2021. This study aims to explore consumer buying behaviors towards carbonated beverages in Navsari district. The research focused on, 1. To analyze the socio-economic profile of consumes 2. To exam in the factors influencing consumer preference 3. To study the factor affecting consumer buying behaviors.
Materials and Methods
The primary data was collected from consumers using a semi-structured Schedule using convince sampling technique under non-probability sampling method. The secondary data for the study was obtained from various sources, including magazines, literature reviews, government and private publications, research papers, books, and government websites. The data was collected from 200 consumers of Jalapor and Gandevi Taluka of Navsari District. Henry Garret's ranking techniques were used for analyzing data. Factors Affecting Consumer Buying Behavior and consumer preference were listed out. The order of merit given by the respondent was converted into a rank by using a formula. As per the method, the respondent has been asked to assign the rank for all and the outcome of such ranking has been converted into score value with help of Garrett's table. The factor having the highest mean value was considered to be the most important factor.
Percent position = 100 (Rij -0. The largest group of respondents falls within the 26 to 35years age range, representing 41 percent of the sample. This age group, often characterized by young adults and early professionals, is particularly relevant for consumer behavior studies as it represents a significant portion of the consumer market. The second largest group is the 16 to 25-years range (36.5%), which suggests that younger individuals are also key consumers of carbonated beverages. This demographic is likely influenced by factors such as lifestyle, trends, and marketing strategies targeting youth.
Gender of respondents:
As outlined in Table 3, the gender breakdown of the respondents reveals a higher proportion of female participants: This distribution suggests that male consumers are slightly more represented in the sample than female consumers. The higher percentage of male respondents could indicate that women in the Navsari district might exhibit distinct consumption patterns when it comes to carbonated beverages, or it could reflect the gender distribution within the survey population.
| Educational qualification | Number of respondents | Percentage |
|---|---|---|
| Illiterate | 26 | 13 |
| School level | 79 | 39.5 |
| Graduation | 63 | 31.5 |
| Post-graduation | 32 | 16 |
| Total | 200 | 100 |
Table text extracted from the original PDF; superscript letters are shown inline. The original table image is below.
View original table image
Educational qualification of respondent
The literacy level and educational qualifications of the respondents, as presented in Table 3, provide insights into the intellectual background of the sample: The majority of respondents (39.5%) have completed education up to the school level, while 31.5 percent are graduates. Approximately 16 percent of the sample holds a post-graduate qualification. The remaining 13 percent are illiterate. This suggests that while a significant portion of respondents have basic to moderate levels of education, a notable percentage is also highly educated. The educational qualifications of respondents may play a role in determining preferences, as more educated individuals may be more likely to choose health-conscious or premium carbonated beverage options. Conversely, less educated consumers may prioritize affordability or brand recognition.
Income distribution of respondents
Income is a key determinant in shaping consumer purchasing behavior. The income distribution of respondents, as detailed in Table 4, is as follows: A large proportion of respondents (41.5%) fall into the Rs. 10,001 to Rs. 30,000 income category, followed by the Rs. 30,001 to Rs. 50,000 range (33.5%). Only a small percentage (5.5%) of respondents earn less than Rs. 10,000, while 19.5 percent have an income above Rs. 50,001. These income patterns suggest that the majority of respondents are middle-income earners, which may influence their purchasing power and choices in the beverage market. Middle-income consumers may be more price-sensitive but could also be influenced by brand loyalty, promotions, and product differentiation.
| Income distribution | Number of respondents | Percentage |
|---|---|---|
| less than 10,000 | 11 | 5.5 |
| 10,001-30,000 | 83 | 41.5 |
| 30,001-50,000 | 67 | 33.5 |
| More than 50,001 | 39 | 19.5 |
| Total | 200 | 100 |
Table text extracted from the original PDF; superscript letters are shown inline. The original table image is below.
View original table image
Type of Family Structure:
Family structure is another significant demographic factor influencing buying behaviors. As shown in Table 5, the types of families respondents belong to are categorized as follows: The majority of respondents (73%) belong to nuclear families, which is a predominant family structure in urban and semi-urban areas. This suggests that individual consumption decisions are more likely to be made by a single household unit, rather than being influenced by a larger extended family. The relatively smaller proportions of respondents from joint (19.5%) and extended (7.5%) families may indicate differences in purchasing decisions based on the number of family members and the collective decision-making process in larger family structures.
| Types of family | Number of respondents | Percentage |
|---|---|---|
| Nuclear | 146 | 73 |
| Joint | 39 | 19.5 |
| Extended | 15 | 7.5 |
| Total | 200 | 100 |
Table text extracted from the original PDF; superscript letters are shown inline. The original table image is below.
View original table image
Purchase decision towards carbonate beverages
The purchase decision is a critical aspect of consumer behavior, as it reveals the factors that influence individual choices when buying carbonated beverages. As shown in Table 6, the distribution of purchase decision-making is as follows: The largest proportion of consumers (37%) make their purchase decisions independently, indicating a strong preference for individual choice when it comes to carbonated beverages. The second-largest group (30.5%) reports that their purchase decisions are influenced by friends, suggesting a social influence on consumption. A smaller proportion of respondents make decisions based on the influence of elders (12%) or collective family decisions (20.5%). These findings suggest that social networks, particularly friends, play a key role in shaping purchasing behavior in this market.
| Purchase decision | Number of respondents | Percentage |
|---|---|---|
| Own Accord | 74 | 37 |
| Friends | 61 | 30.5 |
| Elders | 24 | 12 |
| Collective Decision | 41 | 20.5 |
| Total | 200 | 100 |
Table text extracted from the original PDF; superscript letters are shown inline. The original table image is below.
View original table image
Consumer perception about carbonated beverages
Consumer perception plays a vital role in determining how often and in what context a product is consumed. Table 7 illustrates the frequency of carbonated beverage consumption among respondents: The majority of respondents (34.5%) consume carbonated beverages daily, indicating that these products are an integral part of their routine. A significant portion (26%) drinks them fort-nightly, suggesting that while consumption is frequent, it is not necessarily a daily habit for all consumers. Weekly and monthly consumption are lower (20% and 19.5%, respectively), indicating that some consumers only purchase or consume carbonated beverages on a less frequent basis. These patterns may reflect variations in lifestyle, preferences, and health consciousness among the respondents.
| Duration | Number of respondents | Percentage |
|---|---|---|
| Daily | 69 | 34.5 |
| Weekly | 40 | 20 |
| Fort-nightly | 52 | 26 |
| Monthly | 39 | 19.5 |
| Total | 200 | 100 |
Table text extracted from the original PDF; superscript letters are shown inline. The original table image is below.
View original table image
Preferred quantity for purchase of carbonated beverages
The preferred quantity of carbonated beverages for purchase is another important factor that influences consumer behavior. As presented in the following table, the distribution of preferred purchase quantities is as follows: The most preferred quantity is 200 ml (37%), which indicates a preference for smaller, more affordable packages. The 1 liter bottle is the second most preferred (23%), suggesting that consumers also opt for medium-sized packages. 100 ml (16%) and 500 ml (14.5%) are relatively less popular, indicating that small and large quantities are not as frequently purchased. The least favored option is the 1.5-liter bottle (9.5%), which may be seen as too large for individual or small household consumption. These preferences suggest that consumers are inclined to buy more convenient, smaller-sized packages that match their consumption patterns.
Point of purchase of carbonated beverages
The place where consumers purchase their carbonated beverages provides valuable insights into the distribution channels and convenience factors that influence buying behavior. As shown in the table below, the distribution of purchase locations is as follows: The majority of respondents (36.5%) purchase their carbonated beverages at grocery shops, which are easily accessible and likely offer competitive pricing. Pan shops are the second most common purchase point (24.5%), highlighting their role as convenient outlets for on-the-go consumers. Superstores (18.5%) are also a notable location for purchasing, suggesting that some consumers prefer shopping in larger retail outlets where they may have access to a wider range of products. Restaurants (6.5%) and bus stations/railway stations (14%) are less common purchase points, indicating that carbonated beverages are less frequently bought in these settings compared to retail stores. The findings suggest that traditional retail outlets like grocery shops and pan shops are the primary points of sale, with convenience playing a key role in consumer purchasing decisions. This reflects a preference for easy access and familiarity when purchasing carbonated beverages.
Factors influencing consumer preference towards carbonated beverages
Table 10 illustrates the ranking of reasons why consumers prefer carbonated drinks. The factors contributing to consumer preferences for carbonated beverages are ranked as follows: Taste is the most important factor driving the preference for carbonated beverages, as it is ranked 1st. This indicates that the flavor of the drink is the most significant determinant in the purchase decision, suggesting that consumers place a high value on the sensory experience associated with drinking carbonated beverages. Price ranks second (2 nd ), which suggests that consumers are also highly price-sensitive when purchasing carbonated beverages. This could reflect an affordability-driven decision, where consumers tend to select drinks that fit within their budget. Brand Image comes in third (3 rd ), indicating that while the reputation and recognition of a brand do matter, they are not as crucial as taste or price. Nevertheless, a strong brand image may still influence consumer loyalty and purchasing decisions, particularly for premium products. Availability is ranked fourth (4 th ), which highlights the importance of convenience and access when choosing a carbonated drink. If the drink is readily available in the local market or preferred stores, consumers are more likely to purchase it. Influence by friends or relatives ranks fifth (5 th ), suggesting that while social influence plays a role in purchasing decisions, it is not as significant as personal preferences for taste, price, or brand. These findings emphasize that taste and price are primary factors in the preference for carbonated beverages, while other factors like availability, brand image, and social influence play secondary roles.
| Parameters | Rank |
|---|---|
| Brand image | 3 |
| Availability | 4 |
| Influence by friend/relative | 5 |
| Price | 2 |
| Taste | 1 |
Table text extracted from the original PDF; superscript letters are shown inline. The original table image is below.
View original table image
Factors affecting consumer buying behavior towards carbonated beverages
Table 11 presents the rotated component matrix on the factors that affect consumer buying behavior in the context of carbonated beverages. This matrix ranks different variables in terms of their importance in shaping consumer decisions, as follows: Flavors are ranked first (1 st ), indicating that the variety and taste options offered by carbonated beverage brands are the most important factor in shaping consumer purchasing decisions. This reinforces the previous finding that taste plays a dominant role in consumer preference. Advertisement ranks second (2 nd ), highlighting the significant role that advertising campaigns and promotional efforts play in influencing consumer behavior. Effective advertising can help create brand awareness and attract consumers to try new or existing products.
| Factors | Rank |
|---|---|
| Advertisement | 2 |
| Brand ambassador | 8 |
| Brand image | 3 |
| Colour of the drink | 12 |
| Design of bottle | 9 |
| Packaging | 10 |
| Level of carbonation (Strength) | 7 |
| Status symbol | 11 |
| Tradition price | 4 |
| Availability | 5 |
| Flavors | 1 |
| Youthful | 6 |
Table text extracted from the original PDF; superscript letters are shown inline. The original table image is below.
View original table image
Brand Image ranks third (3 rd ), emphasizing that the reputation and perception of a brand influence purchasing decisions. A strong, trusted brand image can lead to customer loyalty, especially in a competitive market. Price is ranked fourth (4 th ), underlining the importance of cost-conscious decision-making in the buying process. While not the topmost factor, price remains a crucial determinant of purchase behavior, especially for middleincome consumers. Availability comes in fifth (5 th ), which again reflects the importance of convenience. Consumers tend to purchase carbonated beverages that are readily accessible at their preferred retail outlets. Youthful ranks sixth (6 th ), indicating that a product's appeal to younger consumers (Perhaps in terms of branding or image) is an important factor. Brands that market themselves as trendy, vibrant, or appealing to youth may have a competitive edge. Level of Carbonation (Strength) ranks seventh (7 th ), suggesting that the "fizziness" or carbonation level of a drink is a notable factor, but not as important as flavor or brand image. Some consumers may prefer stronger or lighter carbonation, influencing their choice of beverage. Brand Ambassador ranks eighth (8 th ), meaning that celebrity endorsements or well-known personalities representing a brand have some influence on consumer decisions, but this is not as crucial as the other factors above. Design of Bottle and Packaging are ranked ninth (9 th ) and tenth (10 th ), respectively. These elements may play a role in attracting attention or providing a certain aesthetic appeal but are secondary to functional factors like price, flavor, and availability. Status Symbol and Colour of the Drinkare ranked lowest (11 th and 12 th , respectively), suggesting that factors like the drink's perceived status or its color are less influential in driving consumer purchasing behavior. While branding might create a certain image or appeal, these factors are not as significant as more tangible attributes like taste and price. These rankings provide a comprehensive view of the various psychological, social, and practical factors that guide consumer behavior. While sensory factors such as flavor and carbonation strength are most important, advertising, brand image, and price also play significant roles. Youthful appeal, availability, and the presence of brand ambassadors further enhance consumer preferences, but more tangible aspects such as packaging and status symbolism are of lesser importance.
Conclusion
This study on consumer buying behaviors toward carbonated beverages in Navsari district highlights key factors influencing consumer preferences and purchasing decisions. The research reveals that taste and price are the most important drivers of consumer choice, followed by brand image and availability. Consumers, particularly in the 16-35 age group and middle-income households, tend to prioritize affordability and flavor variety. Social influences, such as recommendations from friends or family, play a secondary role in purchasing decisions. The most preferred package sizes are 200 ml and 1 liter, indicating a demand for both individual servings and household-friendly quantities. Consumers typically purchase carbonated beverages from grocery shops and pan shops, underscoring the importance of convenience and accessibility.
For businesses in the beverage industry, the findings suggest that marketing strategies should focus on offering a variety of flavors at competitive prices, alongside strong advertising and building a brand image. Ensuring widespread availability at local retail points like grocery shops is crucial for maintaining consumer convenience. While packaging and product design are secondary considerations, they can still differentiate a brand in the competitive market. By aligning their product offerings with consumer preferences for taste, price, and convenience, beverage companies can enhance customer satisfaction, foster loyalty, and effectively tap into the growing demand for carbonated drinks in the region.
Figures and tables from the paper
| Age group | Number of respondents | Percentage |
|---|---|---|
| 16 to 25 | 73 | 36.5 |
| 26 to 35 | 82 | 41 |
| 36 to 45 | 24 | 12 |
| 46 or more | 21 | 10.5 |
| Total | 200 | 100 |
Table text extracted from the original PDF; superscript letters are shown inline. The original table image is below.
View original table image
| Gender | Number of respondents | Percentage |
|---|---|---|
| Male | 122 | 61 |
| Female | 78 | 39 |
| Total | 200 | 100 |
Table text extracted from the original PDF; superscript letters are shown inline. The original table image is below.
View original table image
| Quantity | Number of respondents | Percentage |
|---|---|---|
| 100 ml | 32 | 16 |
| 200 ml, | 74 | 37 |
| 500 ml | 29 | 14.5 |
| 1 litre | 46 | 23 |
| 1.5 litre | 19 | 9.5 |
| Total | 200 | 100 |
Table text extracted from the original PDF; superscript letters are shown inline. The original table image is below.
View original table image
| Point of purchase | Number of respondents | Percentage |
|---|---|---|
| Grocery shop | 73 | 36.5 |
| Pan shop | 49 | 24.5 |
| Super store | 37 | 18.5 |
| Restaurant | 13 | 6.5 |
| Bus station/Railway station | 28 | 14 |
| Total | 200 | 100 |
Table text extracted from the original PDF; superscript letters are shown inline. The original table image is below.
View original table image
References
6 in the original paper- Grier SA, Kumanyika SK. The context for choice: health implications of targeted food and beverage marketing to African Americans. Am J Public Health. 2008;98(9):1616-1629.
- Kuncoro HADP, Kusumawati N. A study of customer preference, customer perceived value, sales promotion, and social media marketing towards purchase decision of sleeping product in Generation Z. Adv Int J Bus Entrepren SMEs. 2021;3(9):265-276.
- Nagina R, Kaur J, Qazi S, Bhalla P, Alam M. Exploring consumer perception and preference factors influencing carbonated beverage purchase decisions: A comprehensive study. J Infrastruct Policy Dev. 2024;8(5):4852.
- Navyasree P, Mahera AB, Prajapati MR. Factors influencing the buying pattern of selected carbonated dairy drink by the consumers in Anand City, Gujarat. Asian J Agric Ext Econ Soc. 2022;40(12):93-99.
- Statista. Soft drinks: Market data & analysis [Internet]. 2024 [cited 2025 Jan 16]. Available from: https://www.statista.com
- Sharif S, Rehman SU, Ahmad Z, et al. Consumer quality management for beverage food products: analyzing consumers' perceptions toward repurchase intention. The TQM J. 2023;36(2):431-459.