
Research article · 2024 · Full text
International Journal of Biology SciencesColor vision deficits in ADHD
Volume 6(2) · Pages 112–115 · DOI: 10.33545/26649926.2024.v6.i2b.242 ↗
Research areasColor perception and design
Abstract
Author-writtenBackground: This study investigates the prevalence and nature of colour vision deficiency in subjects with ADHD. With previous research hints at a potential association between altered colour perception and ADHD, comprehensive studies with detailed methodologies and robust statistical analyses are rare. Methodology: 200 subjects are included in the study. 100 subjects are included who are diagnosed with ADHD and another 100 are included with age and gender matched controls without ADHD. Colour vision was evaluated using Ishihara charts and Farnsworth Munsell 100 Hue Test. For statistical analysis, tests like logistic regression tests, t tests and chi square tests were used to evaluate and compare the outcomes of colour vision between ADHD and control groups. Results: The study found that 30% of ADHD had colour vision defect compared to 10% in control group (χ² = 12.00, p
Summary
Source-checkedPlain-language reading of the full paper, prepared with AI and checked against the text. Each point links to the authors' own words.
Why it matters
- Attention Deficit Hyperactivity Disorder (ADHD) is a neurodevelopmental disorder marked by impulsivity, hyperactivity, and persistent attention issues that disrupt daily functioning. View evidence ↗
- Recent information suggests a potential connection between ADHD and sensory processing anomalies, including abnormalities in color vision. View evidence ↗
- Color vision anomalies in ADHD are often under-recognized, which may worsen the academic, social, and occupational challenges faced by these individuals. View evidence ↗
The question
- The study aimed to analyze the prevalence and characteristics of color vision anomalies in individuals with ADHD compared to a matched control group. View evidence ↗
- The researchers sought to determine the extent of color perception anomalies and whether they correlate with the severity of ADHD symptoms. View evidence ↗
What they did
- Color vision was evaluated using two standardized tools: the Ishihara color vision test and the Farnsworth Munsell 100 Hue Test. View evidence ↗
- The research was conducted between August 2022 and April 2024 at various clinics in Gujarat. View evidence ↗
- Statistical analysis involved chi-square tests for deficiency ratios, independent t-tests for confusion index scores, and logistic regression to determine if ADHD predicted color vision deficits. View evidence ↗
What they found
- Color vision defects were significantly more common in the ADHD group (30%) than in the control group (10%). View evidence ↗
- Red-green color vision deficiency was more prevalent in the ADHD group (70%) compared to the control group (40%). View evidence ↗
- The ADHD group had significantly higher color confusion scores (mean 80.5, SD 12.3) than the control group (mean 62.8, SD 8.9), indicating greater difficulty perceiving subtle hue changes. View evidence ↗
- Logistic regression showed that an ADHD diagnosis is a strong predictor of color vision deficiency, with an odds ratio of 3.67. View evidence ↗
- A moderate positive correlation (r = 0.35) was found between the severity of ADHD symptoms and the degree of color vision deficiency. View evidence ↗
What it means
- The authors conclude that color vision assessments should be included in the clinical evaluation of individuals with ADHD. View evidence ↗
- The study's cross-sectional design prevents the establishment of causal relationships and relies on standardized clinical criteria for diagnosis. View evidence ↗
Visual summary
2 visualsIllustrations explain the paper; charts are replotted from the paper's own table values.
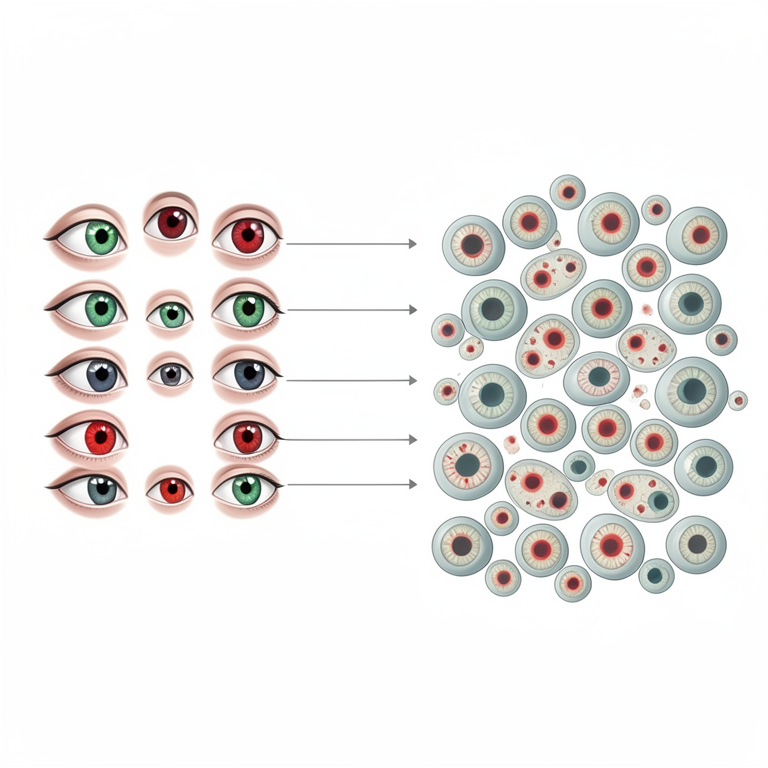
Prevalence Comparison
AI-generated conceptual illustration (human eyes and retinal cones). It explains the idea and does not show study data.
View source evidence ↗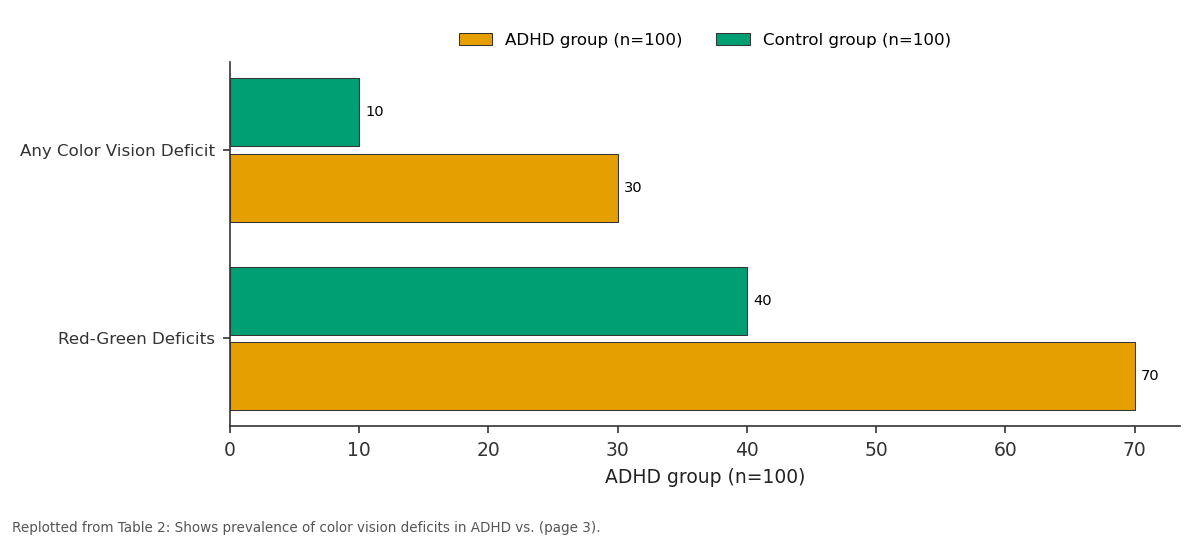
ADHD group (n=100) and Control group (n=100): Any Color Vision Deficit vs Red-Green Deficits
Replotted from Table 2 (page 3) of the original paper. Every bar is the paper's own table value.
View source evidence ↗Figures & tables
From the original paper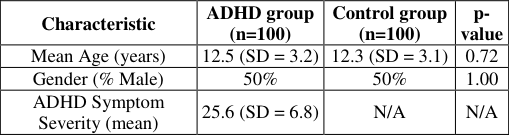 Table 1
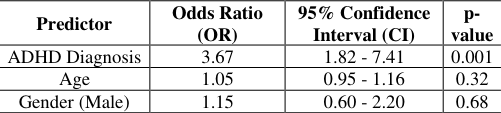 Table 4
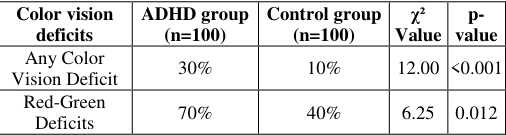 Table 2
 Table 5
 Table 3
 Table 6
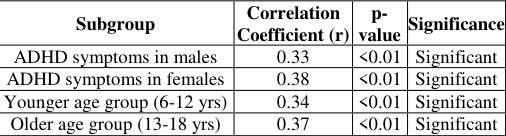 Table 7
Introduction
Attention Deficit Hyperactivity Disorder is a neuro developmental disorder which is characterized by hyperactivity, impulsivity, persistent attention, which interrupts the daily functions in various fields. Traditionally it is connected with executive function and attention control. Emergent information shows that there is a possible link between sensory processing anomalies and ADHD which also includes colour vision abnormalities. It is important to understand the relationship as it may discover additional demands faced by subjects with ADHD and improve our approach for further diagnosis and man agent. Despite anecdotic reports of colour vision anomalies in subjects with ADHD, there is need of extensive research which diagnoses the prevalence and nature of these deficiencies in the population. Literature gap shows that colour vision anomalies remain under recognized, possibly intensifying difficulties like academics, social and occupational with ADHD subjects. Addressing this gap is important for complete perception and its management. The objective of this study is to consistently analyse the ratio and characteristics of colour vision anomalies in subjects with ADHD which is compared to age and gender matched control group. Generally, the purpose is to determine the degree of colour perception anomalies and investigate their possible correlation with the severity of symptoms of ADHD. The importance of this research lies in its potency to impact routine clinical practise by highlighting the need to include assessment of colour vision in the evaluation of ADHD. It would improve accuracy and it may lead to more customized management. Its findings help to contribute to a deeper understanding of sensory processing issues in ADHD. It ultimately enhances management scheme for the disorder.
The study focusses on a characterized group of individuals with ADHD and control group using standard colour vision procedures and its statistical analyses. This study includes some limitations using sample size and the scope of assessments of sensory processing. The main aim of the study is to determine and characterise colour vision anomalies in ADHD. It investigates the prevalence and its correlation with symptoms of ADHD to modify more extensive diagnosis and its management.
Methodology
This study engaged a cross-sectional design to investigate to colour vision anomalies in subjects with ADHD compared to control group with age and gender matched controls. This study was conducted from August 2022 to April 2024 from various clinics of Gujarat. Sample includes 100 children and adults who are diagnosed with ADHD with the age group of 6 to 18 years and 100 children from control group from local schools and in clinical settings. Diagnosis of ADHD is confirmed using the DSM -5 criteria through evaluation by qualified optometrists. To assure the study focussed specifically on ADHD related colour vision deficiencies, subjects with known visual anomalies or neurological conditions other than ADHD were excluded. Colour vision was assessed using 2 standardized tests -Ishihara colour vision test and Farnsworth Munsell 100 Hue Test. Ishihara colour vision tests involve a series of plates with coloured dots, where subjects have to identify number or shapes embedded within the dots by assessing red green colour discrimination. Farnsworth Munsell 100 Hue Test requires subjects to arrange coloured plates in order of hue, which measures the ability to discriminate subtle differences in colour. Data was collected face to face at selected testing locations within a period of 3 months. Statistical analysis was performed using SPSS software. Chi square tests were used to analyse differences in the ratio of colour vision deficiency between ADHD and control groups. This test was chosen for its ability to examine categorical data and influence categorical data and to determine important associations between status of ADHD and colour vision deficiency. Independent t tests were used to compare continues measures, such as Farnsworth Munsell colour confusion index scores, between the two groups by assessing difference of mean score. Logistic regression analysis tests were engaged to evaluate whether ADHD diagnosis was an important predictor of colour vision deficiencies who control for possible confounding variables like age and gender. Factor analysis was conducted to examine the fundamental relationships between symptoms of ADHD and colour vision deficiencies, significate dimensions that explain the observed correlations. Ethical approval was taken from Shree Satchandi Janakalyan Samiti. Informed consent was obtained from all subjects and their legal guardians before involving in the study. The study corresponds to ethical guidelines to ensure confidentiality of the subjects.
Results
The study sample comprised of 200 subjects, consistently divided between 100 entities identified with ADHD and 100 age-and sex-matched controls. The demographic and clinical features were similar between groups, with the ADHD group display a mean age of 12.5 years (SD = 3.2) and a balanced gender dispersal (50% male, 50% female).
ADHD indication severity, measured using consistent rating scales, mixed within the ADHD group, providing a foundation for correlation analyses.
The key outcome exposed that 30% of entities with ADHD showed colour vision discrepancies, compared to 10% in the control group. This alteration was statistically significant, as shown by the chi-square test (χ² = 12.00, p < 0.001), representing a higher incidence of colour vision impairments in the ADHD group. Precisely, within the ADHD group, 70% of subjects displayed impaired red-green insight on the Ishihara test, associated to 40% in the control group (χ² = 6.25, p = 0.012). This finding emphasizes a noteworthy challenge in red-green colour discernment related with ADHD. Subordinate consequence examination using the Farnsworth-Munsell 100 Hue Test providing supplementary understandings into colour discernment capabilities. The ADHD group had suggestively higher colour confusion index scores (mean = 80.5, SD = 12.3) compared to controls (mean = 62.8, SD = 8.9), as determined by a selfdetermining samples t-test (t = 4.25, p < 0.001). This result proposes that entities with ADHD have better difficulty perceptive understated alterations in colour hue, reflecting more comprehensive colour perception tests. To additional discover the association between ADHD and colour vision deficits, a logistic regression analysis was performed. The analysis adjusted for potential perplexing factors such as age and gender and established that an ADHD analysis was a strong prophet of colour vision deficits. The odds relation was 3.67 (95% CI [1.82, 7.41], p = 0.001), illustrative that with ADHD were over three times more likely to involvement colour vision improvements than their non-ADHD. The internal statistical correlations were scrutinized in greater detail through Pearson correlation analysis, concentrating on the relationship between ADHD symptom severity and colour vision impairment. The consequences showing a rational confident correlation (r = 0.35, p < 0.01), suggesting that advanced ADHD symptom severity is associated with greater difficulties in colour perception. This suggestion was particularly perceptible in red-green discrimination, where a higher symptom severity score related with higher error rates on the Ishihara test. Additionally, an influence investigation was showed to distinguish essential influences that might explain the experimental alterations in colour vision demonstration among subjects. The investigation uncovered 2 main factors: one related with general colour discrimination ability, as evaluated by the Farnsworth-Munsell test, and another detailed to red-green discrimination, as measured by the Ishihara test. These influences described for a notable portion of the modification in colour vision results, importance dissimilar extents of colour insight that may be differentially squeezed by ADHD.
Discussion
The goal of this study is to understand the findings of the study which relates to the existing literature and investigates their comprehensive implications, while declaring limitations and suggesting directions for further research. These results demonstrate an important association between colour vision deficiency and ADHD, particularly in red green colour vision deficiency which has important need for the diagnosis and management of ADHD. Findings suggest that sensory process difference like colour vision impairment could be important to understand the full array of symptoms of ADHD, which leads to more extensive diagnostic protocols. When this study is compared with the previous studies, this research influence and extend existent knowledge by substantiating that subjects with ADHD are more likely to undergo colour vision deficiencies. The observed organization between ADHD and colour vision deficiencies may be rooted in shared neurobiological pathway that affect basic cognitive process and sensory processing. These findings lead to more personalized treatment. In addition, the implication of this study extends to educational and occupational settings.
There are several limitations to this study. Its cross-sectional design prevents causal implications and it is dependent on standardized clinical criteria for ADHD diagnosis. Longitudinal studies should be done to know more development aspects of sensory processing anomalies and more diverse population should be considered.
Conclusion
To conclude this study, it demonstrates high prevalence rates of colour vision deficiency mainly problems are faced in red green discrimination in subjects with ADHD as compared to controls. These findings show the need of assessment of sensory processing in the clinical examination of ADHD.
Figures and tables from the paper
| Characteristic | ADHD group (n=100) | Control group (n=100) | p- value |
|---|---|---|---|
| Mean Age (years) | 12.5 (SD = 3.2) | 12.3 (SD = 3.1) | 0.72 |
| Gender (% Male) | 50% | 50% | 1.00 |
| ADHD Symptom Severity (mean) | 25.6 (SD = 6.8) | N/A | N/A |
Table text extracted from the original PDF; superscript letters are shown inline. The original table image is below.
View original table image
| Predictor | Odds Ratio (OR) | 95% Confidence Interval (CI) | p- value |
|---|---|---|---|
| ADHD Diagnosis | 3.67 | 1.82 - 7.41 | 0.001 |
| Age | 1.05 | 0.95 - 1.16 | 0.32 |
| Gender (Male) | 1.15 | 0.60 - 2.20 | 0.68 |
Table text extracted from the original PDF; superscript letters are shown inline. The original table image is below.
View original table image
| Color vision deficits | ADHD group (n=100) | Control group (n=100) | χ² Value | p- value |
|---|---|---|---|---|
| Any Color Vision Deficit | 30% | 10% | 12.00 | <0.001 |
| Red-Green Deficits | 70% | 40% | 6.25 | 0.012 |
Table text extracted from the original PDF; superscript letters are shown inline. The original table image is below.
View original table image
| Factor | Eigenvalue | Variance explained (%) | Associated tests |
|---|---|---|---|
| Factor 1: General color discrimination | 2.75 | 45.8 | Farnsworth-munsell 100 hue test |
| Factor 2: Red-green discrimination | 1.50 | 25.0 | Ishihara Test |
Table text extracted from the original PDF; superscript letters are shown inline. The original table image is below.
View original table image
| Subgroup | Correlation Coefficient (r) | p- value | Significance |
|---|---|---|---|
| ADHD symptoms in males | 0.33 | <0.01 | Significant |
| ADHD symptoms in females | 0.38 | <0.01 | Significant |
| Younger age group (6-12 yrs) | 0.34 | <0.01 | Significant |
| Older age group (13-18 yrs) | 0.37 | <0.01 | Significant |
Table text extracted from the original PDF; superscript letters are shown inline. The original table image is below.
View original table image
References
23 in the original paper- Biederman J, Mick E, Faraone SV. Age-dependent decline of symptoms of attention deficit hyperactivity disorder: impact of remission definition and symptom type. Am J Psychiatry. 2000;157(5):816-818.
- Chouinard VA, Marusak HA, Dennison MJ, Walker OL, Thomason ME. Age-related effects of pubertal status on the neural correlates of emotion regulation. Dev Cogn Neurosci. 2018;30:91-98.
- De Crescenzo F, Licchelli S, Ciabattini M, Menghini D, Armando M, Alfieri P, et al. The use of actigraphy in the monitoring of methylphenidate versus placebo in ADHD: a meta-analysis. Atten Defic Hyperact Disord. 2016;8(3):163-173.
- DuPaul GJ, Gormley MJ, Laracy SD. Comorbidity of LD and ADHD: implications of DSM-5 for assessment and treatment. J Learn Disabil. 2012;45(3):192-202.
- Faraone SV, Biederman J, Mick E. The age-dependent decline of attention deficit hyperactivity disorder: a meta-analysis of follow-up studies. Psychol Med. 2006;36(2):159-165.
- Frazier TW, Demaree HA, Youngstrom EA. Metaanalysis of intellectual and neuropsychological test performance in attention-deficit/hyperactivity disorder. Neuropsychology. 2004;18(3):543-555.
- Ghanizadeh A, Jafari P. Cultural structures of the DSMIV ADHD and the effects of the prevalence rates of ADHD and ODD on the diagnostic criteria. J Atten Disord. 2010;14(3):266-272.
- Hartman CA, Hox J, Mellenbergh GJ, Boyle MH, Offord DR, Racine Y, et al. DSM-IV internal construct validity: when a taxonomy meets data. J Child Psychol Psychiatry. 2001;42(6):817-836.
- Jensen PS, Hinshaw SP, Kraemer HC, Lenora N, Newcorn JH, Abikoff HB, et al. ADHD comorbidity findings from the MTA study: comparing comorbid subgroups. J Am Acad Child Adolesc Psychiatry. 2001;40(2):147-158.
- Kieling C, Rohde LA. ADHD in children and adults: diagnosis and prognosis. Curr Opin Psychiatry. 2012;25(5):395-400.
- Lahey BB, Applegate B, McBurnett K, Biederman J, Greenhill L, Hynd GW, et al. DSM-IV field trials for attention deficit hyperactivity disorder in children and adolescents. Am J Psychiatry. 1994;151(11):1673-1685.
- Loe IM, Feldman HM. Academic and educational outcomes of children with ADHD. Ambul Pediatr. 2007;7(1 Suppl):82-90.
- Molina BS, Hinshaw SP, Swanson JM, Arnold LE, Vitiello B, Jensen PS, et al. The MTA at 8 years: prospective follow-up of children treated for combinedtype ADHD in a multisite study. J Am Acad Child Adolesc Psychiatry. 2009;48(5):484-500.
- Mowlem FD, Skirrow C, Reid P, Maltezos S, Nijati V, Selzam S, et al. Validation of the Mindful Attention Awareness Scale in adolescents with ADHD. Assessment. 2019;26(1):3-12.
- Nigg JT, Blaskey LG, Stawicki JA, Sachek J. Evaluating the endophenotype model of ADHD neuropsychological deficit: results for parents and siblings of children with ADHD combined and inattentive subtypes. J Abnorm Psychol. 2004;113(4):614-625.
- Pelham WE, Foster EM, Robb JA. The economic impact of attention-deficit/hyperactivity disorder in children and adolescents. J Pediatr Psychol. 2007;32(6):711-727.
- Ramos-Quiroga JA, Montoya A, Kutzelnigg A, Deberdt W, Sobanski E. Attention deficit hyperactivity disorder in the European adult population: prevalence, disease awareness, and treatment guidelines. Curr Med Res Opin. 2013;29(9):1093-1104.
- Shaw P, Stringaris A, Nigg J, Leibenluft E. Emotion dysregulation in attention deficit hyperactivity disorder. Am J Psychiatry. 2014;171(3):276-293.
- Spencer TJ, Biederman J, Mick E. Attentiondeficit/hyperactivity disorder: diagnosis, lifespan, comorbidities, and neurobiology. J Pediatr Psychol. 2007;32(6):631-642.
- Swanson JM, Kraemer HC, Hinshaw SP, Arnold LE, Conners CK, Abikoff HB, et al. Clinical relevance of the primary findings of the MTA: success rates based on severity of ADHD and ODD symptoms at the end of treatment. J Am Acad Child Adolesc Psychiatry. 2001;40(2):168-179.
- Thapar A, Cooper M, Eyre O, Langley K. Practitioner review: what have we learnt about the causes of ADHD? J Child Psychol Psychiatry. 2013;54(1):3-16.
- Visser SN, Danielson ML, Bitsko RH, Holbrook JR, Kogan MD, Ghandour RM, et al. Trends in the parentreport of healthcare provider-diagnosed and medicated attention-deficit/hyperactivity disorder: United States, 2003-2011. J Am Acad Child Adolesc Psychiatry. 2014;53(1):34-46.
- Willcutt EG. The prevalence of DSM-IV attentiondeficit/hyperactivity disorder: a meta-analytic review. Neurotherapeutics. 2012;9(3):490-499.
Cited by 5
From OpenAlex, OpenCitations and reference lists read by Scinovex
- Biochemical correlates of dopaminergic pathway dysfunction and color vision deficits in children with attention deficit hyperactivity disorder
Emily Rose Morrison, Liam Patrick Campbell · International Journal of Advanced Biochemistry Research · 2026
The dopaminergic system has long been implicated in the pathophysiology of attention deficit hyperactivity disorder, yet relatively few investigations have examined whether the same biochemical disturbances that underlie attentional symptoms might also contribute to the visual processing deficits increasingly reported in this population. This cross-sectional laboratory research investigated the relationship between urinary dopamine metabolites—specifically homovanillic acid (HVA) and vanillylmandelic acid (VMA)—and color vision performance in children diagnosed with ADHD. A total of 124 childr
- Nursing assessment of sensory and visual impairments in pediatric ADHD Patients: Clinical implications for evidence-based care planning ↗
Sophie Bridget Williams, Oliver Kenneth Davies, Charlotte Louise Roberts · International Journal of Advance Research in Nursing · 2026
Children with ADHD are rarely screened for visual processing difficulties during routine nursing assessments, despite mounting evidence that these impairments affect a significant proportion of the ADHD population. This cross-sectional research investigated the prevalence of sensory and visual impairments among pediatric ADHD patients attending outpatient clinics and examined the implications for nursing care planning. A total of 145 children aged
- Color vision deficiency as a diagnostic indicator in ADHD: Clinical prevalence, pathophysiology and therapeutic considerations ↗
Jorge Andres Navarro, Isabel Lucia Moreno · International Journal of Medicine Sciences · 2025
Color vision deficiency, defined as a reduced ability to perceive differences between certain colors that are distinguishable to individuals with normal trichromatic vision, has emerged as a clinically relevant finding in children diagnosed with attention deficit hyperactivity disorder. This research investigated the prevalence and typology of color vision deficits across ADHD subtypes, examined the pathophysiological mechanisms linking dopaminergic dysfunction to
- Homeopathic management of attention and sensory processing disorders in ADHD children: A review with focus on visual symptomatology ↗
Klaus Bernd Hoffmann, Monika Kirsten Schreiber · Journal of Homeopathy Studies · 2025
Roughly 11.4% of families managing a child's ADHD diagnosis turn to some form of complementary or alternative therapy at least once during the treatment course, and homeopathy ranks among the most frequently chosen modalities in Central Europe. Despite this uptake, systematic reviews addressing the role of homeopathic intervention in ADHD-related sensory processing and visual symptomatology remain scarce. This narrative review
- Neuroinflammatory markers and their association with visual processing deficits in children diagnosed with attention deficit hyperactivity disorder ↗
Jennifer Lynn Holloway, Marcus Boyd Thompson, Stephanie Nicole Collins · International journal of immunology sciences. · 2025
Can low-grade neuroinflammation shape how children with Attention Deficit Hyperactivity Disorder (ADHD) see the world? While ADHD is commonly framed as a disorder of executive function and behavioral regulation, growing evidence points to immune-mediated mechanisms that may extend well beyond attention and impulse control. Visual processing deficits, including impaired contrast sensitivity and color discrimination, have been documented in pediatric ADHD