
Research article · 2024 · Full text
International Journal of Horticulture and Food ScienceEffect of calcium chloride on physical properties and shelf life of grapes (Vitis Vinifera)
Volume 6(2) · Pages 31–36 · DOI: 10.33545/26631067.2024.v6.i2a.226 ↗
Research areasHorticultural and Viticultural ResearchFermentation and Sensory AnalysisPlant Physiology and Cultivation Studies
Abstract
Author-writtenThe current study evaluated at how calcium chloride and storage conditions affect grape postharvest quality. The study was conducted using a Completely Randomized Design (CRD) with nine treatments and three replications. All treatments were evaluated in terms of grape physical and shelf-life qualities. The study found that 2% CaCl2 in a cool bot held at 85±5% RH and 8±1 °C temperature greatly affects grape shelf-life. On the 24th day of storage, the least physiological weight loss (3.34%), fruit length (17.34 mm), fruit diameter (16.62), and firmness (0.70 kg/cm2) were seen in 2% CaCl2 in a cool bot, which indicated a significant difference, followed by 4% CaCl2. Grapes stored at ambient conditions, treated or untreated, were only barely affected by all treatments, leading in gradual deterioration and weight loss, followed by zero energy. Thus, the study\\\\\\\\\\\\\\\'s findings indicated that 2% CaCl2 might be an edible salt for minimizing grape postharvest losses in a cool bot.
Summary
Source-checkedPlain-language reading of the full paper, prepared with AI and checked against the text. Each point links to the authors' own words.
Why it matters
- Grapes are non-climacteric fruits, meaning they do not produce significant ethylene, but they are prone to postharvest losses if not handled correctly. View evidence ↗
- Calcium chloride is used as a safe, cost-effective edible salt coating to reduce moisture loss and bacterial growth, thereby extending the shelf life of grapes. View evidence ↗
The question
- The study aimed to evaluate how different concentrations of calcium chloride and various storage conditions impact the postharvest quality of grapes. View evidence ↗
What they did
- The researchers used a Completely Randomized Design (CRD) consisting of nine different treatments, each with three replications. View evidence ↗
- Grapes were treated by dipping them in either a 2% calcium chloride solution, a 4% calcium chloride solution, or water only (control). View evidence ↗
- The study tested three storage environments: ambient conditions, a 'cool bot', and 'zero energy' storage. View evidence ↗
- Storage conditions varied: ambient (26.5–29 °C, 66% RH), cool bot (6.8–9.5 °C, 87% RH), and zero energy (20.7–22.9 °C, 97% RH). View evidence ↗
What they found
- By day 24, grapes treated with 2% calcium chloride in a cool bot showed the lowest weight loss (3.34%), a length of 17.34 mm, a diameter of 16.81 mm, and a firmness of 0.70 kg/cm². View evidence ↗
- Spoilage was lowest for 2% calcium chloride in a cool bot (0.97% on day 16 and 2.44% on day 24) compared to the control in zero energy storage (8.0% on day 16 and 8.05% on day 24). View evidence ↗
- The 2% calcium chloride treatment in a cool bot maintained the highest fruit volume across all observations, measuring 59.33, 58.67, and 58.17 ml. View evidence ↗
- The longest average shelf life was 24 days for 2% calcium chloride in a cool bot, while the shortest was 7 days for the control group in ambient conditions. View evidence ↗
What it means
- The authors conclude that treating grapes with 2% calcium chloride and storing them in a cool bot is the most effective method for maintaining health and extending shelf life to 24 days. View evidence ↗
- The study recommends 2% calcium chloride as a suitable edible salt to minimize postharvest losses when used in conjunction with cool bot storage. View evidence ↗
Visual summary
3 visualsIllustrations explain the paper; charts are replotted from the paper's own table values.
Experimental Matrix
AI-generated conceptual illustration (grapes (Vitis Vinifera)). It explains the idea and does not show study data.
View source evidence ↗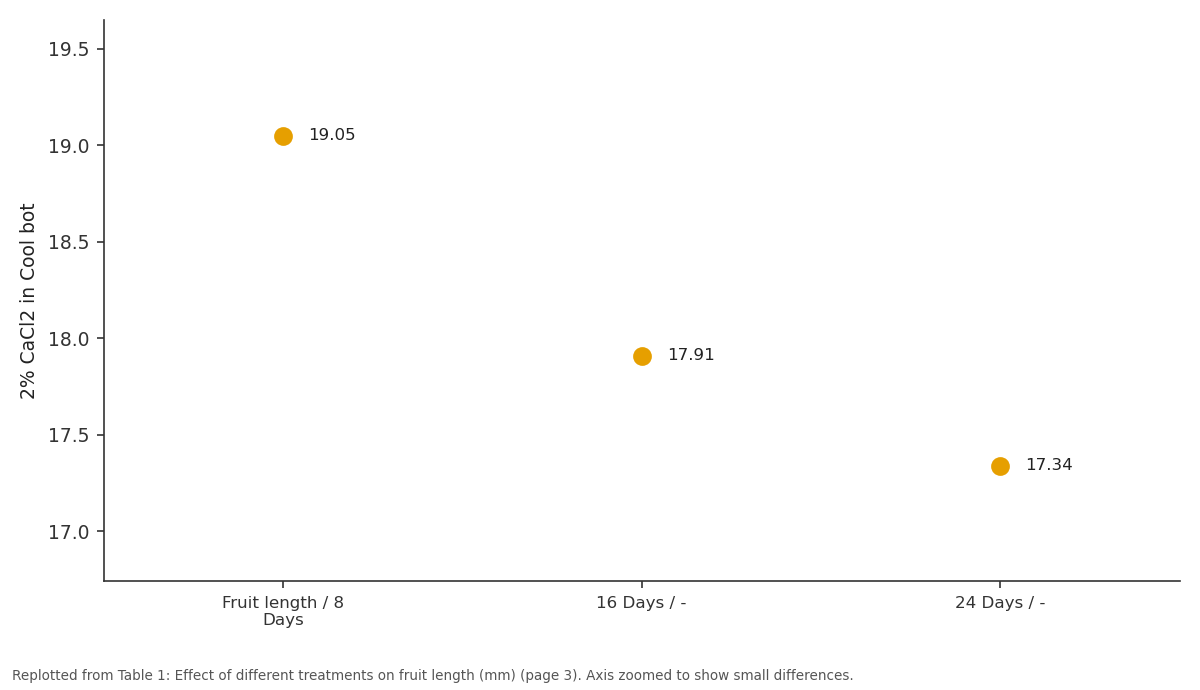
2% CaCl2 in Cool bot: Fruit length / 8 Days vs 16 Days / - vs 24 Days / -
Replotted from Table 1 (page 3) of the original paper. Every bar is the paper's own table value.
View source evidence ↗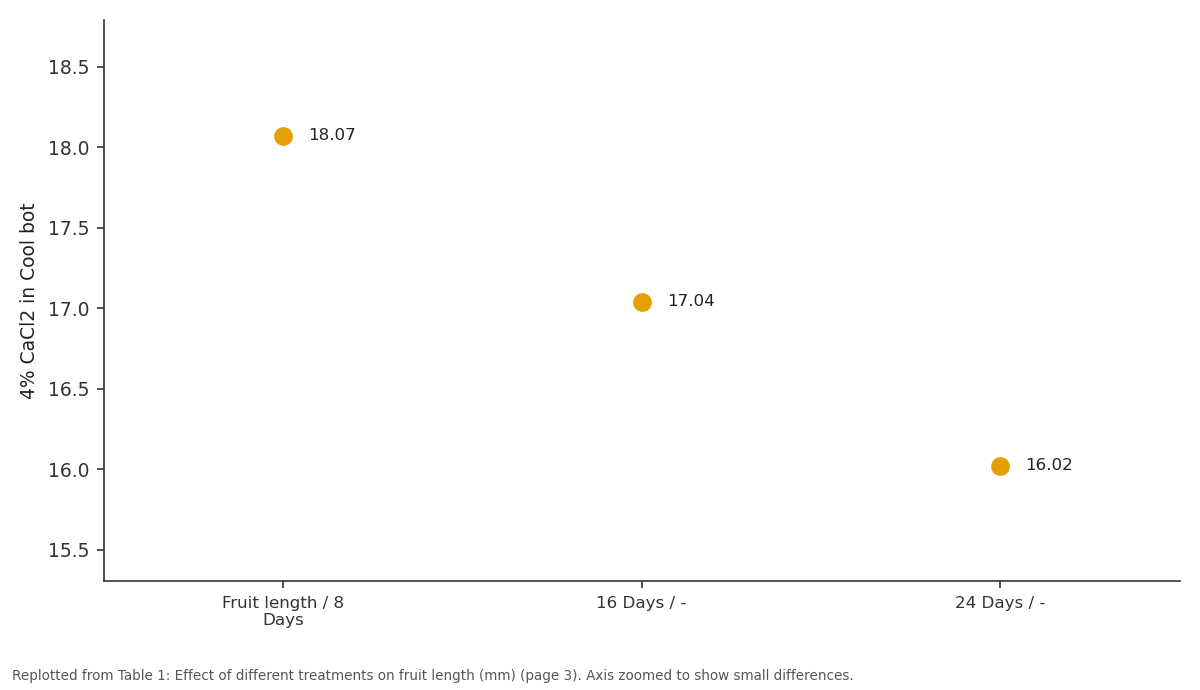
4% CaCl2 in Cool bot: Fruit length / 8 Days vs 16 Days / - vs 24 Days / -
Replotted from Table 1 (page 3) of the original paper. Every bar is the paper's own table value.
View source evidence ↗Figures & tables
From the original paper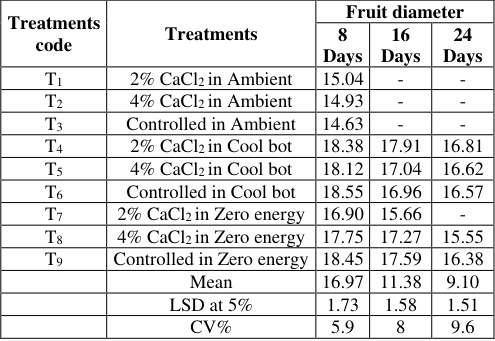 Table 2
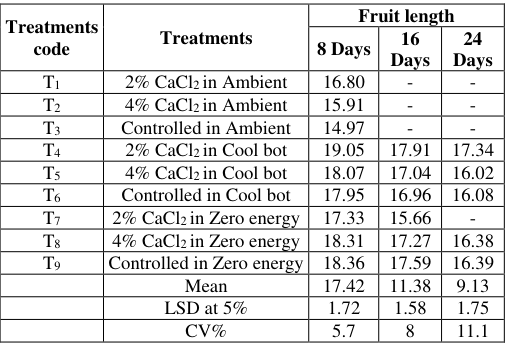 Table 1
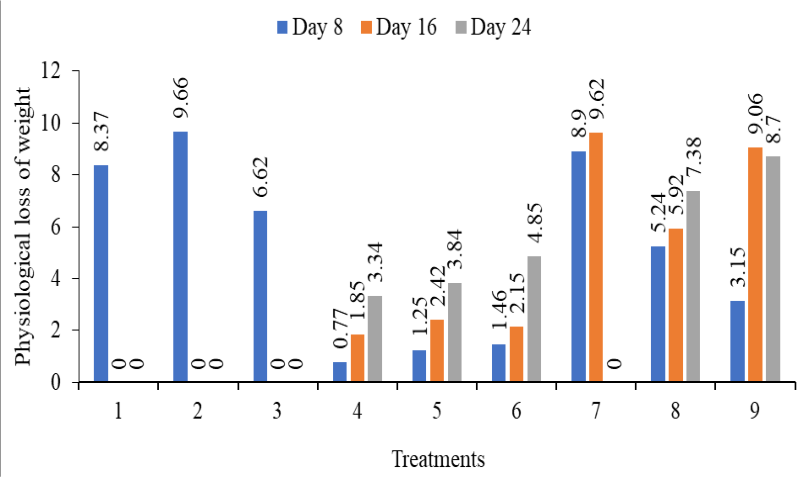 Figure 1
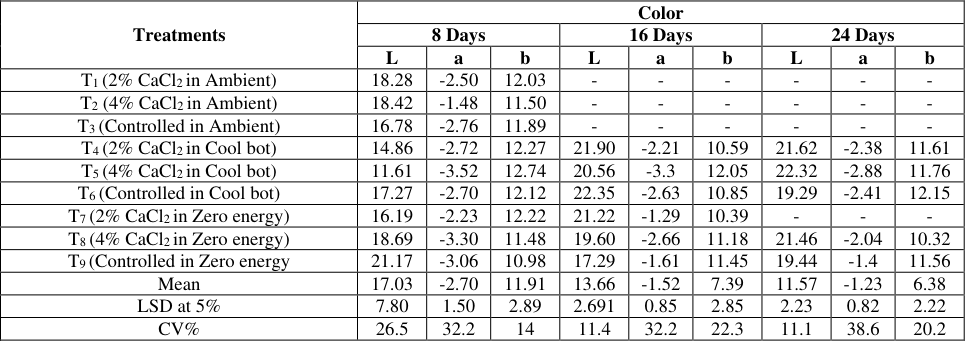 Table 3
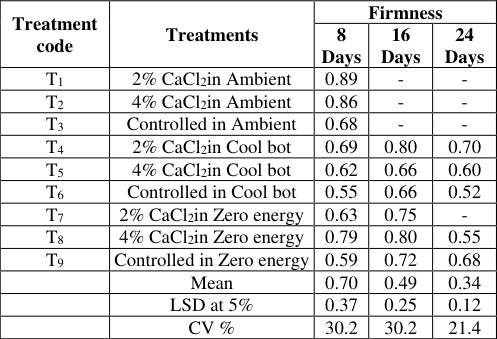 Table 5
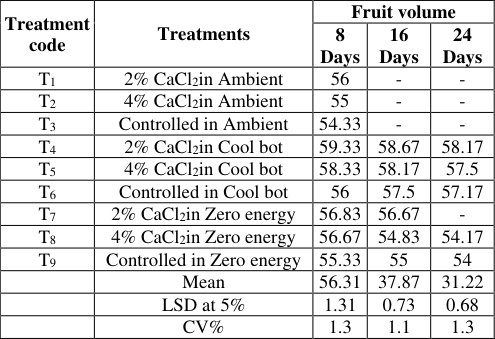 Table 4
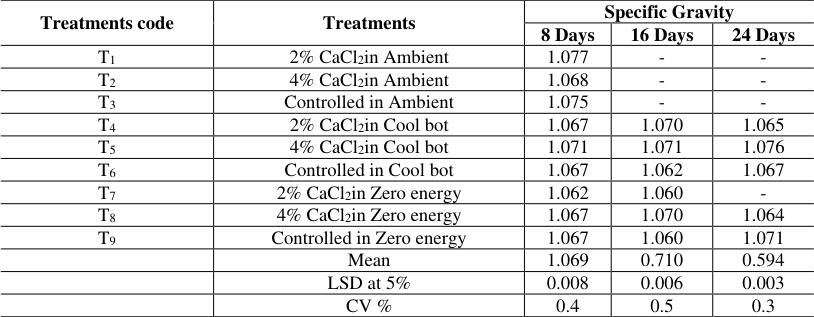 Table 6
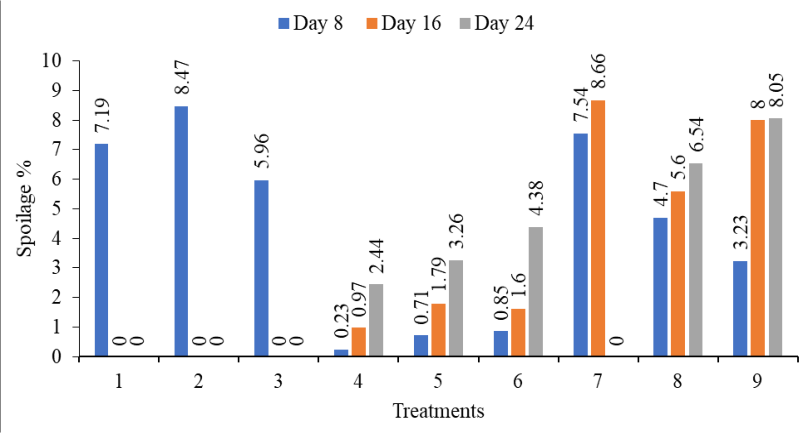 Figure 2
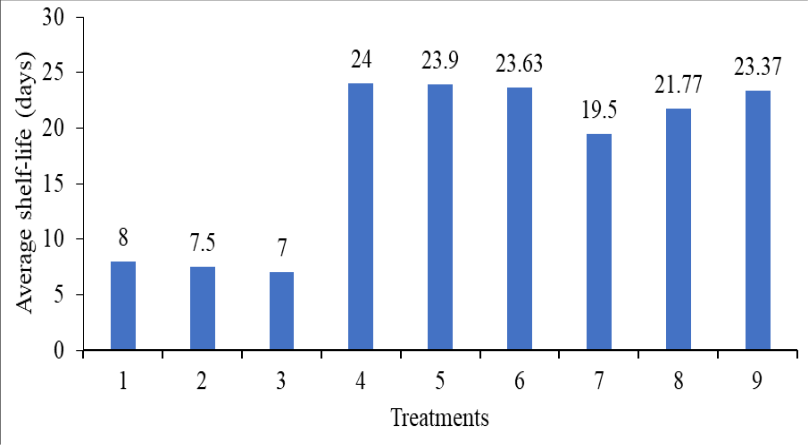 Figure 3
Introduction
Different fruits have different climatic requirements based on their nature. Grapes (Vitis vinifera) are a fruit that is one of the oldest plants in the world. It lies in the family Vitaceae, where the Vitis genera only have around 60-80 species. The fruit is four-seeded and has watery or meaty pulp, stones, and skin. Since 6000-7000 years ago, grapes are cultivated throughout the world. It first originated in the Middle East. In the case of Nepal, the cultivation practice of grapes was started by the Rana regime (70 years) but the commercialization of grapes is still in process (Dahal et al., 2017) [6] . Thus, there are not any Nepalese varieties of grapes present or released. Druschba, a grape which is originated in Ukraine. It is a rare variety, mostly grown in Europe (Anon, no date) [4] . The variety was created by mating a hybrid known as XII 51/23 with the complex-resistant wine variety Misket Kailishki (Anon, 2021) [3] . Grape bushes have vines that are modest to medium in height. It has a yellow color having a sweet aroma and flavor. It is used for making raisins as well as for wine. It is a seeded variety containing about 3-4 seeds in one berry. This grape is characterized by a medium size, a cylinder-conic form, and a medium density. The pulp has a muscatel aroma, is sticky and juicy, and has a delicious flavor that is well-balanced. The color of ripe berries is dull brown 20mm in length and 22-23mm in diameter (Anon, no date) [4] . The production of the juice surpasses 70% of the crop mass, and its titratable acidity is 6-8 g/l. Its sugar content is 19-21 g/100 ml. It takes 120-130 days from springtime budding to the beginning of removable ripeness for grapes to reach full growth. These varieties are a good resistance of frost as well as a number of fungal diseases (Anon, 2021) [3] . As it is a non-climacteric fruit, it does not produce more ethylene. However, if proper care is not given then there may increase in postharvest loss. Washing of grapes should be avoided which may lead to spoilage and mold before storing. And should be stored in a wellventilated room with high humidity (90-95%) which helps to last for up to three weeks (Walsh, 2023) [17] . Grapes can be stored using different local and modern techniques likewise, zero energy and cool bot. In this storage, RH (80-95%) and temperature are maintained as well as good air circulation. Furthermore, to enhance its shelf life, different edible salts like calcium chloride, salicylic acid, oxalic acid, chitosan, etc. can be used which coats the outer layer and prolongs the shelf life by minimizing respiration and maintaining its quality. Calcium chloride (CaCl 2 ) is an edible salt used for coating fruits and vegetables to absorb moisture and bacterial growth. It is a safe and effective way to enhance the shelf life of grapes. It can be used by farmers too as it is a costeffective solution and easy to use.
Materials and Methods
Materials and Methods
Selection of grapes
Druschba grapes were brought to the laboratory from Pataleban Vineyard Winery which is located west of Kathmandu valley at the varying altitude of 750 meters to 1600 meters above sea level. Only healthy, uniformly sized grape clusters were chosen; abnormal, sick, and damaged grape clusters were excluded. The materials were then put through several processes that were utilized in this study i.e. the sorted grapes were dipped in 2% and 4% concentration of Calcium chloride diluted in 1000ml of water and some of them were dipped in water only.
Observation room
The research was performed in both ambient, cool bot and zero energy storage. An electronic hygrometer was used to measure the temperature and humidity in the research space. The observation room's temperature and humidity were recorded daily. The hottest and lowest temperatures were 29 °C and 26.5 °C in ambient with an average of 66% RH, respectively, while in cool bot 9.5 °C was reported as the highest temperature and 6.8 0 C as the lowest temperature with an average of 87% RH. Furthermore, the zero energy reported a temperature range of 20.7 °C to 22.9 °C at 97% RH.
The sample's weight loss was determined using a digital weighing balance. Weight measurements were done every four days. Weights were obtained from each sample replication. The weight loss was calculated in percentage using the standard procedure as mentioned in (Ranganna, 1994) [14] .
Weight loss % = wt. of sample at first interval-wt. of sample at second interval wt. of sample at first interval ×100
The Vernier caliper was used to measure the samples' length and diameter. The sample's length and diameter were calculated in mm.
Color of flesh/skin
The color of flesh or skin was determined using a chromameter, which displays L*, a*, and b* values. The letters L* represent the colors black and white, a* for red and green, and b* for yellow and blue.
Fruit volume was measured by submerging the fruit in a cylindrical jar with water and measuring the volume of the displaced water.
Specific gravity
Specific gravity was determined by calculating Brix into specific gravity (Karl, 2020) [12] .
Specific Gravity = 1 + (0.004×Brix)
Firmness was determined by an instrument called a penetrometer which is used for determining the consistency of a substance by penetrating a rod by a known force. Three grapes were used from each replication to determine the firmness. It was measured in kg/cm 2 .
Spoilage %
After each storage period, fruits were inspected visually for signs of degradation. A count was made of samples that showed signs of disease.
Spoilage % = wt. of decayed sample of a treatment total wt of a sample stored in that treatment ×100
The shelf life of fruits was evaluated by recording the number of days they remained acceptable for marketing, based on appearance and spoilage. The record was taken until fruits reached the end of shelf life when 50% shrinkage or spoilage due to pathogens and abiotic factors occurred.
Statistical analysis
Data was systematically arranged using observed parameters, and analysis of variance was performed using EXCEL and GENSTAT. The available literature was used to assist in the analysis of the data and the discussion of the findings.
Results and Discussion
Results and Discussion
Physiological loss in weight
The observations were conducted at four-day intervals following treatment placement. However, once deteriorated, the reading for that particular treatment was discontinued. After 8 days of storage under ambient circumstances, all of the treatments (2%, 4%, and controlled) were no longer marketable. Similarly, 2% calcium chloride stored in zero energy was eliminated after 16 days. According to this study, grapes treated with 2% calcium chloride under cool bot storage provided the longest duration of protection with the lowest decay incidence, followed by 4% calcium chloride and control under cool bot storage. Treatments in ambient storage, on the other hand, caused early deterioration. The findings obtained indicated that the usage of 2% calcium chloride held in a cool bot was far more important than 4% when regulated under zero energy and ambient settings. According to Leng et al. (2012) [13] , the calcium chloride and ethanol treatment group lost the least weight on the 75 th day of 0 o C storage, whereas the control group lost the most. Abbasi et al. (2020) [1] in grapes, Tamizheezham et al. (2018) [16] in grapes, Shahzad et al. (2020) [15] in strawberries, and Gharezi et al. (2012) [10] in cherry tomatoes all found that different concentrations of calcium chloride treatment were significantly more effective than the control treatment, whether stored in different conditions.
Fruit length
Table 1 shows how calcium chloride and storage conditions affected fruit length in each treatment. The grapes treated with 2% calcium chloride in cold bot storage had the longest fruit length at 8 days, 19.05 mm, and the shortest at 14.97 mm in controlled ambient conditions. Similarly, on the 16 th and 24 th days, the fruit length of 2% calcium chloride in cool bot storage was much longer than the other treatments, at 17.91 mm and 17.34 mm, respectively. Thus, the study demonstrates that 2% calcium chloride in the cool bot was more relevant in the case of fruit length than other treatments, since the other treatments had the least fruit length, which might be caused by shrinking and other factors. Bhooriya et al. (2019) [5] , also supported that the guava fruits treated with calcium nitrate had larger fruit length in comparison to the control.
| Treatments code | Treatments | Fruit length | — | — |
|---|---|---|---|---|
| 8 Days | 16 Days | 24 Days | ||
| T1 | 2% CaCl2 in Ambient | 16.80 | - | - |
| T2 | 4% CaCl2 in Ambient | 15.91 | - | - |
| T3 | Controlled in Ambient | 14.97 | - | - |
| T4 | 2% CaCl2 in Cool bot | 19.05 | 17.91 | 17.34 |
| T5 | 4% CaCl2 in Cool bot | 18.07 | 17.04 | 16.02 |
| T6 | Controlled in Cool bot | 17.95 | 16.96 | 16.08 |
| T7 | 2% CaCl2 in Zero energy | 17.33 | 15.66 | - |
| T8 | 4% CaCl2 in Zero energy | 18.31 | 17.27 | 16.38 |
| T9 | Controlled in Zero energy | 18.36 | 17.59 | 16.39 |
| Mean | 17.42 | 11.38 | 9.13 | |
| LSD at 5% | 1.72 | 1.58 | 1.75 | |
| CV% | 5.7 | 8 | 11.1 |
Table text extracted from the original PDF; superscript letters are shown inline. The original table image is below.
View original table image
Fruit Diameter
Table 2 demonstrates how calcium chloride and storage conditions affect fruit diameter in each treatment. On the eighth day, the largest fruit length was 18.55 mm in the controlled cool bot, while the lowest was 14.63 mm in the controlled ambient conditions. Grapes treated with 2% and 4% calcium chloride in cool bot storage had the longest fruit lengths of 16.81 mm and 16.62 mm on the 24 th day, indicating a lower percentage of spoilage, and the shortest fruit diameter of 15.66 mm and 15.55 mm on the 16 th and 24 th days, indicating a high percentage of spoilage. According to research, on the last day of observation, 2% calcium chloride in a cool bot outperformed other treatments in terms of grape fruit diameter. Bhooriya et al. (2019) [5] also found that guava fruits treated with calcium nitrate had greater fruit diameters than the control.
| Treatments code | Treatments | Fruit diameter | — | — |
|---|---|---|---|---|
| 8 Days | 16 Days | 24 Days | ||
| T1 | 2% CaCl2 in Ambient | 15.04 | - | - |
| T2 | 4% CaCl2 in Ambient | 14.93 | - | - |
| T3 | Controlled in Ambient | 14.63 | - | - |
| T4 | 2% CaCl2 in Cool bot | 18.38 | 17.91 | 16.81 |
| T5 | 4% CaCl2 in Cool bot | 18.12 | 17.04 | 16.62 |
| T6 | Controlled in Cool bot | 18.55 | 16.96 | 16.57 |
| T7 | 2% CaCl2 in Zero energy | 16.90 | 15.66 | - |
| T8 | 4% CaCl2 in Zero energy | 17.75 | 17.27 | 15.55 |
| T9 | Controlled in Zero energy | 18.45 | 17.59 | 16.38 |
| Mean | 16.97 | 11.38 | 9.10 | |
| LSD at 5% | 1.73 | 1.58 | 1.51 | |
| CV% | 5.9 | 8 | 9.6 |
Table text extracted from the original PDF; superscript letters are shown inline. The original table image is below.
View original table image
Color
The study found no significant difference between the treatments on the 8th day of storage (p > 0.05), but shows a significant difference on the 16 th and 24 th days of storage (p<0.05) as shown in Table 3. According to Fattahi et al. (2010) [8] , a higher concentration of brown pigment or a lower L* value suggest a darker hue.
| Treatments | Color | — | — | — | — | — | — | — | — |
|---|---|---|---|---|---|---|---|---|---|
| 8 Days | 16 Days | 24 Days | |||||||
| L | a | b | L | a | b | L | a | b | |
| T1 (2% CaCl2 in Ambient) | 18.28 | -2.50 | 12.03 | - | - | - | - | - | - |
| T2 (4% CaCl2 in Ambient) | 18.42 | -1.48 | 11.50 | - | - | - | - | - | - |
| T3 (Controlled in Ambient) | 16.78 | -2.76 | 11.89 | - | - | - | - | - | - |
| T4 (2% CaCl2 in Cool bot) | 14.86 | -2.72 | 12.27 | 21.90 | -2.21 | 10.59 | 21.62 | -2.38 | 11.61 |
| T5 (4% CaCl2 in Cool bot) | 11.61 | -3.52 | 12.74 | 20.56 | -3.3 | 12.05 | 22.32 | -2.88 | 11.76 |
| T6 (Controlled in Cool bot) | 17.27 | -2.70 | 12.12 | 22.35 | -2.63 | 10.85 | 19.29 | -2.41 | 12.15 |
| T7 (2% CaCl2 in Zero energy) | 16.19 | -2.23 | 12.22 | 21.22 | -1.29 | 10.39 | - | - | - |
| T8 (4% CaCl2 in Zero energy) | 18.69 | -3.30 | 11.48 | 19.60 | -2.66 | 11.18 | 21.46 | -2.04 | 10.32 |
| T9 (Controlled in Zero energy | 21.17 | -3.06 | 10.98 | 17.29 | -1.61 | 11.45 | 19.44 | -1.4 | 11.56 |
| Mean | 17.03 | -2.70 | 11.91 | 13.66 | -1.52 | 7.39 | 11.57 | -1.23 | 6.38 |
| LSD at 5% | 7.80 | 1.50 | 2.89 | 2.691 | 0.85 | 2.85 | 2.23 | 0.82 | 2.22 |
| CV% | 26.5 | 32.2 | 14 | 11.4 | 32.2 | 22.3 | 11.1 | 38.6 | 20.2 |
Table text extracted from the original PDF; superscript letters are shown inline. The original table image is below.
View original table image
Fruit volume
Table 4 illustrates the way calcium chloride and storage conditions influence fruit volume in each treatment. The statistical results demonstrated a substantial difference between the treatments. According to the tests, 2% calcium chloride in a cold bot and 2% calcium chloride in zero energy produce more fruit per observation. Using 2% calcium chloride in a cool bot demonstrated that grape fruit volume decreases in all treatments. According to the findings of this study, the fruit volume in all treatments decreases with time. On each observation, 2% calcium chloride in a cool bot resulted in more fruit volume (59.33, 58.67, and 58.17). Thus, the findings suggest that zero energy storage has a lower incidence of shrinkage than other storage situations. Different postharvest treatments reduced the amount of guava fruits as well (Bhooriya et al. 2019) [5] .
| Treatment code | Treatments | Fruit volume | — | — |
|---|---|---|---|---|
| 8 Days | 16 Days | 24 Days | ||
| T1 | 2% CaCl2in Ambient | 56 | - | - |
| T2 | 4% CaCl2in Ambient | 55 | - | - |
| T3 | Controlled in Ambient | 54.33 | - | - |
| T4 | 2% CaCl2in Cool bot | 59.33 | 58.67 | 58.17 |
| T5 | 4% CaCl2in Cool bot | 58.33 | 58.17 | 57.5 |
| T6 | Controlled in Cool bot | 56 | 57.5 | 57.17 |
| T7 | 2% CaCl2in Zero energy | 56.83 | 56.67 | - |
| T8 | 4% CaCl2in Zero energy | 56.67 | 54.83 | 54.17 |
| T9 | Controlled in Zero energy | 55.33 | 55 | 54 |
| Mean | 56.31 | 37.87 | 31.22 | |
| LSD at 5% | 1.31 | 0.73 | 0.68 | |
| CV% | 1.3 | 1.1 | 1.3 |
Table text extracted from the original PDF; superscript letters are shown inline. The original table image is below.
View original table image
Firmness
Firmness is an essential quality criterion that assesses the hardness and softness of grapes throughout storage. However, 2% calcium chloride treated grapes held in ambient conditions (T 1 ) had a higher degree of firmness (0.89 kg/cm 2 ) than other treatments. Table 5 shows that it has the lowest firmness among all the treatments tested in every storage environment on the eighth day. On the 16 th and 24 th days, 2% calcium chloride in cool bot (T 4 ) had a greater level of firmness, with mean values of 0.80 and 0.70 kg/cm 2 . Controlled storage conditions demonstrated maximum degradation and minimal degree of firmness. The current study's findings are completely consistent with those of Abd El Wahab et al. (2014) [2] , Tamizheezham et al. (2018) [16] , and Imlak et al. (2017) [11] , who treated grapes with various concentrations of calcium chloride and found that calcium chloride-treated fruits were firmer than untreated fruits.
| Treatment code | Treatments | Firmness | — | — |
|---|---|---|---|---|
| 8 Days | 16 Days | 24 Days | ||
| T1 | 2% CaCl2in Ambient | 0.89 | - | - |
| T2 | 4% CaCl2in Ambient | 0.86 | - | - |
| T3 | Controlled in Ambient | 0.68 | - | - |
| T4 | 2% CaCl2in Cool bot | 0.69 | 0.80 | 0.70 |
| T5 | 4% CaCl2in Cool bot | 0.62 | 0.66 | 0.60 |
| T6 | Controlled in Cool bot | 0.55 | 0.66 | 0.52 |
| T7 | 2% CaCl2in Zero energy | 0.63 | 0.75 | - |
| T8 | 4% CaCl2in Zero energy | 0.79 | 0.80 | 0.55 |
| T9 | Controlled in Zero energy | 0.59 | 0.72 | 0.68 |
| Mean | 0.70 | 0.49 | 0.34 | |
| LSD at 5% | 0.37 | 0.25 | 0.12 | |
| CV % | 30.2 | 30.2 | 21.4 |
Table text extracted from the original PDF; superscript letters are shown inline. The original table image is below.
View original table image
Spoilage %
Figure 2 shows that cool bot differed more significantly from other storage conditions. Similarly, on the 16 th and 24 th day, 2% calcium chloride in cool bot had reduced spoilage %, i.e. 0.97 and 2.44%, while the greatest spoilage% was detected on controlled in zero energy, i.e. 8.0 and 8.05%, respectively, with the mean of all treatments being 2.96% and 2.74%. Because of the low temperature and high RH, cool bot demonstrated a greater difference than other storage conditions, as seen in Figure 2, Leng et al. (2022) [13] found that a longer storage duration increased degradation frequency while low temperature considerably reduced grape berry decay, with 0°C decay frequency less than 5°C. Abbasi et al. (2020) [1] found that various calcium chloride concentrations resulted in decreased deterioration in Perlite and King's Ruby grape types after 28 days of cold storage.
Specific Gravity
Table 6 illustrates the effect of calcium chloride and storage conditions on specific gravity in each treatment. The specific gravity increased significantly after 8, 16, and 24 days of storage (p<0.05). On the eighth day, the maximum specific gravity was observed on T 1 (2% calcium chloride in ambient) (1.077) and the lowest on 2% calcium chloride in zero energy (1.062), while on the sixteenth and twentyfourth days, specific gravity was highest on 4% calcium chloride in cool bot (1.071 and 1.076, respectively). Grape varietal, maturity, and temperature all had an impact on their specific gravity (Dharmadhikari, 2021) [7] .
| Treatments code | Treatments | Specific Gravity | — | — |
|---|---|---|---|---|
| 8 Days | 16 Days | 24 Days | ||
| T1 | 2% CaCl2in Ambient | 1.077 | - | - |
| T2 | 4% CaCl2in Ambient | 1.068 | - | - |
| T3 | Controlled in Ambient | 1.075 | - | - |
| T4 | 2% CaCl2in Cool bot | 1.067 | 1.070 | 1.065 |
| T5 | 4% CaCl2in Cool bot | 1.071 | 1.071 | 1.076 |
| T6 | Controlled in Cool bot | 1.067 | 1.062 | 1.067 |
| T7 | 2% CaCl2in Zero energy | 1.062 | 1.060 | - |
| T8 | 4% CaCl2in Zero energy | 1.067 | 1.070 | 1.064 |
| T9 | Controlled in Zero energy | 1.067 | 1.060 | 1.071 |
| Mean | 1.069 | 0.710 | 0.594 | |
| LSD at 5% | 0.008 | 0.006 | 0.003 | |
| CV % | 0.4 | 0.5 | 0.3 |
Table text extracted from the original PDF; superscript letters are shown inline. The original table image is below.
View original table image
Shelf life
As shown in the fig 3, the greatest average shelf-life of storage from the first day was reported in 2% calcium chloride in cool bot (24 days), followed by 4% calcium chloride in cool bot. The minimal average shelf-life was observed in controlled under ambient circumstances, which was 7 days. The average of all nine treatments was determined to be 17.63 days. The current study's findings reveal that temperature and relative humidity have a substantial impact on grape shelf life. Garcia et al. (1996) [9] researched strawberries, Gharezi et al. (2012) [10] cherry tomatoes, and Tamizheezham et al. (2018) [16] grapes, and found that room temperature and edible salt coating (CaCl 2 ) had a significant impact on shelf life.
Conclusion
As grape is a perishable fruit, it can easily be decayed. Thus, to increase the life span of grapes, this research was carried out whose investigation indicated that calcium chloride and the varied storage conditions used in this study affect a variety of metrics, including grape physical and shelf-life. For the majority of the qualities studied, all treatments produced substantial changes. For the majority of attributes, 2% calcium chloride under cool bot (T 4 ) circumstances performed best, followed by 4% calcium chloride under cool bot (T 5 ) settings. Out of all the treatments, 2% calcium chloride in a cold bot (T 4 ) was shown to have the least amount of weight loss, spoiling, firmness and specific gravity. Fruit length and diameter in 2% calcium chloride under cool bot (T 4 ) has higher than other treatments. This result indicate that all the treatments which were stored in cool bot storage having 85±5% RH and 8±1°C temperatures shows a significant difference between other treatments. Moreover, there shelf life extended up to more than 20 days in cool bot and zero energy storage. Among them, grapes treated with 2% calcium chloride under cool bot (T 4 ) seems to be healthy and extend the shelf life up to 24 days.
Figures and tables from the paper
References
11 in the original paper- Abbasi NA, Shafique M, Ali I, Qureshi AA, Hafiz IA. Pre-harvest foliar application of calcium chloride improves berry quality and storage life of table grape cvs. 'Perlette' and 'Kings Ruby'. Journal of Pure and Applied Agriculture. 2020;5(2).
- Wahab AEIWA, Wahab AEISM, Kamel OT. Using safe alternatives for controlling postharvest decay, maintaining quality of crimson seedless grape. World Applied Sciences Journal. 2014;31(7):1345-57.
- Bhooriya MS, Bisen BP, Dongre R, Kumar M. Effect of post-harvest treatments on shelf life and physicochemical changes of Guava fruits. International Journal of Chemical Studies. 2020;8(1):595-598.
- Dahal K, Bhattarai S, Midmore D, Oag D, Walsh K. Table grape production in the subtropics and prospects for Nepal. Nepalese Horticulture. 2017;12:6-10.
- Dharmadhikari M. Composition of grapes; c2021. Available from: https://www.extension.iastate.edu/wine/wpcontent/uplo ads/2021/09/compositionofgrapes.pdf
- Fattahi J, Fifall R, Babri M. Postharvest quality of kiwifruit (Actinidia deliciosa cv. Hayward) affected by pre-storage application of salicylic acid. South Western Journal of Horticulture, Biology and Environment. 2010;1(2):175-186.
- García JM, Herrera S, Morilla A. Effects of postharvest dips in calcium chloride on strawberry. Journal of Agricultural and Food Chemistry. 1996;44(1):30-33.
- Gharezi M, Joshi N, Sadeghian E. Effect of postharvest treatment on stored cherry tomatoes. Journal of Nutrition and Food Sciences. 2012;2(8):1-10.
- Imlak M, Randhawa MA, Hassan A, Ahmad N, Nadeem M. Post-harvest shelf life extension and nutritional profile of Thompson seedless table grapes under calcium chloride and modified atmospheric storage. Journal of Food Processing and Technology. 2017;8(1).
- Leng F, Wang C, Sun L, Li P, Cao J, Wang Y, Zhang C, Sun C. Effects of different treatments on physicochemical characteristics of 'Kyoho' grapes during storage at low temperature. Horticulture. 2022;8(2):94.
- Shahzad S, Ahmad S, Anwar R, Ahmad R. Pre-storage application of calcium chloride and salicylic acid maintain the quality and extend the shelf life of strawberry. Pakistan Journal of Agricultural Sciences. 2020;57(2).