
Research article · 2024 · Full text
International Journal of Research in AgronomyFormulation and evaluation of Indian traditional sweet Panjiri substituted with pearl millet (Pennisetum glaucum L.)
Volume 7(4) · Pages 325–333 · DOI: 10.33545/2618060x.2024.v7.i4e.571 ↗
Research areasFood Science and Nutritional StudiesFood composition and propertiesCeliac Disease Research and Management
Abstract
Author-writtenPanjiri is a traditional sweet which is made from wheat flour and sugar. The study involves substitution of wheat flour by pearl millet and refined sugar by jaggery powder for the purpose of preparing a product that is nutritionally rich, aiming at not losing the authenticity of the traditional panjiri yet trying to modify it in a way to enhance its health benefits. Different combinations of panjiri were prepared; the control sample (S0) contains only wheat flour which is the standard product, second sample (S1) contains 100% pearl millet flour and the third product (S2) contains both wheat and pearl millet flour in equal proportions that is 50% each. The proximate analysis, antioxidant properties, mineral content, organoleptic properties and shelf life study of all the combinations was carried out. The moisture content varied from 9.37±0.91 to 9.61±1.74%, the lowest observed for S1. The sample S1 has highest protein and ash content (which is 7.02±0.58% and 1.95±0.13% respectively). The highest fat content of 23.64% in S1 persists because of its formulation that is 100% pearl millet flour. The carbohydrate content varied from 60.54±0.90 to 62.57±1.03%, S2 possessing the lowest value and S1 highest. S0 had lowest antioxidant activity (16.17±0.82%) followed by S2 (26.45±1.16%) and then S1, (30.8±1.24%). The total phenolic content of S0 was least (210.5±1.4310 µg FAE/g) and it was highest for S1 (436.27 µg FAE/g). Out of all the samples, S1 has the highest whereas S0 has the lowest mineral content. From the mean scores of the organoleptic analysis, S2 was accepted and liked the most by the panelists followed by S1 and S0.
Summary
Source-checkedPlain-language reading of the full paper, prepared with AI and checked against the text. Each point links to the authors' own words.
Why it matters
- India faces a significant challenge with high rates of malnutrition among women and children, exceeding those of Sub-Saharan African countries. View evidence ↗
- Panjiri is a traditional Indian sweet typically formulated using sugar and wheat flour. View evidence ↗
- Replacing traditional cereals with millets can improve the nutritional profile of panjiri by adding more vitamins, minerals, and fibers while making it gluten-free. View evidence ↗
The question
- The research aims to create a nutritionally enhanced version of panjiri by substituting wheat flour with pearl millet and refined sugar with jaggery powder. View evidence ↗
What they did
- Three formulations were tested: a control (S0) with 100% wheat flour, a modified version (S1) with 100% pearl millet flour, and a blend (S2) with 50% wheat and 50% pearl millet flour. View evidence ↗
- All samples were prepared using 100g of jaggery powder and 50g of ghee, roasted at 160 °C for 4 minutes. View evidence ↗
What they found
- S1 contained the highest levels of minerals, specifically 11.24 mg/100g of iron, 40.38 mg/100g of calcium, and 279.15 mg/100g of phosphorus. View evidence ↗
- After 45 days of storage, the control (S0) had the highest moisture content (11.27%), while the blend (S2) had the lowest (10.49%). View evidence ↗
What it means
- The authors conclude that pearl millet substituted panjiri is superior nutritionally and sensorially, making it a beneficial food for people with anemia or malnutrition. View evidence ↗
- The developed product is estimated to have a shelf life of approximately 30 days. View evidence ↗
Visual summary
3 visualsIllustrations explain the paper; charts are replotted from the paper's own table values.
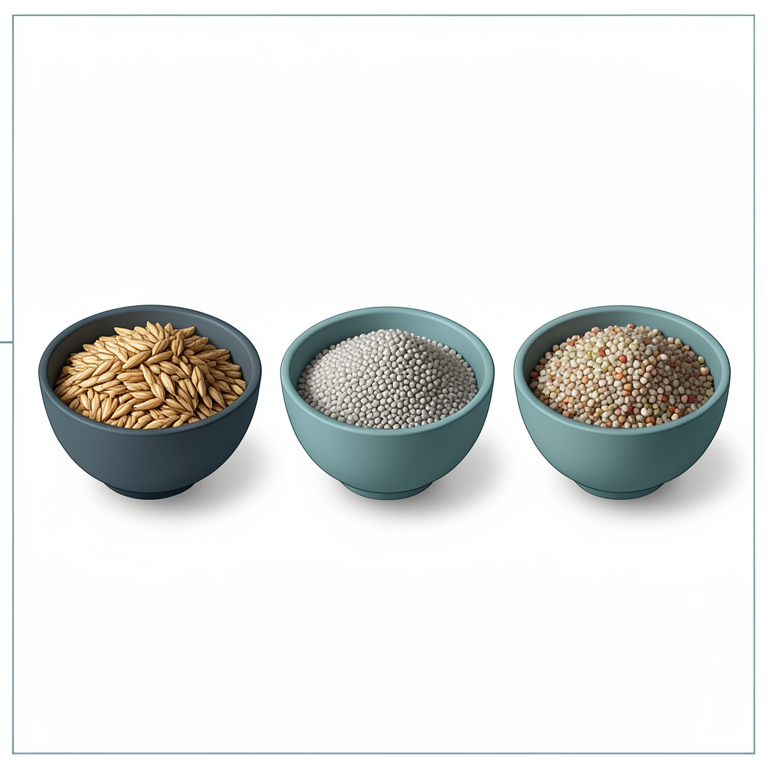
Panjiri Formulation Comparison
AI-generated conceptual illustration (Panjiri (traditional Indian sweet) made from wheat flour and pearl millet flour). It explains the idea and does not show study data.
View source evidence ↗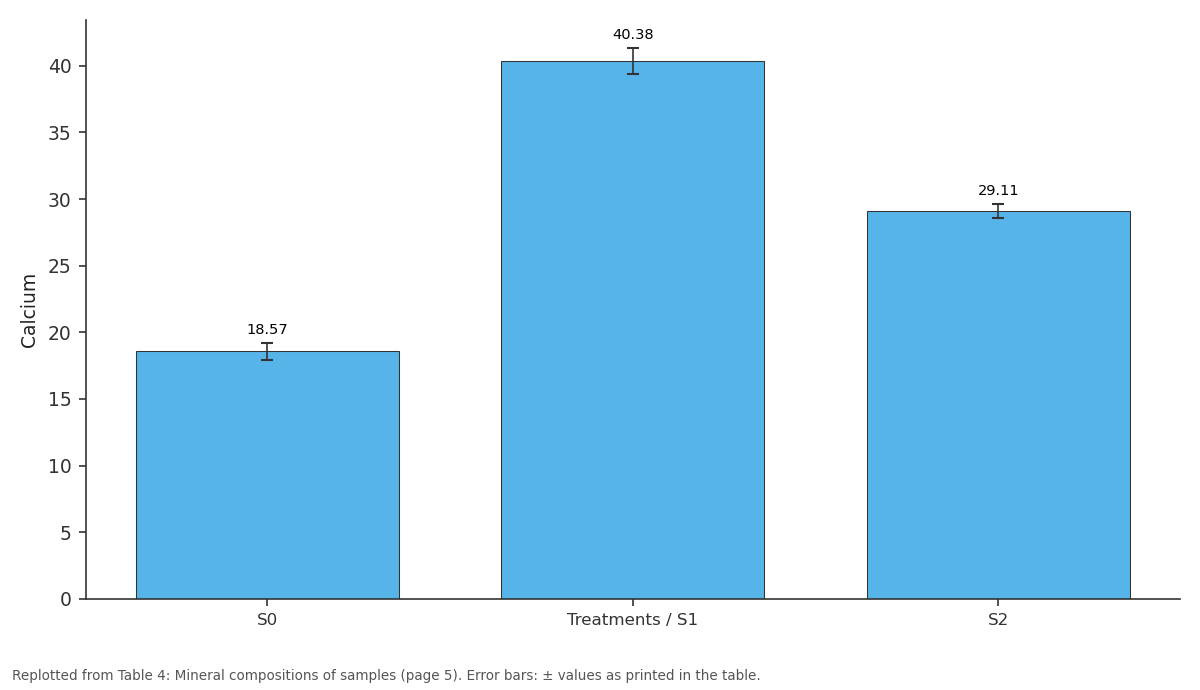
Calcium: S0 vs Treatments / S1 vs S2
Replotted from Table 4 (page 5) of the original paper. Every bar is the paper's own table value.
View source evidence ↗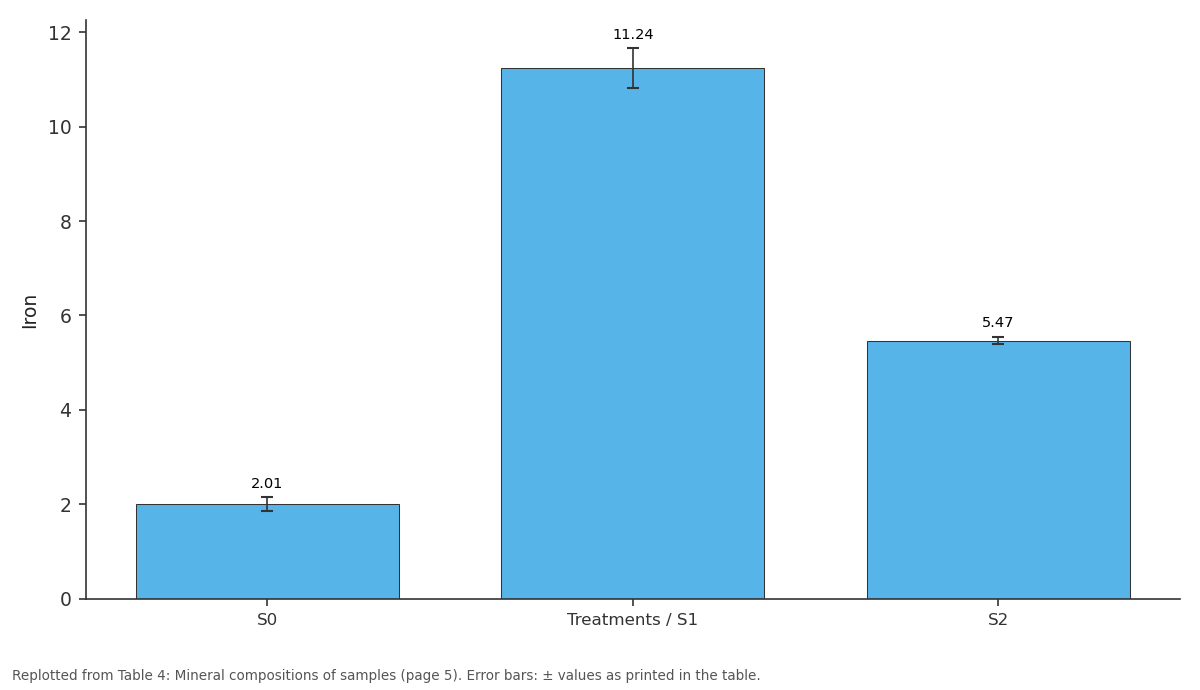
Iron: S0 vs Treatments / S1 vs S2
Replotted from Table 4 (page 5) of the original paper. Every bar is the paper's own table value.
View source evidence ↗Figures & tables
From the original paper Table 1
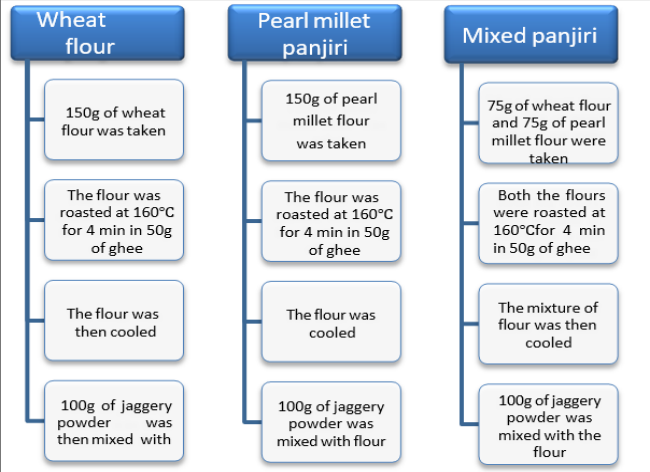 Figure 4
 Table 2
 Table 3
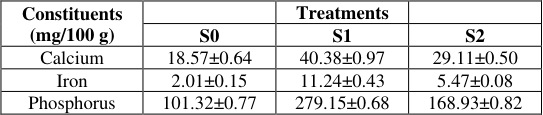 Table 4
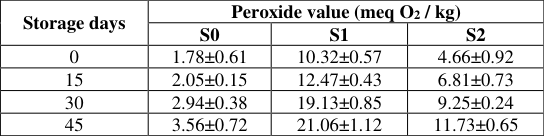 Table 6
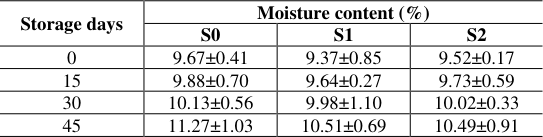 Table 5
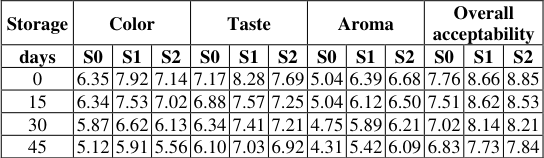 Table 7
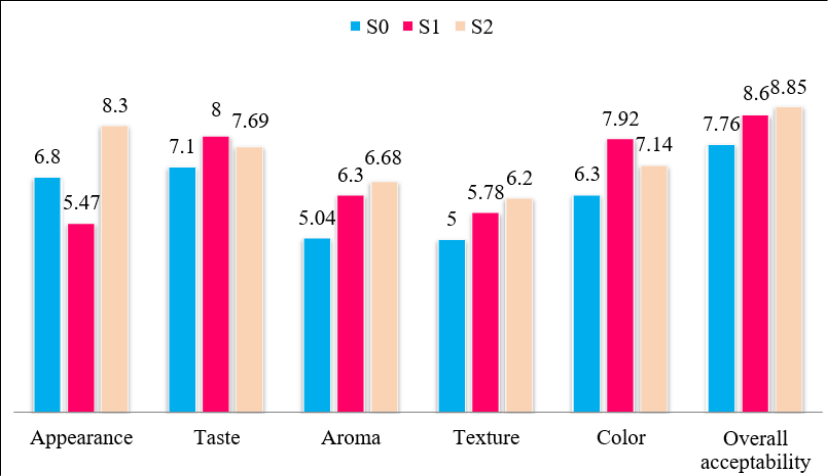 Figure 5
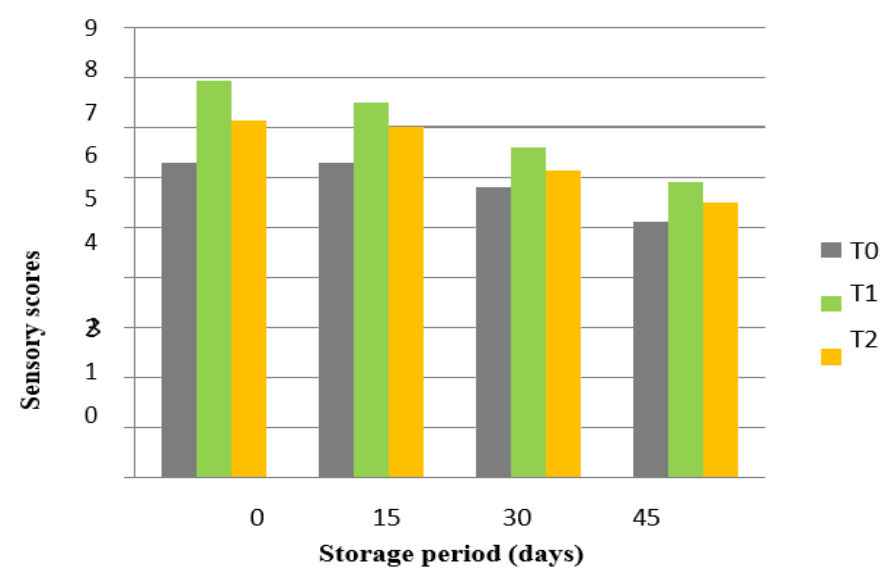 Figure 6
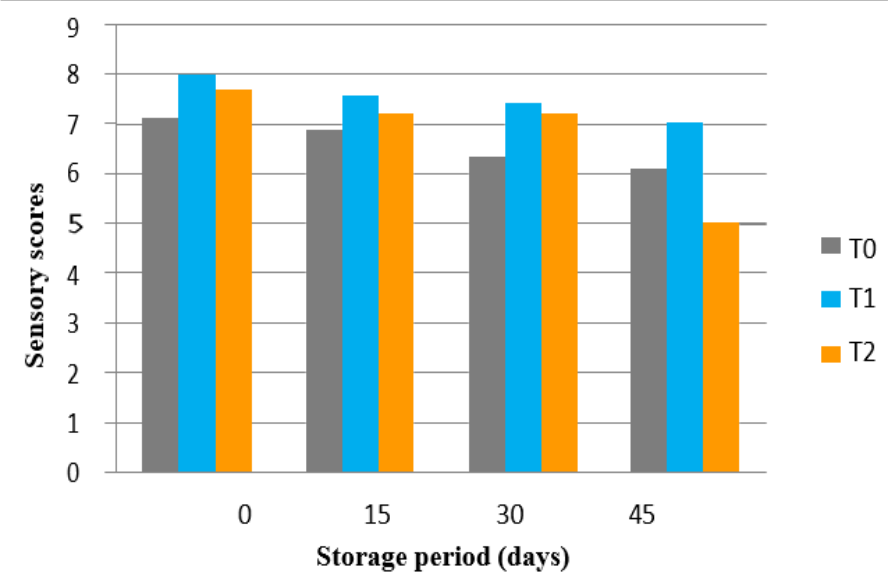 Figure 7
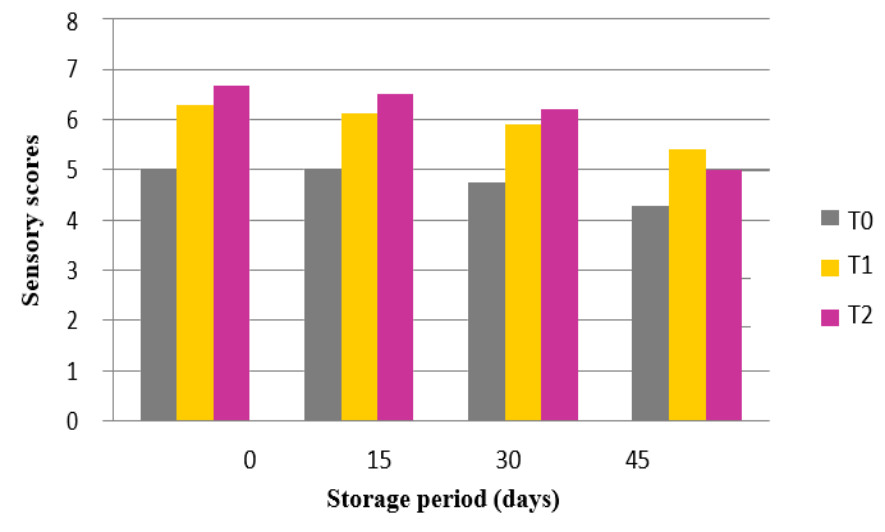 Figure 8
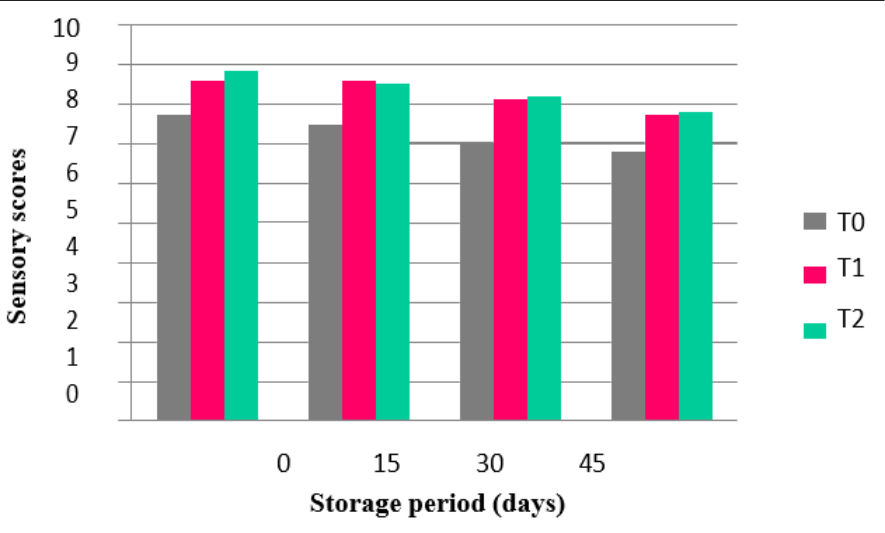 Figure 9
Introduction
Nutrition is the key to a healthy life and it plays a crucial role in the maintenance of physical and mental wellbeing throughout the life. Scarcity and lack of nutrition might cause serious conditions of malnutrition, impaired and improper growth, reduced working capacity, poor social and mental development (Stein 2010) [32] . India is amongst the top countries to have the highest burden of malnourished children and women in the world, almost twice that of Sub-Saharan African countries (Deaton & Dreze, 2009; Gragnolati et al., 2005) [10,12] . Protein energy malnutrition is one of the major health problems in India which leads to childhood mortality, permanent impairment of physical and mental growth and various other morbidities of survivors (Krishnan et al., 2012) [19] . Malnutrition is a serious concern for any country to look up for. It is not only associated with inadequate protein but also inadequate essential amino acids and energy supply for a proper and healthy body functioning. (Stein, 2010) [32] . Poor nutrition and bad eating habits right from a very young age can prove to be disastrous for any individual and can lead to various serious or chronic health issues (Willett et al., 2017) [35] . For children right from the age of 6 months and for women, consumption of supplementary food and functional foods can provide helpful treatment to reduce the chances of malnutrition and them at as a source for balanced diet (Michaelsen et al., 2009) [25] . The indigenous traditional sweets have gained immense demand recently. Amongst a huge variety of these Indian sweets, some are still not as popular as others. Panjiri is one such traditional sweet made from wheat flour and sugar and is prepared during festivals like Janmasthmi as Prasad (Karwasra et al., 2021) [17] . Panjiri is usually prepared from the blend of cereals such as wheat, rice and maize with sugar, ghee and various dry fruits.
But these cereals are comparatively low in protein and it is also well known that cereal based foods are low in energy and nutrient density (Baskran et al., 1999) [6] . Substituting panjiri with millet, which are nutritionally rich as compared to cereals and provides minerals, fibers, vitamins and are gluten free as well, can play an important role in enhancing the overall nutritional quality of panjiri, (Kaur et al., 2021) [17] . Millet is a generic term used for cereal species having small sized grains, almost around one quarter to one tenth the size of wheat kernels, which form heterogeneous group and referred along with maize and sorghum as "coarse cereals" (Taylor, 2017) [33] . Verily, some of these millet species are more distantly related with each other than, wheat and barley (Jaybhaye et al., 2014) [15] . Millets are nutritionally comparable or even superior to major cereals with respect to proteins, energy, vitamins and minerals. These can be a promising alternative in overcoming the problem of food insecurity and malnutrition (Kumar et al., 2018) [20] . Millets are a rich source of minerals, nutraceuticals and higher dietary fibers as that of rice or wheat. Small millets are more nutritious than fine cereals and are good source of phosphorous and iron. Millets are valuable for their high content of vitamin B, folic acid, phosphorus, iron and potassium and in addition to this, millets are gluten free, easy to digest and are a great source of antioxidants and perhaps have anti carcinogenic properties (Rao et al., 2017) [9] . Certain studies and observations have shown that the regular consumption of whole grain cereals and their products protects against the risk of diabetes mellitus, gastrointestinal diseases and cardiovascular risks (McKeown, 2002) [24] . Using millets as wholegrain makes the essential nutrients (like, dietary fibers, minerals, phenolics and vitamins) concentrated in outer layer of the grain or the seed coat form the part of the food and offer their nutritional and health benefits (Dayakar et al., 2017) [9] . Pearl millet contains magnesium, which aids in reducing respiratory problems among asthma patients and alleviating the effects of migraines. The fibre content of pearl millet plays a crucial role in decreasing the occurrence of gallstones. Specifically, the insoluble fibre found in pearl millet helps reduce the excess bile in our system, as an excess amount of bile can lead to the formation of gallstones (Malik, S. (2015) [21] and hence, Food and Agriculture Organization (FAO) and Integrated Child Development Scheme (ICDS) anticipated the development of locally sourced supplementary food using indigenous cereals and legumes (Imtiaz et al., 2011) [14] . The study involves the substitution of wheat flour by pearl millet and refined sugar by jaggery powder for the purpose of preparing a product that is nutritionally rich and is much healthier than the traditional sweet. The study also aims at not losing the authenticity of the traditional product that is panjiri yet trying to modify it in a way to make it nutritionally better and enhancing its health benefits.
Materials and Methods
Materials and Methods
Procurement of raw material
Wheat flour and pearl millet flour was procured from a local market in Greater Noida, Uttar Pradesh, India. Jaggery powder was purchased online from a manufacturer. All other reagents and solvents used were of analytical grade.
Preparation of Panjiri
Different combinations of panjiri i.e. standard and modified panjiri were prepared using pearl millet and jaggery powder. Each flour was blended with equal proportions of jaggery powder for the panjiri formulation. The total sample weight for each sample of panjiri was 300 g. Various proportions of flour and jaggery powder were roasted using equal amounts of ghee in pan on an induction heater at 160 °C for 4 min each. After thorough mixing of each lot of flour and ghee, roasting was done with constant movement of mass to avoid burning with heat. Once the color changed to reddish brown, the vessel was removed from the induction heater and cooled for 1-2 min. Jaggery powder was then added to the vessel and ingredients were mixed together until nicely blended. The control sample (S0) contains only wheat flour which is the standard product. The second sample (S1) contains only 100% pearl millet flour and the third product (S2) contains both wheat flour and pearl millet flour in equal proportions i.e. 50% each. (Salve et al., 2011) [31] , prepared the traditional panjiri by roasting the wheat flour at 70-80 °C, and then mixing it with refined sugar.
Proximate Composition
The moisture content was determined on dry weight basis in which 5 g of the sample was dried in an oven at 105 °C for 16 hrs and weighed AOAC Method No: 934.01 (2005). Ash content of the sample was determined by taking 1 g of sample in a preweighed silica crucible in which preliminary ashing was done by slow heating on flame to allow smoking off fat, then incinerated in a muffle furnace at 500°C for 5hrs then cooled and weighed using AOAC Method No: 923.03 (2005). Fat content was estimated by the Soxhlet method as described in AOAC Method No: 920.39 (2005), in which petroleum ether is used as a solvent to extract fat from the sample. Protein content was estimated by determining total nitrogen content using standard Micro-Kjeldhal method in which nitrogen in the compound was converted into ammonium sulphate by digesting the compound with conc. sulphuric acid. Ammonium sulphate thus obtained was decomposed by alkali and the liberated ammonia was absorbed in boric acid and titrated against standard sulphuric acid/ hydrochloric acid by following the procedure as described in AACC Method No: 46-10.01 (2010). The crude fiber content was estimated by subjecting sample to acid digestion followed by alkali digestion and the remaining residue was weighed and ashed. The loss of weight after ashing was the crude fibre content of the feed as mentioned in AACC Method No: 32-10.01 (2010). Anthrone method was used to determine carbohydrate content, described by Sadasivam and Manickam (2005) [30] .
Antioxidant properties of Panjiries Antioxidant activity (AOA)
Antioxidant activity of the samples will be determined by using method described by Brand-(Williams et al., 1995) [7] . DPPH (2, 2-diphenyl-1-picrylhydrazy) solution was added of about 2.9 ml to 0.1ml of methanolic extract of the sample. The mixture was then placed in dark for 1hr and the decrease in absorbance at 517nm was determined using spectrophotometer as percentage inhibition (%I) of DPPH (where, I = DPPH inhibition %).
Total phenolic content (TPC)
The total phenolic content was determined on the basis of the method described by Sharma & Gujral, (2010). The sample was first extracted with 4ml of acidified methanol at room temperature using a shaker for about 2hrs. This mixture was centrifuged at 3000xg for 10min. The supernatant was added for determining the total phenolic content. 200μl of extract was added to 1.5 ml freshly diluted. Folin & Ciocalteu's phenol reagent and the mixture was then allowed to equilibrate for 5 min. It was then mixed with 1.5ml of sodium carbonate solution. Then after the incubation at room temperature for 90min, absorbance of the mixture was noted using a spectrophotometer at 725nm.
Mineral Composition
Pearl millet has various minerals present in it, iron being the major one. So, the iron content, calcium content and phosphorus content of the samples were determined. The iron content was determined according to the method of Florence et al., 2014 [11] . The sample was wet ashed using sulfuric acid, nitric acid and hydrochloric acid. An aliquot of the extract was treated with thioglycollic acid and the color was noted using a photometer at 535nm. The iron content in the sample was calculated in the form of standard curve and expressed as mg/100 g of sample. Calcium content of the sample was also calculated according to the method described by Florence et al., 2014 [11] . The silica free solution of the cereal ash was neutralized using an acid and methyl red indicator solution. The calcium in sample was then converted to calcium oxalate and precipitate by pH adjustment. The calcium content was determined by titration of the calcium oxalate with standard potassium permanganate. The calcium content was calculated on the basis of following relationship and the results were expressed as mg/100 g of sample. The phosphorus content of the sample was determined using the method described by Florence et al., 2014 [11] . In this, the sample was dried to ash using a carbonate nitrate fusion mixture. The ash was then extracted with TCA, acid molybdate solution and 1, 2, 4 amino napthol sulphuric acid reagent. A blue color with the intensity proportional to that of the phosphorus content was produced. The intensity of the blue color was read using a photometer at 660nm.
Organoleptic properties
The sensory evaluation of the samples was done by using 9point hedonic scale method. The panjiri samples were subjected to sensory analysis by a panel of twenty untrained judges who examined and evaluated the product. The panelists aged between 20-65 years included students, research scholars, faculties, family and friends. "The sensory analysis of the samples was carried out under ambient conditions in a comfortable and quite area without any distractions under proper lighting and controlled temperature.' The product samples were served randomly afterlabeling with digits (1, 2 and 3). Each panelist was given a rating score card based on 9-point hedonic scale to rate the panjiries for various parameters ('9like extremely,8like very much, 7-like moderately, 6-like slightly, 5-neither like nor dislike, 4-dislike slightly, 3-dislike moderately, 2-dislike very much, 1-dislike extremely'). Mineral water was given as palate cleansers between each sample and after palate cleansing a pause of around 15-20sec was given before the next tasting. The evaluation was based on the attributes; appearance, taste, aroma, texture, color and overall acceptability. The scores were noted and final readings were taken out after calculating the mean.
Microbiological analysis
A period microbial examination was used to examine the microbiological life of the Panjiri. It is the ideal evaluation of the prepared product's quality. Total Plate Count (TPC) along with yeast and mold counts as well as coliform counts were conducted over a 28-day period, 7 days apart (held at room temperature (250 C) with a relative humidity of 25.0%), to measure the microbiological quality. (An airtight container served as the packing material for the manufactured product during the study period).
Shelf life study
The shelf life of the samples was tested on the basis of moisture content, peroxide value and sensory characteristics during the storage period of 45 days under ambient conditions. The moisture content was determined according to the methods of AOAC, (1990) as described in sections above. The sensory characteristics were determined using 9-point hedonic scale method as described in previous section. Peroxide value of the samples was determined using method described by AOCS, (1998). It was determined when the iodine liberated from potassium iodide was titrated with sodium thiosulphate solution.
Results and Discussions Proximate composition
The proximate compositions of different treatments are presented in Table 2. Moisture, ash, crude fiber, crude protein, crude fat and carbohydrates content of control and modified panjiri were calculated. The moisture content varied from 9.37 to 9.61%, the lowest was observed for S1 and highest for S0. It is also observed that the sample S1 has the highest protein content which is 7.02% as well as highest ash content which is 1.95% (which symbolizes the mineral amount). S0 has the lowest fat content i.e. 19.38%. On the other hand the highest fat content of 23.64% in S1 persists because of its formulation i.e. 100% pearl millet flour. As the pearl millet flour has the higher fat content so does the sample S1. Out of all the three samples S2 possess values between S0 and S1 for each proximate composition. The average values of S2 are a result of its formulation which is 50% wheat flour and 50% pearl millet flour. The carbohydrate content varied from 60.54 to 62.57%. S2 possessing the lowest value (60.54%) and S1 the highest (62.57%). In the earlier study by (Karwasra et al., 2021) [17] , the moisture, ash, protein, fat, fibre and carbohydrates content of wheat flour panjiri was identified to be 1.24, 0.82, 8.76, 13.60, 1.18 and 87.57%, respectively. In the study of (Salve et al., 2011) [31] , the results of proximate analysis of wheat flour panjiri was moisture 1.52%, ash 0.72%, protein 12.2%, fat 13.91%, fiber 1.31% and carbohydrates 71.20%.
| Product | Moisture (%) | Ash (%) | Crude fat (%) | Crude protein (%) | Crude fiber (%) | Carbohydrates (%) |
|---|---|---|---|---|---|---|
| S0 | 9.61±1.74 | 1.66±0.52 | 19.38±0.84 | 6.78±0.45 | 4.98±0.20 | 62.57±1.03 |
| S1 | 9.37±0.91 | 1.95±0.13 | 23.64±1.05 | 7.02±0.58 | 5.28±0.47 | 58.02±1.12 |
| S2 | 9.52±0.88 | 1.43±0.26 | 21.67±0.93 | 6.84±0.39 | 5.62±0.29 | 60.54±0.90 |
Table text extracted from the original PDF; superscript letters are shown inline. The original table image is below.
View original table image
Antioxidant properties
The antioxidant properties of the samples are presented in Table 3. The antioxidant activity and total phenolic compounds of the samples were calculated. The antioxidant activity varied from 16.17 to 30.8%. S0 had the lowest antioxidant activity which is 16.7 followed by S2, 26.45% and then S1, 30.8%. Therefore it is concluded that, S1 had the highest antioxidant activity. The total phenolic content of S0 was least i.e. 210 µg FAE/g and it was highest for S1 i.e. 436.27 µg FAE/g. The total phenolic content of S2 was between that of S0 and S1. It is seen from the study of Karwasra et al., (2021) [17s] that the antioxidant activity and the total phenolic content of whole wheat flour panjiri was found as 17.45% and 230.82 µg FAE/g, respectively.
| Parameters | Treatments | — | — |
|---|---|---|---|
| S0 | S1 | S2 | |
| AOA (%) | 16.17±0.82 | 30.8±1.24 | 26.45±1.16 |
| TPC (µg FAE/g) | 210.5±1.43 | 436.27±1.05 | 351.06±0.91 |
Table text extracted from the original PDF; superscript letters are shown inline. The original table image is below.
View original table image
Mineral Content
The mineral content of all the samples of panjiri are presented in Table 4. The values presented in the table shows that the calcium content varied from 18.57 to 40.38 mg/100 g. The panjiri prepared from whole wheat flour, S0, showed the lowest value for calcium, 18.57 mg/100 g, amongst all three. The highest content of iron, calcium and phosphorus was seen in S1, the values being, 11.24 mg/100 g, 40.38 mg/100 g, and 279.15 mg/100 g, respectively. S2 shows average values for all the minerals in comparison with S0 and S1. The mineral content significantly increases as the percentage of pearl millet increases. It is observed that, out of all the samples, S1 has the highest mineral content whereas S0 has the lowest mineral content. The highest mineral content of S1 is associated with the presence of pearl millet in it. In the study of Karwasra et al., (2021) [17] , it is detected that the calcium content, iron content and phosphorus content of the whole wheat flour panjiri was 20.13, 1.23 and 111.65 mg/100 g, respectively. Also from the study of Salve et al., (2011) [31] , the calcium, phosphorus and iron content of wheat flour panjiri was found to be 24.52, 126.01, and 2.6 mg/100 g.
| Constituents (mg/100 g) | — | Treatments | — |
|---|---|---|---|
| S0 | S1 | S2 | |
| Calcium | 18.57±0.64 | 40.38±0.97 | 29.11±0.50 |
| Iron | 2.01±0.15 | 11.24±0.43 | 5.47±0.08 |
| Phosphorus | 101.32±0.77 | 279.15±0.68 | 168.93±0.82 |
Table text extracted from the original PDF; superscript letters are shown inline. The original table image is below.
View original table image
Organoleptic properties
Sensory properties of the samples were calculated on the basis of 9-point hedonic scale method. The sample S1 had the highest score for taste i.e. 8. The color of S1 is the result of the presence of pearl millet flour that gives it a beautiful golden brown shade as compared to S0 and S2 which have wheat flour along with pearl millet flour. It was seen from the score table that panelists liked the appearance, aroma and texture of treatment S2 the most as it shows the highest values i.e., 8.3, 6.68 and 6.2, respectively. The poor texture and color of S1 is because of the wheat flour content. The mean score of appearance was highest for S2 followed by S0 and then S1. The taste attribute was highest for S1 i.e. 8 and lowest for S0. It can therefore be concluded that from the above mean scores, S2 was accepted and liked the most by the panelists followed by S1 and S0. In the study of Salve et al., (2011) [31] it was seen that the sensory attributes of the wheat flour panjiri were decreased on the addition of soy flour and chickpea flour. Also the study of Karwasra et al., (2021) [17] showed average results of sensory quality characteristics of whole wheat flour panjiri. It was observed from their study that wheat flour panjiri is well acceptable overall.
Shelf life Study
The storage qualities of all the samples are presented in Table 5 and 6. The samples were studied for the changes in moisture content, peroxide value (PV) and sensory characteristics during storage at ambient conditions. The shelf life testing was done over a period of 45 days. The moisture content of all the samples increased with the passing days and is depicted in Table 5. The highest moisture content after 45 days of storage was noted in S0 which is 11.27% whereas the lowest was noted in S2 which is 10.49%. The variation in moisture content after 15 days for all the samples was least. The peroxide value of all the samples increased significantly during storage as shown in Table 6. S0 had the lowest peroxide value on day 0, which is 1.78 meq/kg followed by S2 and then S1. It increased gradually over passing days but the lowest values were obtained for S0. It is observed that S1 had highest peroxide value after 45 days i.e. 21.06 meq/kg. S2 showed values between S0 and S1 throughout the storage. The changes in sensory characteristics during storage are shown in Table 7. It observed that sensory attributes of the samples decreased on storage. It is observed that the color of the samples became darker during storage. The sensory scores of color attribute for all treatments decreased significantly. The changes in color through 45 days are shown in Figure 6. It was seen that after 45 days the color score of S 0 had lower value i.e. 5.12 whereas S 1 had highest value i.e. 5.91. The analysis of the variance of taste revealed that there was a significant change in the taste of the panjiries when they were stored. Figure 7 shows that the taste of S 1 was more acceptable with a score of 7.03 than S 0 with the score 6.10 and S 2 with the score 6.92, after 45 days. The results of overall acceptability of all the samples also decreased and are depicted in Figure 9. S 0 was least acceptable after 45 days with the score of 6.83 Whereas S 2 was the most acceptable with the score of 7.84.
| Storage | Color | — | — | Taste | — | — | Aroma | — | — | Overall acceptability | — | — |
|---|---|---|---|---|---|---|---|---|---|---|---|---|
| days | S0 | S1 | S2 | S0 | S1 | S2 | S0 | S1 | S2 | S0 | S1 | S2 |
| 0 | 6.35 | 7.92 | 7.14 | 7.17 | 8.28 | 7.69 | 5.04 | 6.39 | 6.68 | 7.76 | 8.66 | 8.85 |
| 15 | 6.34 | 7.53 | 7.02 | 6.88 | 7.57 | 7.25 | 5.04 | 6.12 | 6.50 | 7.51 | 8.62 | 8.53 |
| 30 | 5.87 | 6.62 | 6.13 | 6.34 | 7.41 | 7.21 | 4.75 | 5.89 | 6.21 | 7.02 | 8.14 | 8.21 |
| 45 | 5.12 | 5.91 | 5.56 | 6.10 | 7.03 | 6.92 | 4.31 | 5.42 | 6.09 | 6.83 | 7.73 | 7.84 |
Table text extracted from the original PDF; superscript letters are shown inline. The original table image is below.
View original table image
| Storage days | Moisture content (%) | — | — |
|---|---|---|---|
| S0 | S1 | S2 | |
| 0 | 9.67±0.41 | 9.37±0.85 | 9.52±0.17 |
| 15 | 9.88±0.70 | 9.64±0.27 | 9.73±0.59 |
| 30 | 10.13±0.56 | 9.98±1.10 | 10.02±0.33 |
| 45 | 11.27±1.03 | 10.51±0.69 | 10.49±0.91 |
Table text extracted from the original PDF; superscript letters are shown inline. The original table image is below.
View original table image
| Storage days | Peroxide value (meq O2 / kg) | — | — |
|---|---|---|---|
| S0 | S1 | S2 | |
| 0 | 1.78±0.61 | 10.32±0.57 | 4.66±0.92 |
| 15 | 2.05±0.15 | 12.47±0.43 | 6.81±0.73 |
| 30 | 2.94±0.38 | 19.13±0.85 | 9.25±0.24 |
| 45 | 3.56±0.72 | 21.06±1.12 | 11.73±0.65 |
Table text extracted from the original PDF; superscript letters are shown inline. The original table image is below.
View original table image
Conclusion
It is concluded from the study that the new product so developed, that is the pearl millet substituted panjiri, is nutritionally rich. In comparison to the control product, the pearl millet panjiri has higher protein, ash, and fiber content. Therefore the modified panjiri is nutritionally better than the traditional panjiri. The panjiri prepared using both wheat flour and pearl millet flour in 50% composition shows average results that are better and higher than the control sample but low as compared to the panjiri with 100% pearl millet flour. The presence of pearl millet and jaggery in T 1 makes it best nutritionally out of all the three samples that were prepared. The sensory properties of T 2 , which is the panjiri with 50% wheat flour and 50% pearl millet flour, were foremost. So, it is observed that T 2 has stronger organoleptic properties than T 0 and T 1 . However, sample T 2 is better than T 1 only in terms of appearance, aroma and texture. The peroxide value of T 1 increased significantly during storage as compared to T 0 and T 2 .
There was also increase in moisture content of all the samples during storage. The moisture content and peroxide values during storage for T 2 were between T 0 and T 1 . The sensory attributes of all the panjiries also reduced during storage. Hence, it is concluded that T 1 has a lower shelf life than T 0 and T 2 . It is also noted that T 2 has an average shelf life, both in terms of moisture content or peroxide value and sensory characteristics, which is desired and well acceptable. It is concluded that the nutritional components significantly increased on substitution of wheat flour with pearl millet flour and refined sugar with jaggery powder. The investigation carried out seems to fulfill the nutritional requirements at lower costs. On the basis of the observation it is concluded that the pearl millet flour substituted panjiri could be considered the best from the overall nutritional and sensory point of view. The product is beneficial for the individuals suffering from malnutrition and anemia. It fulfills the basic nutritional demands along with providing an appetizing taste. It is overall acceptable in terms of health benefits for people suffering from malnutrition or anemia.
It also proves to be a good and 41 advantageous product for pregnant women and for postpartum healing. It has a shelf life of about 30 days. Hence, the product is said to be good in all terms and it possess good consumer acceptability.
Figures and tables from the paper
| Treatment | Symbol | Wheat flour (g) | Pearl millet flour (g) |
|---|---|---|---|
| 100% WF + 0% PMF | S0 | 150 | 0 |
| 0% WF + 100% PMF | S1 | 0 | 150 |
| 50% WF + 50% PMF | S2 | 75 | 75 |
Table text extracted from the original PDF; superscript letters are shown inline. The original table image is below.
View original table image
References
21 in the original paper- Adebiyi JA, Obadina AO, Adebo OA, Kayitesi E. Fermented and malted millet products in Africa: Expedition from traditional/ethnic foods to industrial value-added products. Crit Rev Food Sci Nutr. 2018;58(3):463-474.
- Baskran V, Mahadevamma NG, Malleshi R, Shankara B, Lokesh R. Acceptability of supplementary foods based on popped cereals and legumes suitable for rural mothers and children. Plant Foods Hum Nutr. 1999;53:237-247.
- Brand-Williams W, Cuvelier ME, Berset C. Use of a free radical method to evaluate antioxidant activity. Lebensmittel-Wissenschaft and Technologie. 1995;28:245251.
- Florence SP, Urooj A, Asha MR, Rajiv J. Sensory, physical and nutritional qualities of cookies prepared from pearl millet (Pennisetum typhoideum). J Food Process Technol. 2014;5(10):1.
- Gurwara N, Barai R. Impact of soya multigrain panjiri supplementation on haemoglobin level among women in Raipur. Int J Home Sci. 2016;2:22-24.
- Imtiaz H, Uddin MB, Gulzar MA. Evaluation of weaning foods formulated from germinated wheat and mungbean from Bangladesh. Afr. J Food Sci. 2011;5:897-903.
- Jaybhaye RV, Pardeshi IL, Vengaiah PC, Srivastav PP. Processing and technology for millet based food products: a review. J Ready to Eat Food. 2014;1(2):32-48.
- Karwasra BL, Kaur M, Sandhu KS, Siroha AK, Gill BS. Formulation and evaluation of a supplementary food (Panjiri) using wheat and flaxseed flour composites: Micronutrients, antioxidants, and heavy metals content. J Food Process Preserv. 2021;45(1):e14998.
- Kaur S, Kumar V, Kumar S, Suri S, Kaur J. Considerations for development of low-cost supplementary foods for lactating women in India-a review. Nutr. Food Sci. 2021;51(3):578-593.
- Krishnan M, Rajalakshmi PV, Kalaiselvi K. A study of protein energy malnutrition in the school girls of a rural population. Int J Nutr. Pharmacol Neurol Dis. 2012;2(2):142.
- Kumar A, Tomer V, Kaur A, Kumar V, Gupta K. Millets: A solution to agrarian and nutritional challenges. Agric Food Secur. 2018;7(1):1-15.
- Malik S. Pearl millet-nutritional value and medicinal uses. Int J Adv Res Innov Ideas Educ. 2015;1(3):414-418.
- Mani UV, Prabhu BM, Damle SS, Mani I. Glycemic index of some commonly consumed foods in Western India. Asia Pac J Clin Nutr. 1993;2:111-114.
- McDonough CM, Rooney LW, Serna-Saldivar SO. The Millets: Food Science and Technology. Handbook of Cereal Science and Technology. CRC Press, New York, Mikulajova A, Sediva D, Certik PG, Nemeth K, Hybenova E. Genotypic variation in nutritive and bioactive composition of foxtail millet. Cereal Res Commun. 2017;45(3):442-455.
- McKeown NM, Meigs JB, Liu S, Wilson PW, Jacques PF. Whole-grain intake is favorably associated with metabolic risk factors for type 2 diabetes and cardiovascular disease in the Framingham Offspring Study. Am J Clin Nutr. 2002;76(2):390-339.
- Michaelsen KF, Hoppe C, Roos N, Kaestel P, Stougaard M, Lauritzen L, et al. Choice of foods and ingredients for moderately malnourished children 6 months to 5 years of age. Food Nutr Bull. 2009;30(3_suppl3):S343-S404.
- Rani S, Singh R, Sehrawat R, Kaur BP, Upadhyay A. Pearl millet processing: a review. Nutr Food Sci. 2018;48(1):3044.
- Salve RV, Mehrajfatema ZM, Kadam ML, More SG. Formulation nutritional evaluation and storage study of supplementary food (panjiri). J Food Process Technol. 2011;2:131-136.
- Stein AJ. Global impacts of human mineral malnutrition. Plant Soil. 2010;335(1-2):133-154.
- Verma VK, Narain M. Moisture absorption isotherms of jaggery. J Stored Prod Res. 1990;26(2):61-66.
- Yadav OP. Review of pearl millet research. In: Proceedings of 46th annual pearl millet workshop of all India coordinated pearl millet improvement project (AICPMIP) on 12-14 March 2011, Hisar, Jodhpur, Rajasthan, India; c2011.