
Research article · 2024 · Full text
International Journal of Agriculture Extension and Social DevelopmentNutritional security dynamics: Investigation on consumer preferences and priorities for pork consumption in Bengaluru
Volume 7(2) · Pages 423–427 · DOI: 10.33545/26180723.2024.v7.i2f.362 ↗
Research areasFood Waste Reduction and SustainabilityRegional Development and Management StudiesAgricultural Economics and Practices
Abstract
Author-writtenThis study, conducted in Bengaluru, aimed to analyze consumer preferences for pork, utilizing a sample size of 120 respondents. Employing conjoint analysis, the research investigated key attributes influencing consumer choices, with a focus on understanding how these preferences contribute to nutritional security. The study encompassed various attributes, including the type of pork (Farm Pork vs. Country Pork), price ranges (Up to Rs. 250 per kg, Rs. 250 per kg – Rs. 350 per kg, More than Rs. 350 per kg), purchase location (Shop vs. Directly from farm), and frequency of purchase (Weekly, Fortnightly, Monthly). By utilizing conjoint analysis, the study determined utility levels and the relative importance of each attribute, particularly in the context of promoting nutritional security through pork consumption. The findings not only provide insights into factors significantly influencing consumer preferences for pork in Bengaluru but also offer valuable information for producers and marketers in the pork industry. This research contributes to a holistic understanding of how consumer choices in pork consumption can be aligned with nutritional security goals, guiding strategic initiatives for a more sustainable and health-conscious pork market in Bengaluru.
Summary
Source-checkedPlain-language reading of the full paper, prepared with AI and checked against the text. Each point links to the authors' own words.
Why it matters
- Livestock is essential for food and nutritional security because it provides nutrient-dense food products. View evidence ↗
- Pig farming is particularly promising for economic returns due to the animals' high fecundity, efficient feed conversion, and early maturity. View evidence ↗
- The pig farming sector can help ensure both nutritional and economic security for vulnerable populations. View evidence ↗
The question
- The study aims to investigate consumer preferences for pork in Bengaluru and how these preferences relate to nutritional security. View evidence ↗
What they did
- An additive conjoint model was employed to analyze consumer value judgments and preferences. View evidence ↗
- The analysis evaluated five attributes: pork type, price, purchase location, purchase frequency, and the form of the meat. View evidence ↗
What they found
- Pork type was the most influential factor, with Farm Pork showing a high positive utility of 5.500 and a relative importance of 51.250%. View evidence ↗
- Consumers preferred pork priced between Rs. 250 and Rs. 350 per kg (utility 5.20) but strongly disliked pork priced above Rs. 350 per kg (utility -9.00). View evidence ↗
- Consumers preferred buying pork from shops (utility 0.710) over buying directly from a farm (utility -0.710). View evidence ↗
- Fortnightly purchases were preferred (utility 0.580), while weekly purchases were slightly avoided (utility -0.590). View evidence ↗
- Whole dressed meat was preferred (utility 0.890) over specific parts (utility -0.890), though this attribute had the lowest overall importance. View evidence ↗
- There is a strong, statistically significant correlation between the different attributes influencing pork consumption preferences (Pearson's R = 0.542, Kendall's tau = 0.631). View evidence ↗
What it means
- The authors conclude that a holistic approach combining consumer preferences with nutritional security goals is necessary for a sustainable pork market in Bengaluru. View evidence ↗
- The authors recommend promoting awareness of pork's nutritional benefits and fostering sustainable farming to meet consumer needs and improve community well-being. View evidence ↗
Visual summary
3 visualsIllustrations explain the paper; charts are replotted from the paper's own table values.
Hierarchy of Consumer Preferences
AI-generated conceptual illustration (raw pork cuts and a retail butcher shop setting). It explains the idea and does not show study data.
View source evidence ↗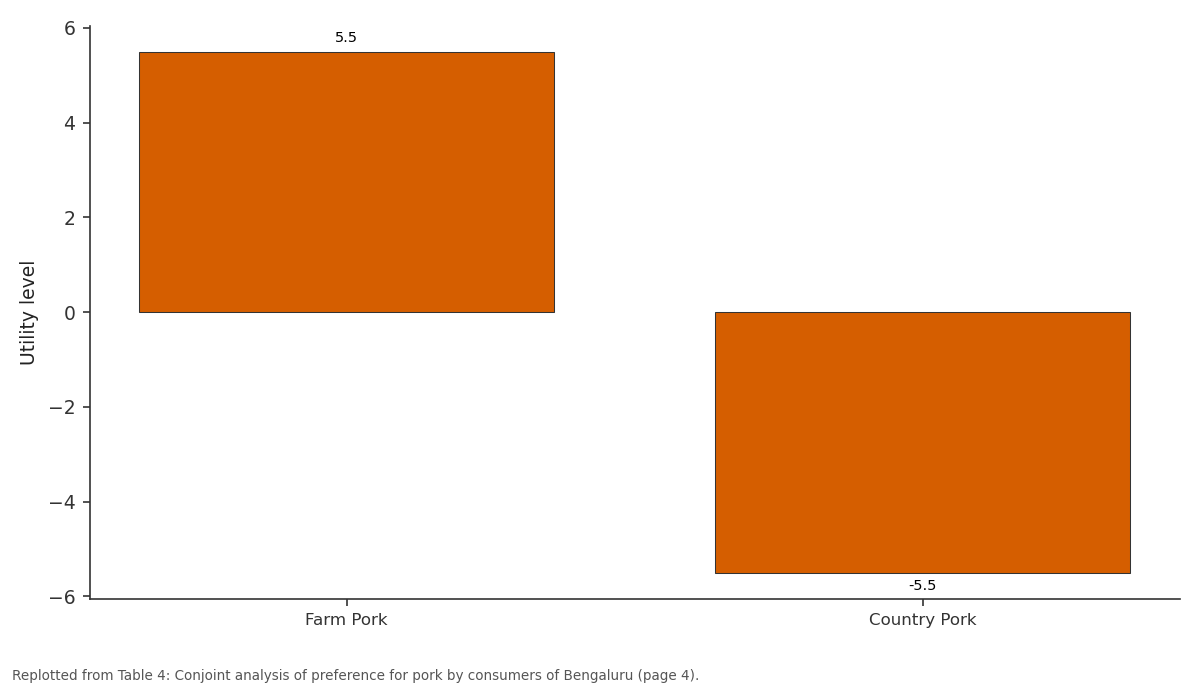
Utility level: Farm Pork vs Country Pork
Replotted from Table 4 (page 4) of the original paper. Every bar is the paper's own table value.
View source evidence ↗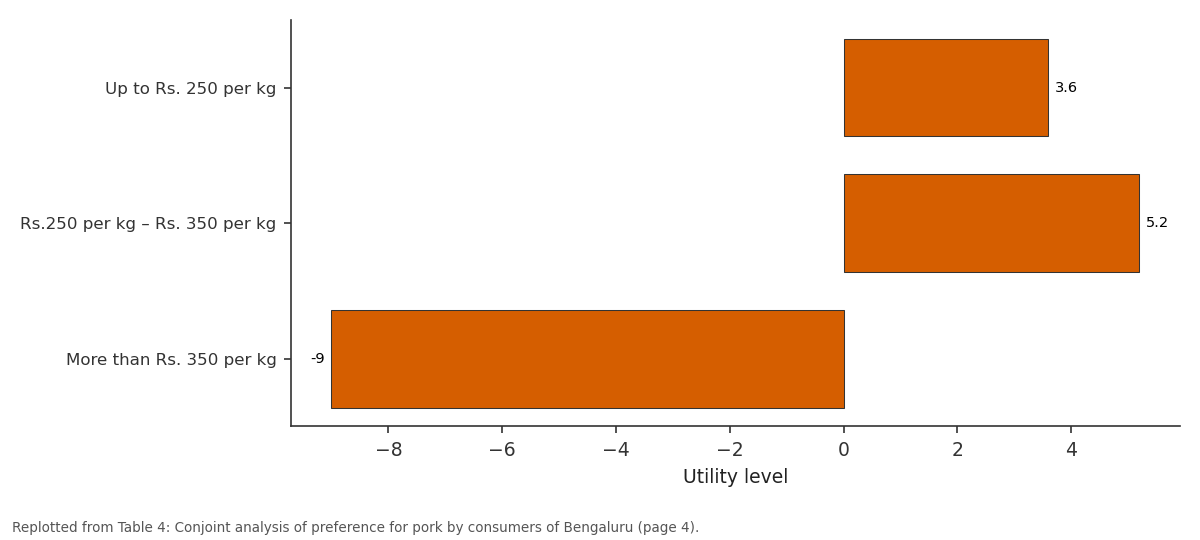
Utility level: Up to Rs. 250 per kg vs Rs.250 per kg – Rs. 350... vs More than Rs. 350 per kg
Replotted from Table 4 (page 4) of the original paper. Every bar is the paper's own table value.
View source evidence ↗Figures & tables
From the original paper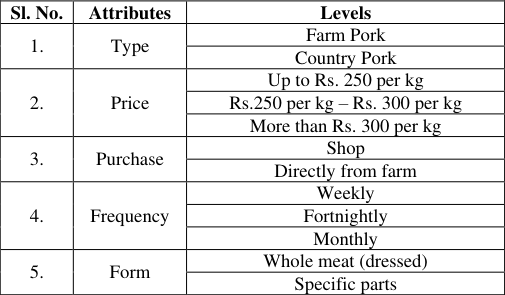 Table 1
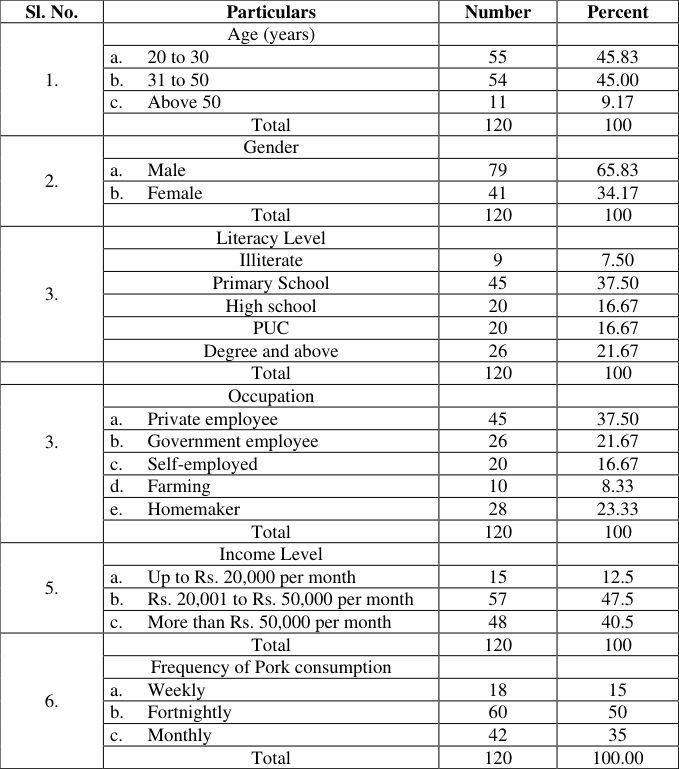 Table 2
 Table 3
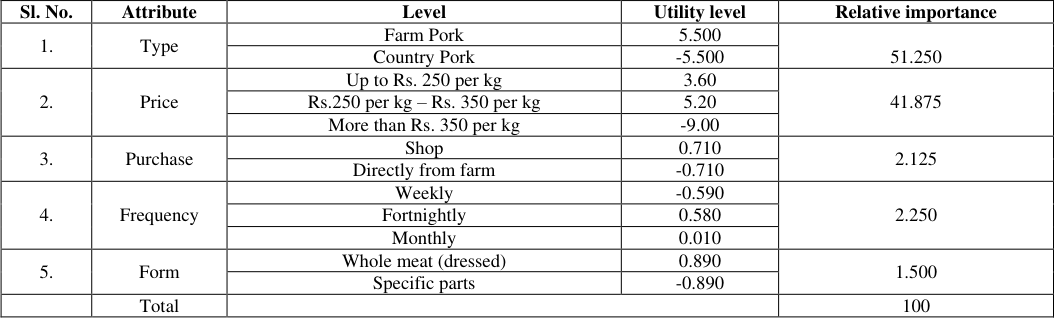 Table 4
Introduction
Livestock serves as an indispensable component of the agricultural landscape in India, contributing significantly to the growth and development of the agricultural sector. Its multifaceted impact encompasses several vital aspects. livestock plays a pivotal role in enhancing food and nutritional security by providing nutrient-rich food products. Simultaneously, it acts as a critical source of employment and income, offering a buffer against the adverse effects of crop failures. Furthermore, livestock supplies essential draft power and valuable manure for crop production activities, making it an integral part of the agricultural value chain. Pork is the most consumed meat globally. However, in India, consumption of pork is limited to few regions of the country. In India, as per 20th Livestock census, the total Pig population is 9.06. Pigs stand out in terms of their potential to provide rapid economic returns to farmers due to inherent traits such as high fecundity, efficient feed conversion, early maturity, and a short generation interval. Notably, pig farming demands relatively modest investments in infrastructure and equipment. This sector holds immense promise for ensuring both nutritional and economic security for vulnerable sections of society (Akriti et al. 2023) [1] . As per the 20th Livestock Census, the distribution of the pig population across districts in Karnataka highlights Kalaburagi district with the highest percentage share at 13.66 percent, followed by Bengaluru Urban (8.66%), Belagavi (6.73%), Bidar (6.43%), Yadgir (6.33%), Bagalkot (6.32%), Vijayapura (6.01%), and Raichur (5.06%). The remaining districts collectively contribute less than 5 percent each to the state's total pig population. Notably, Uttara Kannada district holds the lowest position with only 0.37 percent of the state's pig population. This distribution pattern underscores varying concentrations of pig farming activities across Karnataka's districts, with certain regions holding considerably larger shares compared to others. The present study is undertaken to delve into the consumer preferences for pork in Bengaluru, with a particular focus on the nutritional security aspects associated with pork consumption. This research aims to unravel the dynamics influencing consumer choices, offering insights that extend beyond mere culinary preferences to encompass the broader context of nutritional security and sustainable pig farming practices. In doing so, the study contributes to a holistic understanding of the potential role of pork consumption in addressing nutritional challenges and promoting livelihood security, especially in regions like Bengaluru.
Methodology
Methodology
Study Area
The research was undertaken in Bengaluru, deliberately chosen as the study location. The city's selection was guided www.extensionjournal.com by a purposive approach. The differentiation between urban and rural transects in Bengaluru was established using the survey stratification index (Ellen et al., 2017) [3] , which considered the percentage of built-up area and its linear distance from the city centre. Vidhana Soudha, the State legislature building, served as the benchmark for measuring this distance (Pooja and Umesh, 2021) [4] . Within approximately 20 to 25 km from the city centre, there was a robust positive correlation between building density and distance, indicating that closer proximity to the city resulted in a higher percentage of built-up area. However, beyond this range, the two parameters exhibited a negative correlation (Udaykumar and Umesh, 2019) [5] .
Sampling Framework
The research relied on primary data obtained from a sample of respondents using a pre-tested structured questionnaire through a personal survey method. A total of 120 consumers were randomly selected for the study, and data collection took place during the period of 2022-23.
Conjoint Analysis
Conjoint Analysis stands out as a multifaceted marketing research technique, offering invaluable insights into various aspects such as new product development, forecasting, market segmentation, pricing decisions, advertising, distribution strategies, competitive analysis, and repositioning. Its primary application lies in assessing consumers' value judgments. In our current study, we utilized this technique to delve into consumer preferences regarding pork. The attributes considered in a conjoint analysis experiment are reflective of crucial consumption characteristics or those hypothesized to influence purchasing behaviour. These attributes are meticulously categorized into levels, representing distinct classes within each attribute. These levels are carefully chosen to span the realistic range of each attribute. The conjoint experiment employs a comprehensive full-profile approach, specifying the level of each attribute for consumers to evaluate during the rating process. Conjoint analysis uniquely provides an overarching understanding of the relative importance that all consumer categories attach to specific factors when making purchasing decisions. This comprehensive perspective enhances our ability to tailor marketing strategies that resonate with the diverse needs and preferences of different consumer segments. The following seven steps were taken for conducting conjoint analysis: a) Establishing the attributes b) Assigning levels for each attribute c) Selecting the conjoint methodology d) Deciding which profile to present to the respondents e) Establishing preferences for each attribute f) Choosing the presentation method g) Selecting a method for part-worth estimation Based on the goodness of fit, the additive conjoint model was used in this study. The model has been formulated as:
where, Y = Consumers' overall evaluation of pork. V ij = Part-worth contribution or utility associated with the j th level (j, j=1, 2, ….., m) of the i th attribute (i, i=1, 2, …, n) X ij = Dummy variable representing the preference for the j th level of the i th attribute (one, if the j th level of the i th attribute is present, otherwise zero) n = Number of attributes m = Number of levels of attribute 'i'
For the present study, a profile describing alternatives was constructed by combining the levels of five attributes (Sreelakshmi et al, 2023) [2] . The attributes and their levels (Tables 1) were identified through discussions with consumers during preliminary survey and also in consultation with subject matter specialists, and accordingly, 16 cards were generated for consumers of pork, and the same were used for collection of information pertaining to consumer preferences in the study area. The consumers were requested to rank each card based on their preferences. The data on the frequency of pork consumption highlights the dietary habits of the sample consumers. Fifteen percent consume pork weekly, 50% consume it fortnightly, and 35% consume it monthly. These patterns offer valuable information regarding the preferences and frequency of pork consumption within the surveyed population.
In conclusion, the socio-economic characteristics and dietary habits outlined in Table 2 offer a nuanced understanding of the surveyed consumer group in Bengaluru. The data can be valuable for policymakers, researchers, and businesses seeking to tailor strategies and services to meet the diverse needs of this population.
| Sl. No. | Particulars | Number | Percent |
|---|---|---|---|
| 1. | Age (years) | ||
| a. 20 to 30 | 55 | 45.83 | |
| b. 31 to 50 | 54 | 45.00 | |
| c. Above 50 | 11 | 9.17 | |
| Total | 120 | 100 | |
| 2. | Gender | ||
| a. Male | 79 | 65.83 | |
| b. Female | 41 | 34.17 | |
| Total | 120 | 100 | |
| 3. | Literacy Level | ||
| Illiterate | 9 | 7.50 | |
| Primary School | 45 | 37.50 | |
| High school | 20 | 16.67 | |
| PUC | 20 | 16.67 | |
| Degree and above | 26 | 21.67 | |
| Total | 120 | 100 | |
| 3. | Occupation | ||
| a. Private employee | 45 | 37.50 | |
| b. Government employee | 26 | 21.67 | |
| c. Self-employed | 20 | 16.67 | |
| d. Farming | 10 | 8.33 | |
| e. Homemaker | 28 | 23.33 | |
| Total | 120 | 100 | |
| 5. | Income Level | ||
| a. Up to Rs. 20,000 per month | 15 | 12.5 | |
| b. Rs. 20,001 to Rs. 50,000 per month | 57 | 47.5 | |
| c. More than Rs. 50,000 per month | 48 | 40.5 | |
| 6. | Total | 120 | 100 |
| Frequency of Pork consumption | |||
| a. Weekly | 18 | 15 | |
| b. Fortnightly | 60 | 50 | |
| c. Monthly | 42 | 35 | |
| Total | 120 | 100.00 |
Table text extracted from the original PDF; superscript letters are shown inline. The original table image is below.
View original table image
Attributes of consumer preference for pork consumption in Bengaluru
The correlation analysis presented in Table 3 underscores the interconnectedness of key attributes influencing consumer preferences for pork consumption in Bengaluru. Both Pearson's R (0.542) and Kendall's tau (0.631) coefficients highlight a strong and statistically significant relationship among these attributes, reinforcing the reliability of the observed correlations at a five percent significance level. These findings hold considerable implications for stakeholders operating in the Bengaluru pork market. The robust correlation values signify the importance of understanding and strategically addressing specific attributes, including type, price, purchase location, frequency, and form, in order to navigate and respond www.extensionjournal.com effectively to consumer choices. Recognizing the significance of these factors becomes crucial for shaping market dynamics and devising targeted approaches to meet consumer expectations. Furthermore, the assessment of relative importance, as depicted in Table 3 through the comparison of part-worth functions within segments, elucidates the hierarchy of attribute significance. By delineating the average part-worth and the relative importance of each attribute within the Bengaluru context, this analysis offers valuable insights for stakeholders. Such insights empower stakeholders to prioritize their strategic initiatives and interventions based on a nuanced understanding of local consumer preferences and behaviours.
| Sl. No. | Correlation | Value for Pork meat consumption |
|---|---|---|
| 1. | Pearson's R | 0.542* |
| 2. | Kendall's tau | 0.631* |
Table text extracted from the original PDF; superscript letters are shown inline. The original table image is below.
View original table image
In conclusion, the correlations among consumer preference attributes presented in this study provide a solid foundation for stakeholders to make informed decisions in the Bengaluru pork market. The recognition of attribute interrelationships and their relative importance equips market players with the tools necessary to tailor their strategies, ensuring alignment with the unique dynamics of the local consumer landscape.
Conjoint analysis of preference for pork by consumers of Bengaluru
The analysis delves into the multifaceted factors shaping consumer preferences for pork in Bengaluru in Table 4, revealing insights into their purchase decisions. Notably, the type of pork emerges as the most influential attribute, with Farm Pork commanding a notably high positive utility level of 5.500. This reflects a strong inclination towards Farm Pork among consumers in the region. Conversely, Country Pork registers a significant negative utility level of -5.500, indicating a substantial aversion to this type of pork. Following the type, price constitutes the second most crucial determinant of consumer choice. Pork priced up to Rs. 250 per kg received a positive utility level of 3.60, signalling a preference for affordability within this price range. The preference escalates further for pork priced between Rs. 250 per kg and Rs. 350 per kg, with a substantial positive utility level of 5.20. However, the analysis shows a considerable aversion to pork priced above Rs. 350 per kg, reflected by a strong negative utility level of -9.00. This underscores the sensitivity of consumers towards higher-priced pork in this market. In terms of purchase preferences, buying from a shop exhibits a positive utility level of 0.710, indicating a preference for purchasing pork from retail outlets. Conversely, purchasing directly from a farm yields an equivalent negative utility level of -0.710, suggesting a relative aversion to this mode of purchase among consumers in Bengaluru rural. Frequency of purchase also influences preferences, albeit to a lesser extent. While weekly purchases exhibit a negative utility level of -0.590, indicating a slight aversion, fortnightly purchases garner a positive utility level of 0.580, suggesting a preference for this frequency. Monthly purchases, with a utility level of 0.010, exhibit the least influence, indicating a neutral stance regarding monthly procurement of pork. Regarding the form of pork, whether whole meat (dressed) or specific parts, this attribute demonstrates relatively minor importance. Opting for whole meat (dressed) indicates a positive utility level of 0.890, signifying a preference for this form. Conversely, choosing specific parts of the pork registers an equivalent negative utility level of -0.890, suggesting a relative aversion to this form. The form attribute, however, carries the lowest relative importance among all attributes, implying its limited impact on overall pork preferences in Bengaluru.
| Sl. No. | Attribute | Level | Utility level | Relative importance |
|---|---|---|---|---|
| 1. | Type | Farm Pork | 5.500 | 51.250 |
| Country Pork | -5.500 | |||
| 2. | Price | Up to Rs. 250 per kg | 3.60 | 41.875 |
| Rs.250 per kg – Rs. 350 per kg | 5.20 | |||
| More than Rs. 350 per kg | -9.00 | |||
| 3. | Purchase | Shop | 0.710 | 2.125 |
| Directly from farm | -0.710 | |||
| 4. | Frequency | Weekly | -0.590 | 2.250 |
| Fortnightly | 0.580 | |||
| Monthly | 0.010 | |||
| 5. | Form | Whole meat (dressed) | 0.890 | 1.500 |
| Specific parts | -0.890 | |||
| Total | 100 |
Table text extracted from the original PDF; superscript letters are shown inline. The original table image is below.
View original table image
Conclusion
These findings carry significant implications for stakeholders in the Bengaluru pork market, emphasizing the need for a nuanced understanding of consumer choices. The study not only highlights the importance of specific attributes but also provides a hierarchical perspective through the assessment of relative importance using partworth functions. This information empowers stakeholders to prioritize strategic initiatives based on a deeper understanding of local consumer preferences, enabling them to navigate the market dynamics effectively. By recognizing the interplay of attributes and their relative www.extensionjournal.com significance, market players can tailor their approaches to align with the unique dynamics of Bengaluru's consumer landscape. In essence, this research serves as a valuable resource for informed decision-making, offering actionable insights that can guide strategic interventions and initiatives to meet the evolving needs and preferences of consumers in the Bengaluru pork market. The interplay of consumer preferences, as uncovered in this study, offers a nuanced understanding that can guide strategic interventions aimed at promoting both the local pork market and nutritional well-being. By fostering sustainable pig farming practices and promoting awareness regarding the nutritional benefits of pork, stakeholders can not only meet consumer expectations but also contribute to the overall well-being of the community. In essence, this study advocates for a holistic approach that intertwines consumer preferences with the broader goal of nutritional security, thereby paving the way for a more resilient and sustainable future in the realm of pork consumption in Bengaluru.
Figures and tables from the paper
| Sl. No. | Attributes | Levels |
|---|---|---|
| 1. | Type | Farm Pork |
| Country Pork | ||
| 2. | Price | Up to Rs. 250 per kg |
| Rs.250 per kg – Rs. 300 per kg | ||
| More than Rs. 300 per kg | ||
| 3. | Purchase | Shop |
| Directly from farm | ||
| 4. | Frequency | Weekly |
| Fortnightly | ||
| Monthly | ||
| 5. | Form | Whole meat (dressed) |
| Specific parts |
Table text extracted from the original PDF; superscript letters are shown inline. The original table image is below.
View original table image
References
6 in the original paper- Akriti A, Singh BP, Mahesh C, Suman RS, Singh YP. Study of Pashu-Vigyan Incubator in Income and Employment Generation among Pig Entrepreneurs. Journal of Community Mobilization and Sustainable Development. 2023;18(1):174-178.
- Sreelakshmi A, Girish MR, Mamatha Girish. Consumer Preference for Broiler Meat in Urban and Rural Transects of Bengaluru South -A Conjoint Analysis Approach. Mysore Journal of Agricultural Science. 2023;57(1):367-373.
- Ellen MH, Monish J, Nils N, Thomas M. Construction and use of a simple index of urbanization in the ruralurban interface of Bangalore, India. Sustainability. 2017;9(11):1-21.
- Pooja, Umesh KB. Why do farm households migrate? Evidence from rural-urban interface of Bengaluru. Mysore Journal of Agricultural Sciences. 2021;55(3):132-141.
- Udaykumar MS, Umesh KB. Investment and crop diversity: Empirical evidence from rural-urban interface of Bengaluru. Current Journal of Applied Science and Technology. 2020;39(30):1-10.
- Veerabhadrappa Bellundagi, Umesh KB, Roopa HS, Ravi SC. Application of conjoint analysis for consumer preference evaluation in ragi in Karnataka. Indian Journal of Economics and Development. 2016;4(10):16.