
Research article · 2024 · Full text
International Journal of Agriculture and NutritionSensory and texture profile analysis of yellow and white fleshed fruit leathers dried using a tunnel solar dryer in Cedara, KwaZulu-Natal, South Africa
Volume 6(1) · Pages 19–30 · DOI: 10.33545/26646064.2024.v6.i1a.135 ↗
Research areasTree Root and Stability StudiesGreenhouse Technology and Climate ControlSensory Analysis and Statistical Methods
Abstract
Author-writtenDrying of fruits into leather is one of popular methods that many household growers of fruits and vegetables employ in order to preserve their fresh produce. This study aimed to process peach fruit into leather using the tunnel solar dryer instead of open sun drying. Peach landraces were processed into leathers. Qualities of leather were determined objectively and subjectively. The experiment revealed that white leather moisture was approximately 7% and received the lowest overall acceptability scores from panellists and less quality results from the texture profile analysis using Instron. In contrast, the yellow peach leather was approximately 13% moisture content, and received the highest overall acceptability scores by panellists and texture profile analysis result. Thus, this study suggests that drying is possible in the KwaZulu-Natal Midlands. The product being dried should be removed during the night since there is high moisture with a potential to rewet the product. Furthermore, leather thickness has effects on the quality of the final products and leather processors should ensure uniformity. A 2 mm thickness of the peach slice was used in this study. Yellow peach leather appeared to be appetizing to the panellists because of its yellow colour compared to white peach leather.
Summary
Source-checkedPlain-language reading of the full paper, prepared with AI and checked against the text. Each point links to the authors' own words.
Why it matters
- Small-scale peach farmers in KwaZulu-Natal face significant postharvest losses, estimated at 45-50%, due to the highly perishable nature of the fruit and overabundance during short harvest windows. View evidence ↗
- Traditional open-air drying is often unreliable because it can lead to non-uniform drying and contamination from dust or insects. View evidence ↗
- Tunnel solar drying is viewed as a more efficient alternative to open-sun drying for utilizing solar energy. View evidence ↗
The question
- The study aimed to determine if a tunnel solar dryer could effectively produce peach fruit leather in the mist-belt region of the KwaZulu-Natal Midlands. View evidence ↗
What they did
- The researchers used a split-split plot design with 30 units for sensory analysis by 15 panellists and 30 units for objective texture analysis using an Instron machine, covering both white and yellow peach leathers. View evidence ↗
- The tunnel solar dryer was built from galvanized iron bars and 200-micron transparent plastic film, measuring 7 m in length, 2.95 m in breadth, and 2.65 m in height. View evidence ↗
- Peach slices were prepared with a uniform thickness of 2 mm for the leather production. View evidence ↗
What they found
- During daylight hours in the tunnel, temperatures ranged from 22 °C to 51 °C, while relative humidity varied between 20% and 70%. View evidence ↗
- The final moisture content differed significantly between the two types, with white leather at 7.69% and yellow leather at 13.33%. View evidence ↗
- Objective texture analysis showed that white peach leather was significantly harder than yellow peach leather. View evidence ↗
- Sensory panellists preferred the color of the yellow peach leather (scores 6-7) over the white peach leather (average score 5.6). View evidence ↗
- No microbial spoilage was detected in the finished leather products, with colony forming units recorded as nil. View evidence ↗
What it means
- The authors conclude that tunnel solar drying is a viable method for the region because the tunnel creates a warmer, drier environment than the surrounding ambient air. View evidence ↗
- The authors recommend removing products from the dryer at night to prevent rewetting due to high nocturnal humidity. View evidence ↗
- The authors note that leather thickness impacts final quality, highlighting the need for strict uniformity during processing. View evidence ↗
Visual summary
3 visualsIllustrations explain the paper; charts are replotted from the paper's own table values.
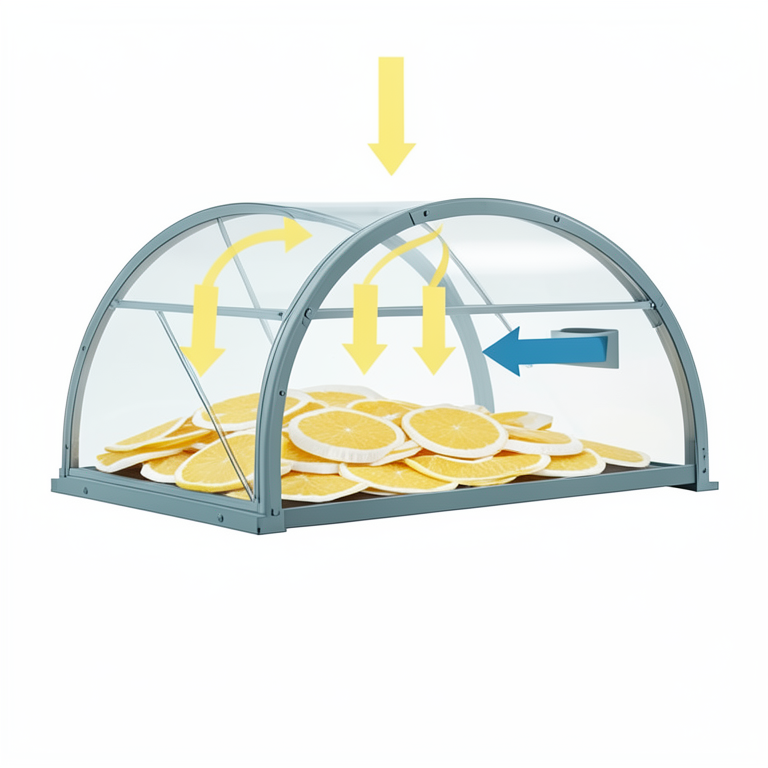
Tunnel Solar Dryer Greenhouse Effect
AI-generated conceptual illustration (tunnel solar dryer with yellow and white fruit leather slices). It explains the idea and does not show study data.
View source evidence ↗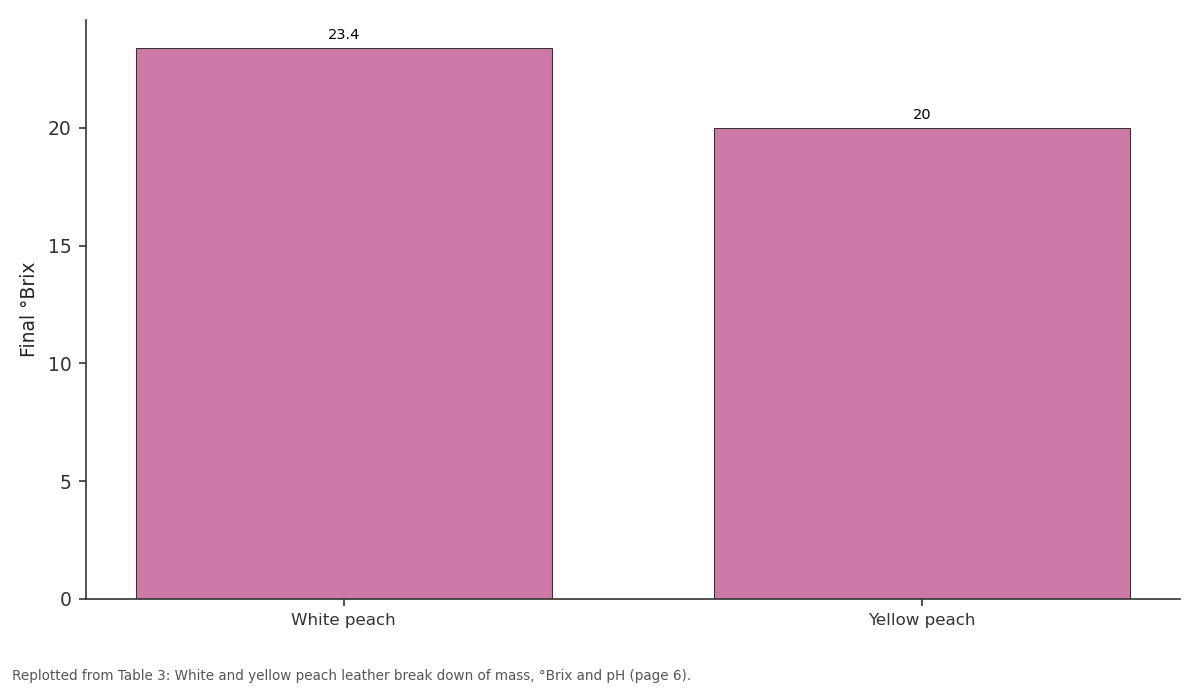
Final °Brix: White peach vs Yellow peach
Replotted from Table 3 (page 6) of the original paper. Every bar is the paper's own table value.
View source evidence ↗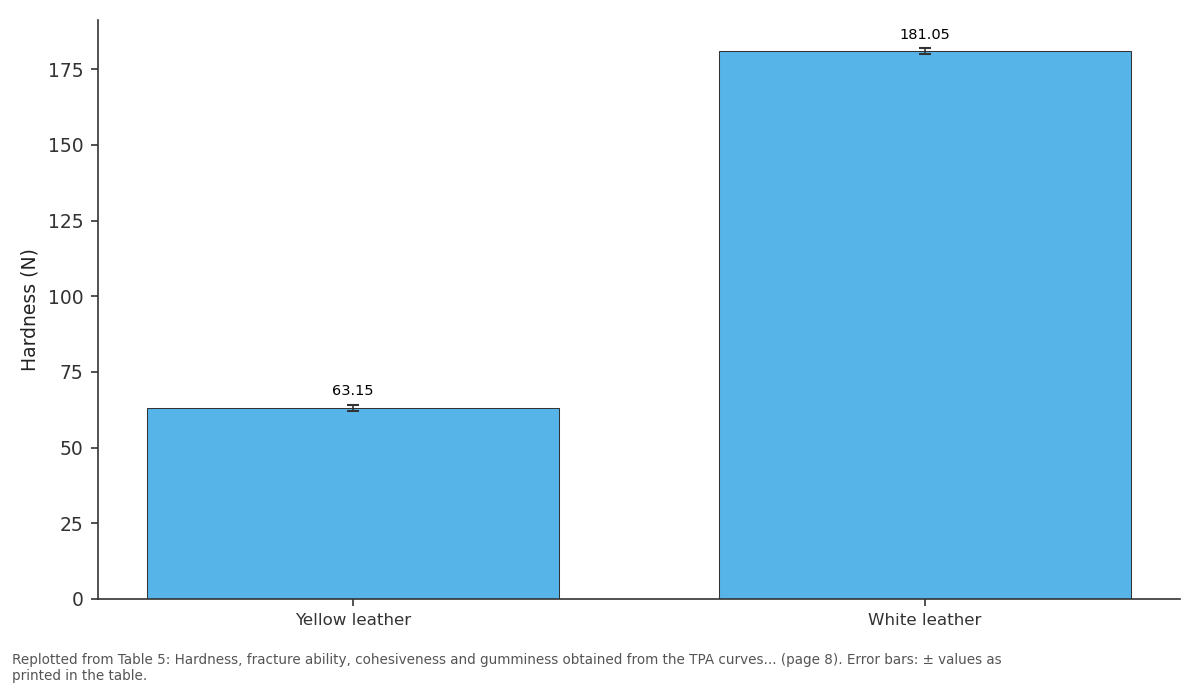
Hardness (N): Yellow leather vs White leather
Replotted from Table 5 (page 8) of the original paper. Every bar is the paper's own table value.
View source evidence ↗Figures & tables
From the original paper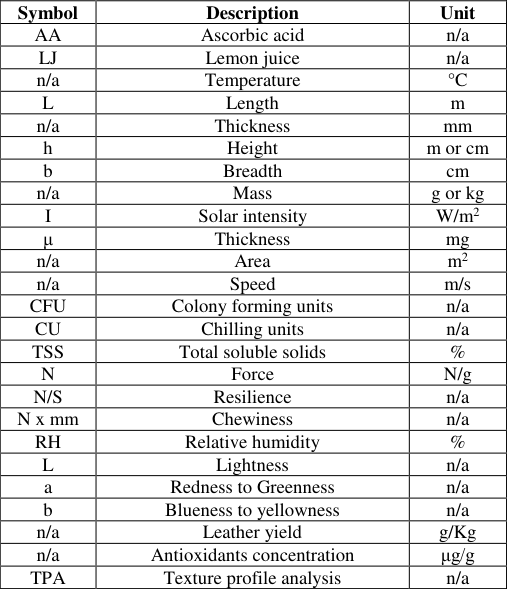 Table 1
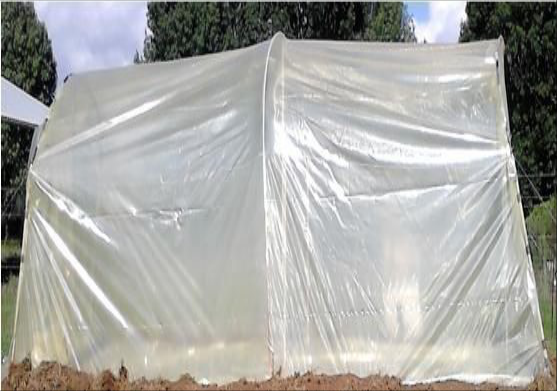 Figure 1
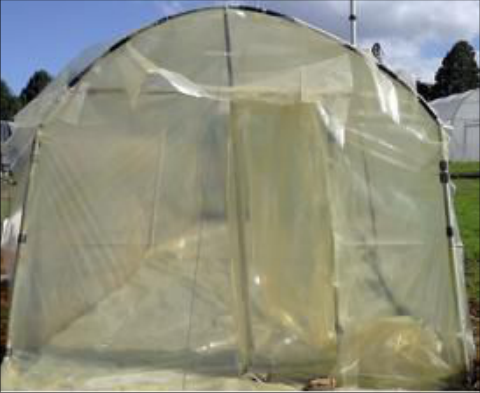 Figure 1
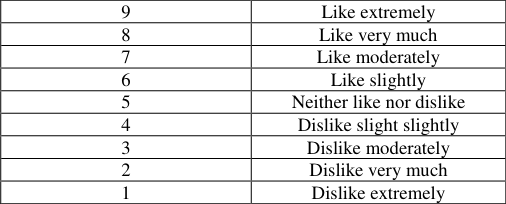 Table 2
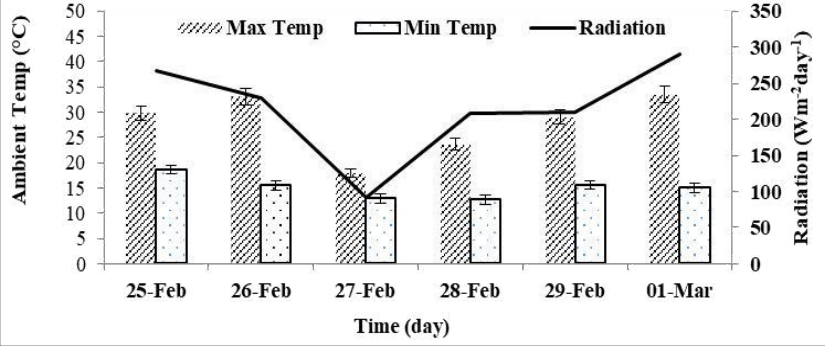 Figure 2
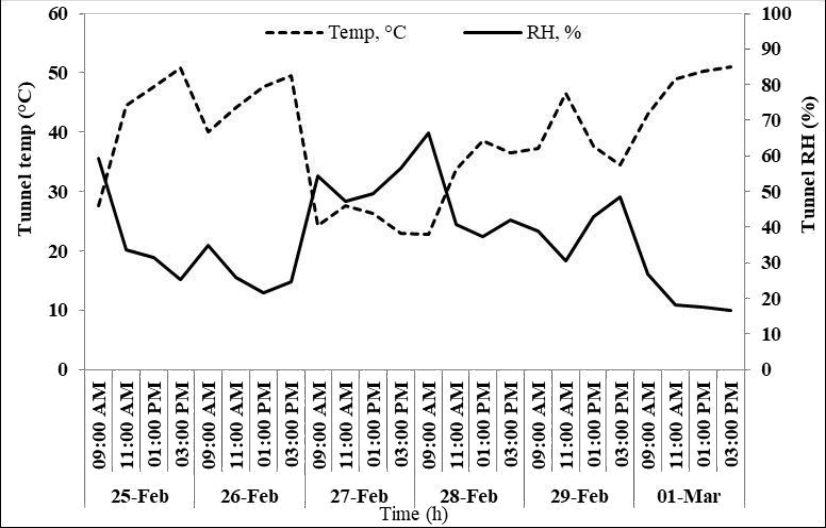 Figure 3
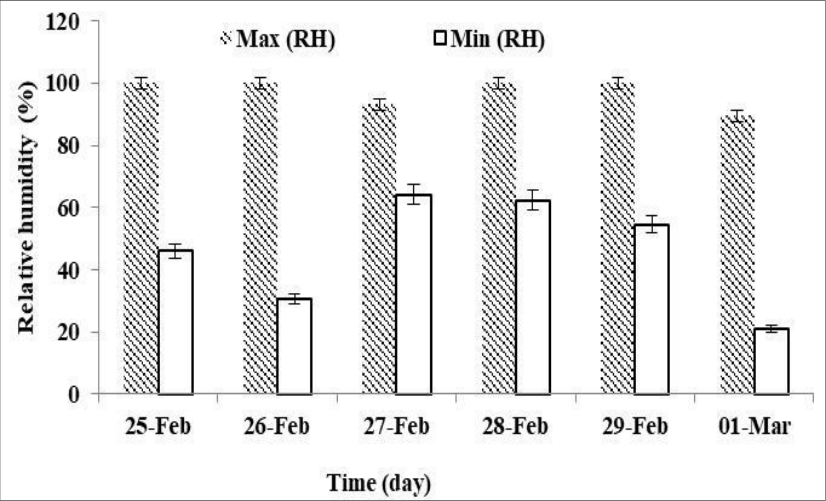 Figure 4
 Table 3
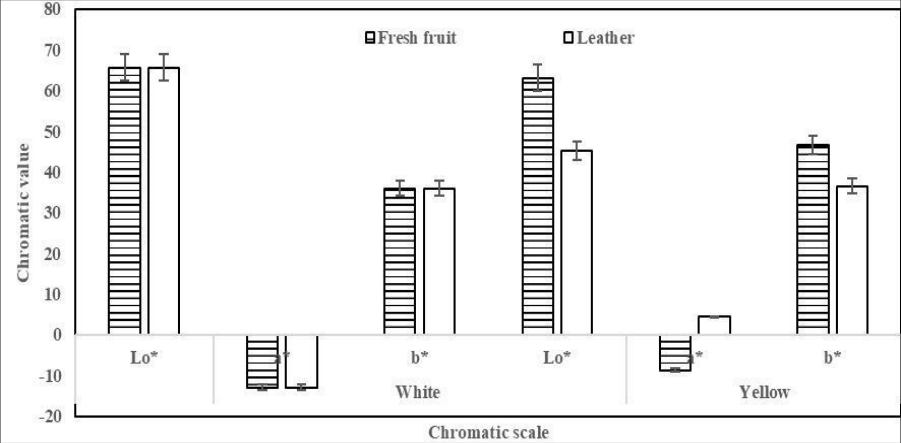 Figure 5
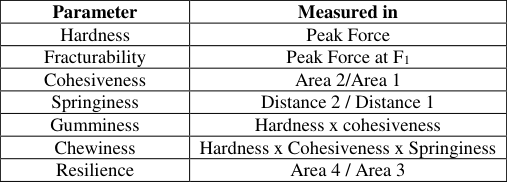 Table 4
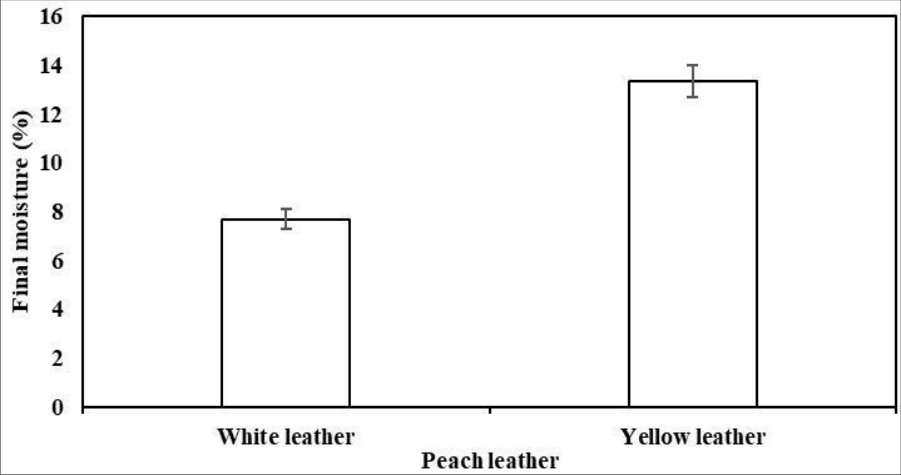 Figure 6
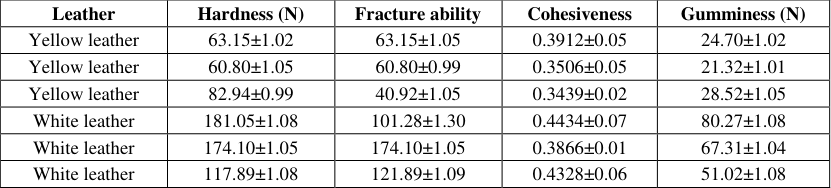 Table 5
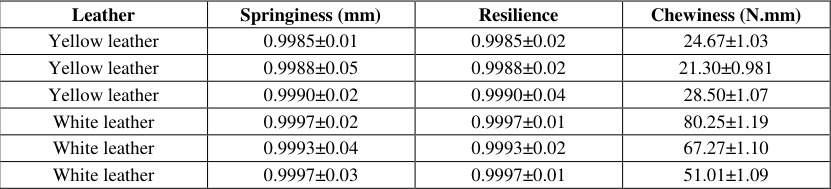 Table 6
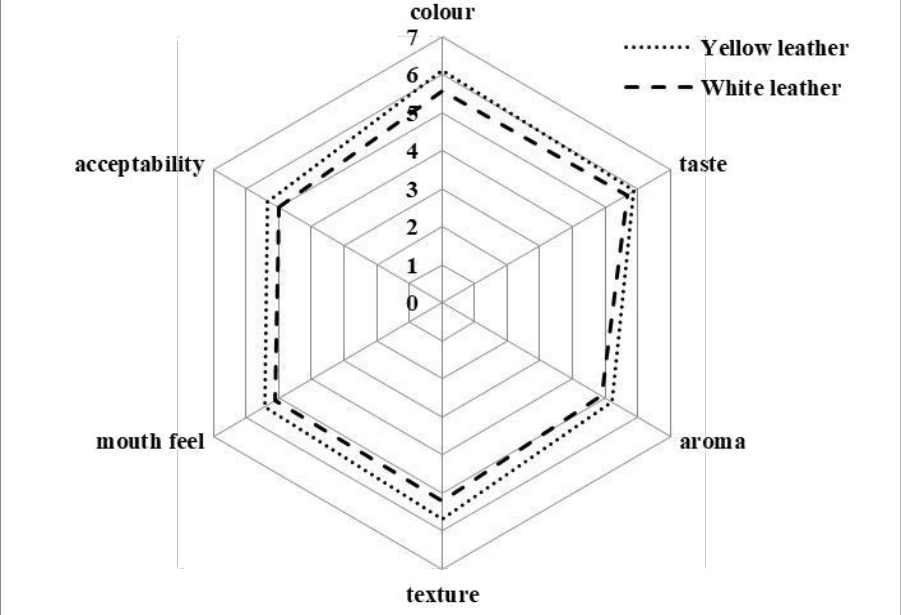 Figure 7
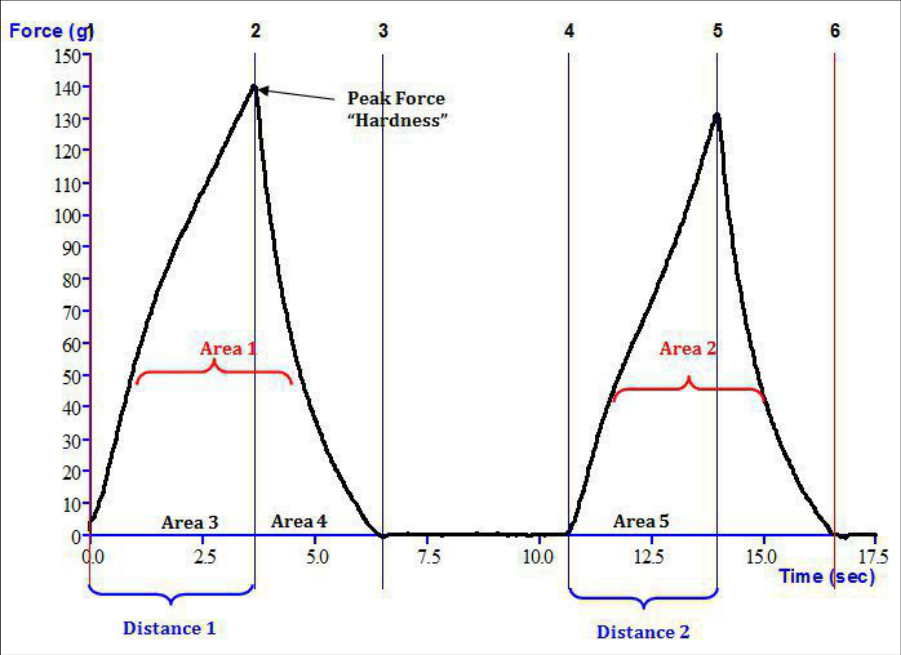 Figure 8
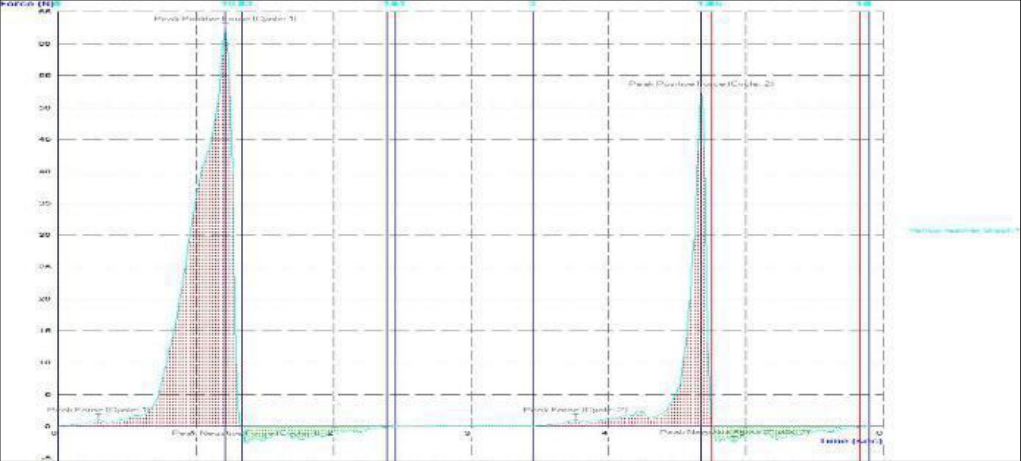 Figure 9
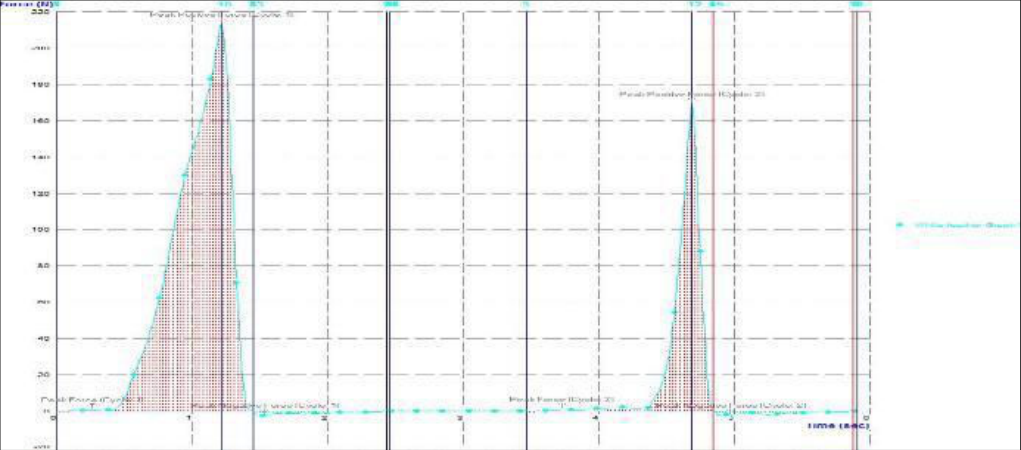 Figure 10
Introduction
Studies have shown that rural dwellers in the Sub-Sahara African countries, such as South Africa's KwaZulu-Natal province, harvesting fruits from forests and their small household gardens can avoid poverty by producing and consuming their own food, while creating employment opportunities and generating income through processing and value addition (Mithöfer and Waibel, 2004; Saka, Swai, Mkonda et al., 2004) [21,30] . Rural households in this region produce many fruit types such as oranges, avocados, peaches, lemons, apples, marula, banana, mango, litchi, apple, nectarine, pawpaw etc. However, unemployment, hunger, poverty, malnutrition and postharvest losses are still some of the persisting issues faced by these communities. Fruits have important effects towards the nutritional and economic value of all crops in the world (Ofori et al., 2014) [25] . Malnutrition is prominent in South Africa (especially in children). Fruit and vegetable consumption is well below global average. Solving nutrition and food security problems in this country, requires a range of interconnected approaches and appropriate postharvest handling and processing which play a major role in reducing food losses (Ofori et al., 2014) [25] . Peach fruit is produced by the rural small-scale sector in KwaZulu-Natal. It is grown in the backyards or small gardens. Regardless of its nutritional value, growers face major postharvest losses during the picking season. The major challenge is the inability of the farmers to cope with overabundant and highly perishable produce during the short harvest periods (December to March/April) which leads to approximately 45-50% of postharvest losses (Wafula et al., 2016) [34] . Shackleton et al., (2000) [31] , stated that, most research efforts of fruit trees produced by the rural small-scale sector in Southern Africa has been orientated towards the use of indigenous woodlands, especially in communal areas surrounding rural villages and households. Limited research has been directed towards the processing of the growers' produce, as a result, lack of such research has led to great fruit losses.
In order to deal with overabundant supply of peach at a short period, it is very important for farmers to harvest at the correct time and process their fruits using traditional and affordable methods into other products that can be used at later as the fruit is highly perishable. Products such as dried leather are among many other products that are important for value addition, which farmers can process using extra produce that remains after fresh consumption. Processing steps are simple and when coupled with solar energy, it becomes the most affordable method of food preservation. Table 1 below displays symbols and nomenclature used in this report. . According to Huang, and Hsien, (2005) [15] , fruit leather is an economic and convenient value-added substitute for natural fruits as a source of variety of nutrient elements, especially vitamin C, and more importantly, it can be a useful outlet for low-grade fruits and by-products left during fruit processing, since it has less calories than most of the snacks. Fruit leather is made by drying fruit puree on a flat surface in an oven, desiccator or indirect solar dryer. A simple technique for preparing fruit leather is to wash, peel, pulp and however if required the fruit should be pre-treated or cooked drying the leather. There are various methods to prepare puree such as those described by Imre, (2007) [16] ; Raab, and Oehler, (2000) [28] , as cold or hot break methods. Cold-break is when the fruit is pureed first and then cooked in a boiler for 10 minutes then dried. A hot-break is whereby the fruit is chopped into pieces and steamed for 15 minutes, pureed and then dried.
| Symbol | Description | Unit |
|---|---|---|
| AA | Ascorbic acid | n/a |
| LJ | Lemon juice | n/a |
| n/a | Temperature | °C |
| L | Length | m |
| n/a | Thickness | mm |
| h | Height | m or cm |
| b | Breadth | cm |
| n/a | Mass | g or kg |
| I | Solar intensity | W/m2 |
| μ | Thickness | mg |
| n/a | Area | m2 |
| n/a | Speed | m/s |
| CFU | Colony forming units | n/a |
| CU | Chilling units | n/a |
| TSS | Total soluble solids | % |
| N | Force | N/g |
| N/S | Resilience | n/a |
| N x mm | Chewiness | n/a |
| RH | Relative humidity | % |
| L | Lightness | n/a |
| a | Redness to Greenness | n/a |
| b | Blueness to yellowness | n/a |
| n/a | Leather yield | g/Kg |
| n/a | Antioxidants concentration | μg/g |
| TPA | Texture profile analysis | n/a |
Table text extracted from the original PDF; superscript letters are shown inline. The original table image is below.
View original table image
Preservation of food such as fruits, spices, herbs, meat and vegetables by sun open-air drying is one of the first technological activities undertaken by human kind (Imre, 2007; Banout, and Ehl, 2010) [16,4] . There are disadvantages related to open-air drying of food such as contamination by insects and dust or spoilage due to adverse weather changes, drying may not be uniform (Chavda and Kumar, 2009; Maiti et al., 2011) [8,17] . Due to increasing costs of electricity and fuel, the application of solar energy in drying is one of the solutions to avoid expensive mechanical dryers (Munir et al., 2013) [23] . Tunnel solar drying can be considered as an advancement of natural open-sun drying and it is a more efficient technique of utilizing solar energy (Janjai et al., 2009) [18] . Texture plays an important role in food. It is defined as the sensory expression of food structure and the way in which structure reacts to the forces applied and represents the connection of all the mechanical, geometric, and superficial attributes of a product that are sensed through mechanical, visual, tactile, and hearing receptors (Szczesniak, 1963a, 1963) [32] . Texture can be measured by means of objective (instrumental) and intrinsic subjective (Sensory) tests (Paula and Conti-Silva, 2014) [27] . Correlation between sensory and instrumental measurements of texture result. a) Finding instruments for quality control of food in industries. b) Predicting consumer response, as the degree of favourability and the overall acceptance of a new product. c) Understanding what is being sensed and perceived in the mouth during the sensory assessment of texture; d) Improving or optimizing instrumental methods to complement the sensory evaluation (Szczesniak, 1987) [33] .
It is important to link the sensory analysis to the instrumental tests to match the results of both quality analysis methods of products, as this will help improve the quality. The aim of the study was to prepare and dry peach fruit into leather using tunnel solar dryer, white and yellow flesh peach landraces produced at Impendle in KwaZulu-Natal, South Africa.
Problem statement
According to Mkhathini et al., (2018) [35] , agricultural researchers are mainly focusing on production, be it meat, fruit or vegetable. After several visits to Impendle, under UMgungundlovu District in KwaZulu-Natal, it was clear that farmers lose their peach fruit produce. The Extension Services Office also approached the research while attending farmers in the field, to come together and curb such peach fruit losses. Due to significant losses of peach fruit and lack of processing techniques and facilities of the fruit in KwaZulu-Natal Midlands, and the fact that open sun drying may not always be a possibility due to unpredictable weather conditions and high moisture content. The aim of this study was to investigate drying conditions in season one and test whether or not in the mist-belt of the Midlands in KwaZulu-Natal tunnel solar dryer could be used to dry peach fruit into leather products. However, drying has no limits to only peaches other food commodities such vegetables, mushroom and other fruit types available in the region and can be dried for preservation and value addition.
Objectives of the study 1. The study aimed to test performance of tunnel dryer by day and night relative humidity and temperature. 2. The study aimed to dry and test white and yellow peach leather using panellists and Instron machine for subjective and objective results and comparisons of the two.
Hypothesis of the study
Null: Due to high humidity in the midlands of KwaZulu-Natal, leather processing using tunnel solar dryer is not feasible.
Materials and Methods
The study used a split-split plot design with a total 15 (5 samples and 3 replications) sampling units for white and 15 sampling units for yellow leather (30) analysed by 15 panellists, further split into another 15 white and 15 yellow (5 samples and 3 replications) (30) to by analysed by the Instron and a total of 60 units were analysed for both yellow and white leathers and Gestate was used to conduct Anova and pairwise comparisons where there were requirements using Tukey's honest test. Tunnel Temperature (T) and Relative Humidity (RH) were determined using four HOBO Pro v2 onset data loggers installed in a tunnel and were moved around to different locations of the tunnel to determine any variation in temperature and RH (Nishizaki and Carrington, 2014) [24] . In order to determine ambient temperature and RH, a Campbell Scientific CR10 Data Logger according to Gush (2008) [14] , installed in the local weather station was used. The site where the fruit was handpicked is located at a smallscale peach farming community in Impendle. The area is at an elevation of 1420 m above sea level, with annual average temperature ranging between 12 and 16 °C, characterized by 800-900 annual average CU (Camp, 1999) [5] . After harvesting, the diseased, spotted and bruised fruits were removed before the fruit was washed and processed. After washing, fruits were peeled, cut into thin slices then blended and pureed by steam blanching for 10 min to avoid browning. The puree was smashed, poured and spread into wooden trays with a food grade plastic lining to avoid sticking and absorption of unwanted wood properties. The puree was dried in a tunnel solar dryer as explained below. Batches of 622 g white and 630 g yellow fleshed peach samples were dried at a tunnel solar dryer. The number of days depended largely on the ambient temperature, solar radiation and relative humidity parameters. However, the area where the leather was being processed is the mist-belt. The leather pulp was dried for four days in a tunnel solar dryer. The Total Soluble Solids (TSS) were determined using a refractometer (Atago, Model PR -1 , Tokyo, Japan). The pH was determined using a pH meter (Hanna Instruments, Johannesburg, South Africa). Colour was determined using a Hunter Lab Colour Flex EZ Spectrophotometer (Model: 45/0 145 LAV, Reston, VA, USA). Processed products measurements were replicated three times. Fifteen trained panellists volunteered to conduct taste testing on peach leather for both yellow and white products. From one being the best to nine being the worst the panellists gave scores (Table 2). The organoleptic evaluation of peach leather samples was carried out according to standard methods used by Amerine et al., (1965) [3] ; Chavan and Shaik, (2015) [7] , on a 9-point Hedonic Scale. Sealable, non-perforated transparent food grade plastic bags were used to package dried 50 g leather and stored at room temperature around 25 °C. Microbial counts were recorded according to Chavan and Shaik, (2015) [7] , as CFU. Texture profile measurements for white and yellow peach leather products were conducted following a method used by Cherono et al., (2016) [9] using a stable microsystems texture analyser (TA. XT plus, stable microsystems, Godalming, Surrey, UK). The texture analyser had a load cell capacity of 30 kg and data processed and recorded by Exponent® system software (TA. XT plus, stable microsystems, Godalming, Surrey, UK). Leather texture was processed using a Warner-Bratzler Blade with a double compression cycle test performed to 50% compression and extension forces according to a method used by (Cherono et al., 2016) [9] . Pre-test speed was 2 mm/s, test speed was 5 mm/s, post-test speed was 5 mm/s distance 30 mm, and trigger force and was 10 g. Experiments were conducted at room temperature 25 °C. From the resulting force-time curves, the following parameters were obtained: Hardness (N), springiness (mm), cohesiveness (dimensionless), gumminess (≡hardness x cohesiveness [N]), chewiness (≡gumminess x springiness [N mm]), adhesiveness (N s -1 )
| 9 | Like extremely |
|---|---|
| 8 | Like very much |
| 7 | Like moderately |
| 6 | Like slightly |
| 5 | Neither like nor dislike |
| 4 | Dislike slight slightly |
| 3 | Dislike moderately |
| 2 | Dislike very much |
| 1 | Dislike extremely |
Table text extracted from the original PDF; superscript letters are shown inline. The original table image is below.
View original table image
and resilience (dimensionless). Statistical data analysis was carried out using the GenStat 14 th version statistical package for the analysis of variance (ANOVA) for each of the parameters measured. Significant differences were set at p< 0.05 and a multiple range Tukey's test was applied to separate the means.
Results and Discussion
Ambient temperature and solar radiation were determined and displayed in Fig. 2. During the daytime, short wave radiation gets trapped inside the dryer by passing through polythene sheet and thus provides heat in the dryer (Rajkumar et al., 2017) [29] . There were significant differences between the conditions in the tunnel compared to the ambient environment. During the drying period, solar radiation became less and reached slightly below 100 Wm -2 /day -1 , as it was cloudy during the first three days. It then began to increase in the next three days until it reached approximately 300 Wm -2 /day -1 . A reduction in solar radiation caused by cloud cover had a stronger effect in the reduction of temperature to 13 °C with a slight increase in relative humidity (70%) during the day and thus increased the number of drying days as less moisture was removed from the product surface, slight rewetting of the leather products was possible. Castro-Vazquez et al., (2016) [6] , found that a decrease in radiation level leads to insufficient energy capture by the drying panel that heats the drying air meaning less radiation causes poor drying conditions in solar drying. Since Fig. 2 displays a decreasing solar radiation, however, there was greenhouse effects in the tunnel and the temperature remained above the ambient temperature. The relative humidity has a strong negative relationship and dependency onto temperature. Fig. 3 shows results of tunnel testing trend that as temperature increased, relative humidity was reduced. The lowest daylight relative humidity was 20% and the highest daylight relative humidity was 70%. The lowest and highest daylight temperatures were 22 °C and 51 °C respectively. The higher the temperature the lower the relative humidity and the lower the temperature means the higher the relative humidity. The night ambient relative humidity as displayed in Fig. 4 remained the highest, closer to 100% RH; this is because of the misty conditions most of the nights, and could have an influence on rehydration of the product being dried in the tunnel, even though, the tunnel remained closed during the night. These temperature and relative humidity recorded in and out of the tunnel are all related. The tunnel temperature and relative humidity conditions are affected by the ambient the environment. Cloud cover reduces the amount of solar radiation reaching the tunnel surface, consequently reducing the temperature. When temperature is reduced, relative humidity slightly increases. When there is less heat to remove moisture on the surface of the product being dried and the ambient air is slightly saturated, and then there is less movement of moist air to escape out of the tunnel. When the product being dried remains in the tunnel under moist conditions for too long, mould and other contaminations may begin to develop. However, in the current study there was no mould development. Even though the temperature may have been reduced, the tunnel conditions were still warm enough to allow the product to dry within four days. The third drying day (Fig. 3) displays unfavourable conditions, during this period RH increased while temperature was reduced, favouring contamination. Ideal conditions include high temperature and low relative humidity. Castro-Vazquez et al., (2016) [6] , also explained that decreasing relative humidity while the temperature is raised, increases the drying rate. The relative humidity measurements recorded at night were close to a 100%. This is one of the disadvantages of drying in the mist belt, but by removing and covering the product overnight, drying in this area is possible due to daylight warm temperatures. The values of a* represent the redness and the greenness of the food sample and range from -60 for green to +60 for red. The values of b* represent the blueness and yellowness of the food sample and range from -60 for the blue and 60 for the yellow. For white peach, there was no significant change (p>0.05) before or after drying for L*, a* and b*. However, for the yellow peach fruit both L* and b* decreased significantly whereas a* significantly increased. There were no significant differences (p>0.05) for L* before processing for both yellow and white, but after processing L* for yellow significantly decreased, while L* for white remained stable. The chromatic scale a* was significantly higher (p≤0.05) for fresh yellow fruit and further increased after processing into leather. Chromatic scale b* was significantly higher (p≤0.05) for the yellow fresh, but after leather processing it was significantly reduced (p≤0.05), while it remained similar to white leather b* for both before and after processing. It has been previously explained that a loss of AA in dried fruit caused by the presence of furaldehyde and 5-(hydroxymenthly) furaldehyde as the two main compounds that degrade ascorbic acid. After degradation of AA dried product colour changed due to polymerization and oxidation of phenolic compounds that bring in new colour pigments to the product (Kanner et al., 1981) [19] ; Gupta et al., 2016) [13] .
Changes in the chromatic scales may be associated with the reduction of AA as explained above. In addition, nonenzymatic browning such as Maillard reaction could best explain such colour changes, whereby it is defined as the action of amino acids and proteins on sugars (Gupta et al., 2016) [13] . The yield of leather was 398 g/Kg for yellow fruit and 457 g/Kg for white fruit as displayed in Table 3. These authors Chavan and Shaik, (2015) [7] reported yields that ranged between 617 -625 g/Kg for guava fruit leather. The results obtained from the current study showed low pulp yields compared to what Gupta et al., (2016) [13] reported, this could have been as a result of different peeling and coring methods used. Knife peeling will surely yield different pulp compared to lye peeling. In the study by Gupta et al., (2016) [13] , the skin of guava fruit was not removed. The initial mass, peel mass, seed mass, pulp mass, pH °Brix of the peach that was used to process leather were determined. The initial moisture percentages of both yellow and white were not significantly different and averaged at 87%. The final moisture percentages for both yellow and white were significantly different with white leather final moisture at 7.69% and yellow leather at 13.33% (p<0.05) (Fig. 6). The difference in final moisture percentages may have been affected by the slight variation in thicknesses. Deepika and Payel Panja, (2017) [10] processed aonla fruit leather. The best quality of leather was obtained at percentage moisture content of 17% and this received the highest score of 8 in overall acceptability. The lowest moisture percentage in their study was 13.23%. The authors Chavan and Shaik, (2015) [7] , also conducted guava leather processing. The moisture percentage of their leather was between 14.67% and 15.85%. Clearly the current study moisture percentage of the yellow and white peach leathers was reduced far too low and hence the leather was slightly harder, more especially the white leather which received the lowest overall sensory analysis scores. This also means that the four days it took to dry the produce could be reduced to about two days when the moisture percentage of the product being dried is kept approximately at 16%. The study results were not congruent to results of the studies conducted by Chavan and Shaik, (2015) [7] ; Deepika and Payel Panja, (2017) [10] . Clearly, the current study leather was too dry, and chances of bacterial or fungal contamination were too low compared to the studies by the authors mentioned above. However, too dry of a leather reduces textural quality. There were significant differences in the colour of the peach leather (p≤0.05) between the white and yellow as displayed in Fig. 7. Clearly, for white peach, the scores averaged at 5.6. The panellists neither were indifferent to the white peach landrace. However, for the yellow peach leather, the panellists gave colour a score between 6 and 7 meaning they slightly liked the colour of the yellow peach leather, hence the significant difference (p≤0.05) between the yellow and the white peach leather. The taste for the yellow peach leather also was scored higher than that of white peach leather; the panellists slightly liked the taste of the yellow leather over the white, though there were no significant differences (p<0.05). Thermal processing, a widely implemented method in food industry to avoid enzymatic changes and microbial spoilage Oliveira, Amaro, Pinho, and Ferreira, (2010) [26] was used in the current study. Concerns may be the effect of thermal processing on the undesirable biochemical changes that eventually affect the taste of the final product (Aguillar-Rosas et al., 2007) [1] . In a study that Oliveira et al., (2010) [26] , conducted to evaluate the effect of thermal processing on peaches they found that carotenoid concentration was significantly affected by the heating of the fresh fruit at 100 °C for 30 minutes, whereas the phenolic and antioxidant concentrations averaged at 0.7 and 0.6 μg.g -1 respectively and were not significantly affected by heat treatment. Fresh fruit contained an average of 11.6 μg.g [20,12,11] . It is highly possible that in the current study since the temperature reached 50 °C during drying that half of the reduction obtained in the study mentioned above affected total carotenoids probably. In addition, it is possible that the total phenolic compounds were not affected in the current study. The results obtained from the curves of the TPA of yellow and white peach leather were used to provide the quality attributes as explained in the typical graph of most food products in Fig. 7 and attributes as explained in Table 4 below. Fig. 8 is linked and used to explain all attributes explained in Table 4. Instrumental texture is similar in textural property which is associated with sense of feel or touch by the human finger or mouth. The variation is that an instrument and a probe or blade are used to represent mouth feel and results are expressed graphically (force vs time) as shown in Fig. 9 and Fig. 10. Fig. 9 provided quality attribute for yellow peach leather as processed in the Texture Analyser instrument. Table 5 and Table 6 provide results extracted from the texture profile graphs. The white leather hardness values are much larger than yellow hardness leather values. Meaning that white leather required was harder than yellow leather. The same trend was evident with larger values of white leather for factorability, gumminess, and chewiness. Overall, the white leather was harder than yellow leather. There were no variations between the two dimensionless values of cohesiveness and resilience. The texture of fruit leathers is affected by percentage moisture content and drying temperature, meaning that a longer drying or higher temperature usually causes a harder texture (Momchilova, Zsivanovits, Milkova-Tomova, Buhalova, Dojkova, 2016) [22] . The yellow leather recorded less hardness values that ranged between 60.80 N and 82.94 N for the yellow and 117.89 N and 181.05 N for the white leather which proved to be harder than yellow (p≤0.05). Fracturability value for white leather were again larger than the values for yellow leather and ranged between 101.28 N and 174.10 N and the yellow leather range was 40.92 and 63.15 (p≤0.05). There were no significant differences between white and yellow leather cohesiveness, resilience and springiness (p>0.05). The gumminess values were significantly different with white leather ranging between 51.02 N and 80.27 N and 21.70 N and 28.52 N for the yellow leather (p≤0.05). There were significant differences between the yellow and white leather chewiness. White leather ranged between 24.67 N.mm and 28.50 N.mm and yellow leather ranged between 51.01 and 80.25 N.mm. The study results are in agreement with this explanation since the leather received approximately 13% better objective and subjective results than the leather, which was approximately 7%. The genetic make-up of the fruit also has a role to play as well as the rate of water absorption from the surroundings or protein content of the fruits and sugar; this could explain why yellow and white leather of equal thicknesses produced different moisture percentages (Momchilova et al., 2016) [22] . The texture of leather products can be improved by adding nuts, also the drying process causes colour and appearance changes for the final product. The lighter leather product tends to be darker and turns brown because pigments are sensitive to temperature. Browning of leather may also be related to the non-enzymatic Vitamin C oxidation of polyphenols as well (Momchilova et al., 2016) [22] . The count of the colony forming units under a microscope was recorded as nil. This could be related to heating of the leather during pulping, due to heat sterilization effects that heating may have. A day after drying this test was conducted. There are possibilities of not getting microbial spoilage in leather and these results are in agreement with what Chavan and Shaik (2015) [7] found in their study of drying guava fruit into leather.
| Leather | Springiness (mm) | Resilience | Chewiness (N.mm) |
|---|---|---|---|
| Yellow leather | 0.9985±0.01 | 0.9985±0.02 | 24.67±1.03 |
| Yellow leather | 0.9988±0.05 | 0.9988±0.02 | 21.30±0.981 |
| Yellow leather | 0.9990±0.02 | 0.9990±0.04 | 28.50±1.07 |
| White leather | 0.9997±0.02 | 0.9997±0.01 | 80.25±1.19 |
| White leather | 0.9993±0.04 | 0.9993±0.02 | 67.27±1.10 |
| White leather | 0.9997±0.03 | 0.9997±0.01 | 51.01±1.09 |
Table text extracted from the original PDF; superscript letters are shown inline. The original table image is below.
View original table image
| Leather | Hardness (N) | Fracture ability | Cohesiveness | Gumminess (N) |
|---|---|---|---|---|
| Yellow leather | 63.15±1.02 | 63.15±1.05 | 0.3912±0.05 | 24.70±1.02 |
| Yellow leather | 60.80±1.05 | 60.80±0.99 | 0.3506±0.05 | 21.32±1.01 |
| Yellow leather | 82.94±0.99 | 40.92±1.05 | 0.3439±0.02 | 28.52±1.05 |
| White leather | 181.05±1.08 | 101.28±1.30 | 0.4434±0.07 | 80.27±1.08 |
| White leather | 174.10±1.05 | 174.10±1.05 | 0.3866±0.01 | 67.31±1.04 |
| White leather | 117.89±1.08 | 121.89±1.09 | 0.4328±0.06 | 51.02±1.08 |
Table text extracted from the original PDF; superscript letters are shown inline. The original table image is below.
View original table image
| Parameter | Measured in |
|---|---|
| Hardness | Peak Force |
| Fracturability | Peak Force at F1 |
| Cohesiveness | Area 2/Area 1 |
| Springiness | Distance 2 / Distance 1 |
| Gumminess | Hardness x cohesiveness |
| Chewiness | Hardness x Cohesiveness x Springiness |
| Resilience | Area 4 / Area 3 |
Table text extracted from the original PDF; superscript letters are shown inline. The original table image is below.
View original table image
| Quality Parameter | Fruit mass (g) | Peel (g) | Seed (g) | Pulp (g) | Fresh pH | Leather pH | Initial °Brix | Final °Brix | Final mass (g) | Pulp yield (g/kg) |
|---|---|---|---|---|---|---|---|---|---|---|
| White peach | 1359.5 | 561.0 | 176.5 | 622.0 | 3.5 | 3.7 | 14.3 | 23.4 | 431.0 | 457.0 |
| Yellow peach | 1293.0 | 514.0 | 149.0 | 630.0 | 4.0 | 3.7 | 12.4 | 20.0 | 496.0 | 397.0 |
Table text extracted from the original PDF; superscript letters are shown inline. The original table image is below.
View original table image
Conclusion
Fruit leather processing using tunnel solar drying as an energy efficient and affordable value addition method is one of the possible means to reduce postharvest losses to fruits in the KwaZulu-Natal Province of South Africa. The mist-belt conditions in Midlands of the province get wet often enough for an open sun drying to be successful but the use of tunnel solar dryer to protect the product being dried from moisture and contamination has been a success in the current study. Drying under tunnel solar dryer is possible, since the temperature in the drying tunnel becomes higher than the ambient temperature and the tunnel relative humidity becomes lower than the ambient relative humidity. The greenhouse effect in the tunnel dryer that allows for radiation to increase temperature and under such conditions, products that were dried successfully. However, the night relative humidity is very high and closer to 100% and therefore products dried must be sealed overnight to avoid rewetting. The two peach landraces of yellow and white fruits dried in a tunnel solar dryer into leather produced different quality products. Based on the organoleptic and instrumental tests conducted. A sensory analysis was conducted with semitrained panellists and clearly, the yellow leather received higher scores and regarded as of high quality compared to the white peach leather product. The TPA conducted using a Texture Analyser and Warner-Bratzler blade results were congruent to those of sensory analysis. White leather values of hardness, factorability, gumminess, and chewiness were much higher than those of yellow leather. The yellow peach leather was much better than white peach leather. The final moisture content of the white leather (7.69%) was significantly lower than that of the yellow (13.33) leather product. However, both yellow and white fleshed leather products of the current study were too low compared to moisture percentage obtained from other studies (14% and 17% average). The yellow leather received the higher scores in sensory analysis. Its moisture percentage was closer to the one obtained from the studies conducted by (Deepika and Payel Panja, 2017) [10] . No microbial spoilage was present in the leather products. There was a strong relationship in the explanation of the subjective method compared to the objective method. The study results of sensory analysis and TPA were congruent, that yellow leather was softer than the white leather products. This agrees to what the panellists obtained as they gave higher scores for yellow than white leather products. There is a linkage in explaining what goes on in the sensory evaluation as a subjective method supported by objective method. The values obtained in subjective method cannot always be the same; from the same panellists depending on issues such as how they are able to judge per specific day, whereas objective results will be able to give specific constant trends and results of higher accuracy. The product being dried should be removed during the night since there is high moisture with a potential to rewet the product. Furthermore, leather thickness has effects on the quality of the final products and leather processors should ensure uniformity. A 2 mm thickness of the peach slice was used in this study. Yellow peach leather appeared to be appetizing to the panellists because of its yellow colour compared to white peach leather.
Acknowledgement
AcknowledgementThe Authors would like to acknowledge the KwaZulu-Natal Department of Agriculture and Rural Development and the University of KwaZulu-Natal, School of Bio-resources Engineering and Environmental Hydrology for the sponsorship to this study. Agricultural Research Council in Cedara is acknowledged for data obtained from their weather station. Acknowledgements to the Impendle Community and the Extension Officer in the area Ms Thembile Zuma for all their contribution to this work. It is highly appreciated the International Journal of Agriculture and Nutrition https://www.agriculturejournal.net work conducted by the Value Adding Office at Cedara Research, Ms Elize Mans and Ms Nomcebo Nyandu. Thanks to Mr Theo van Rooyen for his guidance on the manuscript. Thanks the University of KwaZulu-Natal, School of Engineering for the guidance and Laboratory space in the Food Science Laboratory.
Figures and tables from the paper
References
28 in the original paper- Rosas ASF, Casarrubias BML, Moorillon NGV, Belloso MO, Rivas OE. Thermal and pulsed electric fields pasteurization of apple juice: Effects on physicochemical properties and favour compounds. Journal of the Science of Food and Agriculture. 2007;83(1):41-46.
- Akpinar EK, Bicer Y. Modelling of the drying of eggplants in thin-layers. International Journal of Food Science & Technology. 2005;40(3):273-281.
- Banout J, Ehl P. Using a double-pass solar drier for drying of bamboo shoots. The Journal of Agriculture and Rural Development in the Tropics and Subtropics. 2010;111(2):119-127.
- Vazquez CL, Ala˜n´on ME, Robledo RV. Bioactive flavonoids, antioxidant behavior, and cytoprotective effects of dried grapefruit peels (Citrus paradisi Macf.). Oxidative Medicine and Cellular Longevity. 2016;2016(1):8915729.
- Chavan UD, Shaik JB. Standardization and preparation of guava leather. International Journal of Advanced Research in Biological Sciences. 2015;2(11):102-113.
- Cherono K, Mwithiga G, Schmidt S. Infrared drying as a potential alternative to convective drying for biltong production. Italian Journal of Food Safety. 2016;5(3):5619-5625.
- Deepika, Panja P. Enrichment on quality of AONLA (Emblica officinalis G.) fruit bars by blending. Journal of Applied and Natural Science. 2017;9(1):162-166.
- Fratianni F, Cardinale F, Cozzolino A. Polyphenol composition and antioxidant activity of different grass pea (Lathyrus sativus), lentils (Lens culinaris), and chickpea (Cicer arietinum) ecotypes of the Campania region (Southern Italy). Journal of Functional Foods. 2014;7(1):551-557.
- Gama F, Keech D, Eymery F, Finkmeier I, Gelhaye E, Gardenstrom P, et al. The mitochondrial type peroxiredoxin from poplar. Plant Physiol. 2007;129(1):196-206.
- Gupta S, Gupta SN, Gupta N, Jaggi S. Economic Analysis of pumpkin and papaya as fruit leathers and their utilization as protective cover against cancer in the medical science. International Journal of Food Sciences and Nutrition. 2016;4(1):35-50.
- Gush MB. Measurement of water-use by Jatropha curcas L. using the heat-pulse velocity technique. Water South Africa. 2008;34(5):579-584.
- Huang X, Hsien F. Physical properties, sensory attributes, and consumer preference of pear fruit leather. Journal of Food Science. 2005;70(3):177-186.
- Maiti RK, Vidyasagar P, Rajkumar D, Ramaswamy A, Rodriguez HG. Seed priming improves seedling vigour and yield of few vegetable crops. The International Journal of Bio-resource Stress Management. 2011;2(1):125-130.
- Janjai S, Lamlert N, Intawee P, Mahayothee B, Bala BK, Nagle M, et al. Experimental and simulated performance of a PV-ventilated solar greenhouse dryer for drying of peeled longan and banana. Solar Energy. 2009;83(9):1550-1565.
- Kanner J, Harel S, Fishbein Y, Shalom P. Furfural accumulation in stored orange juice concentrates. Journal of Agricultural and Food Chemistry. 1981;29(5):948-949.
- Lessin WJ, Catigani GL, Schwartz SJ. Quantification of cis-trans isomers of pro vitamin A carotenoids in fresh and processed fruits and vegetables. Journal of Agricultural and Food Chemistry. 1997;45(10):37283732.
- Momchilova M, Zsivanovits G, Tomova ML, Buhalova D, Dojkova P. Sensory and texture characterization of plum (Prunus domestica) fruit leather. Bulgarian Chemical Communications. 2016;48:428-434.
- Munir A, Sultan U, Iqbal M. Development and performance evaluation of locally fabricated portable solar tunnel dryer for drying of fruits, vegetables and medicinal plants. Pakistan Journal of Agricultural Sciences. 2013;50(3):493-498.
- Nishizaki MT, Carrington E. The effect of water temperature and flow on respiration in barnacles: Patterns of mass transfer versus kinetic limitation. Journal of Experimental Biology. 2014;217(12):21012109.
- Ofori DA, Gyau A, Dawson IK, Asaah E, Tchoundjeu Z, Jamnadass R, et al. Developing more productive African agroforestry systems and improving food and nutritional security through tree domestication. Current Opinion in Environmental Sustainability. 2014;6(1):123-127.
- Oliveira C, Amaro LF, Pinho O, Ferreira I. Cooked blueberries: anthocyanin and anthocyanidin degradation and their radical-scavenging activity. Journal of Agricultural and Food Chemistry. 2010;58(16):90099012.
- Paula AM, Conti-Silva AC. Texture profile correlation between sensory and instrumental analyses on extruded snacks. Journal of Food Engineering. 2014;121:9-14.
- Rajkumar SP, Venugopal AP, Viswanath A, Varadharaju N. Effect of air velocity and pre-treatment on drying characteristics of tomato slices during solar tunnel International Journal of Agriculture and Nutrition https://www.agriculturejournal.net drying. International Journal of Current Microbiology and Applied Sciences. 2017;6(6):573-580.
- Shackleton CM, Dzerefos CM, Shackleton SE, Mathabela FR. The use and trade in indigenous edible fruits in the Bushbuckridge savanna region, South Africa. Ecology of Food and Nutrition. 2000 Aug 1;39(3):225-245.
- Szczesniak AS. Classification of textural characteristics. Journal of Food Science. 1963;28(4):385-389.
- Szczesniak AS. Correlating sensory with instrumental texture measurements: An overview of recent developments. Journal of Texture Studies. 1987;18(1):115.
- Wafula E, Franz C, Rohn S, Huch M, Mathara J, Trierweiler B, et al. Fermentation of African indigenous leafy vegetables to lower post-harvest losses, maintain quality and increase product safety. African Journal of Horticultural Science. 2016;9:1-13.
- Mkhathini KM, Magwaza LS, Workneh TS, Mwithiga G. Effects of relative humidity and temperature on small scale peach fruit drying using a tunnel solar dryer: A case study of peach fruit produced by small scale farmers in the Midlands of Kwazulu-Natal, South Africa. South African Journal of Agricultural Extension. 2018;46(2):13.
Cited by 1
From OpenAlex, OpenCitations and reference lists read by Scinovex
- High Lycopene Tomato Ketchup Slice: Development, Drying Kinetics, and Storage Study ↗
Mehul Hirabhai Chudasama, Sanjay H. Akbari · Journal of Agricultural Engineering (India) · 2025
This study presents a novel, shelf-stable tomato ketchup slice (TKS) that offers a concentrated, nutrient-dense, and portable alternative to conventional ketchup, addressing storage, wastage, and convenience challenges in tomato-based products. The formulation was optimized using different hydrocolloids (pectin, xanthan gum, guar gum, acacia gum at 0.5% to 2.5%) and modified starch (1.0% to 2.5%) to achieve desirable texture, lycopene retention,…
❝ 0