
Research article · 2024 · Full text
International Journal of Advanced Biochemistry ResearchGenetic studies in F5 generation of ridge gourd (Luffa acutangula L. Roxb.)
Volume 8(2) · Pages 118–123 · DOI: 10.33545/26174693.2024.v8.i2b.564 ↗
Research areasAdvances in Cucurbitaceae ResearchPlant Virus Research StudiesSeed and Plant Biochemistry
Abstract
Author-writtenThe research conducted at AICRP on vegetable crops, Mahatma Phule Krishi Vidyapeeth, Rahuri during 2022-2023 studied on genetic studies in the F5 generation of ridge gourd (Luffa acutangula L. Roxb.) with the aim of developing a superior and high-quality inbred line. The study employed a randomized block design (RBD) with three replications, using five parents and their respective progenies derived from the cross (Arka Sumeet x Konkan Harita). The findings indicated moderate genetic coefficient of variation (GCV) and phenotypic coefficient of variation (PCV), combined with high heritability and notable genetic advance as a percentage of the mean for specific traits in the F5 generation. These traits encompassed the number of branches per vine, the node of first appearance of female and male flowers, the number of harvests, fruit diameter, fruit yield per vine, fruit yield per plot and fruit yield per hectare. On the contrary, characteristics like vine length, days to initial female and male flower appearance, days to 50% flowering, sex ratio, days to initial and final harvest, fruit length, fruit weight and number of fruits per vine displayed high heritability but showed moderate to low genetic advance as a percentage of the mean. Correlation analysis revealed a significant and positive association between fruit yield per vine and various growth-related characteristics, including vine length, number of branches per vine, number of harvests, days to final harvest, fruit length, fruit diameter, fruit weight, number of fruits per vine, fruit yield per vine and fruit yield per plot. Conversely, a notable and negative correlation was observed between fruit yield per vine and several reproductive traits, such as days to initial appearance of female and male flowers, node number at which the first female and male flowers appeared, duration until 50% flowering, sex ratio and days until the initial harvest.
Summary
Source-checkedPlain-language reading of the full paper, prepared with AI and checked against the text. Each point links to the authors' own words.
Why it matters
- Ridge gourd (Luffa acutangula) is a member of the Cucurbitaceae family grown in tropical and sub-tropical regions, where its young fruits are used as vegetables. View evidence ↗
- The crop is valued for its low-calorie content, benefits for diabetes, and various Ayurvedic medicinal properties such as antioxidant and blood-purifying effects. View evidence ↗
- Effective breeding programs require an understanding of genetic variability and heritability to plan the selection of desirable traits. View evidence ↗
The question
- The study aimed to analyze the F5 generation of ridge gourd to develop a superior, high-quality inbred line. View evidence ↗
What they did
- The research was conducted in the summer of 2023 in Maharashtra, India, using five progenies from a cross between Arka Sumeet and Konkan Harita, along with their parents. View evidence ↗
- The researchers measured a wide range of growth and yield parameters, including vine length, flowering timing, fruit dimensions, and total yield per vine, plot, and hectare. View evidence ↗
What they found
- For all measured quantitative traits, the genotypic coefficient of variation (GCV) was lower than the phenotypic coefficient of variation (PCV), indicating that environmental factors influenced trait expression. View evidence ↗
- High heritability and significant genetic advance were found for traits such as number of branches per vine (98.50% heritability; 35.28% GA), fruit yield per vine (95.77%; 26.05%), and fruit yield per hectare (95.83%; 26.24%). View evidence ↗
- Several traits, including vine length (96.63% heritability; 16.12% GA) and fruit weight (97.25%; 5.93%), showed high heritability but only moderate to low genetic advance, suggesting non-additive gene effects. View evidence ↗
- Vine length had a significant positive correlation with fruit yield per vine and plot, as well as fruit weight and number of fruits per vine. View evidence ↗
- Vine length was significantly negatively correlated with the timing of first flower appearance, the node of first flower appearance, and the sex ratio. View evidence ↗
- The number of fruits per vine showed a significant positive correlation with both fruit yield per vine and fruit yield per plot. View evidence ↗
What it means
- The authors conclude that traits with both high heritability and high genetic advance are governed by additive gene effects and are therefore the most valuable for selection. View evidence ↗
- Traits showing low genetic and phenotypic variation are considered to have reached homozygosity and are deemed unsuitable for further selection. View evidence ↗
Visual summary
3 visualsIllustrations explain the paper; charts are replotted from the paper's own table values.
Correlation Network of Vine Length
AI-generated conceptual illustration (ridge gourd (Luffa acutangula) plants). It explains the idea and does not show study data.
View source evidence ↗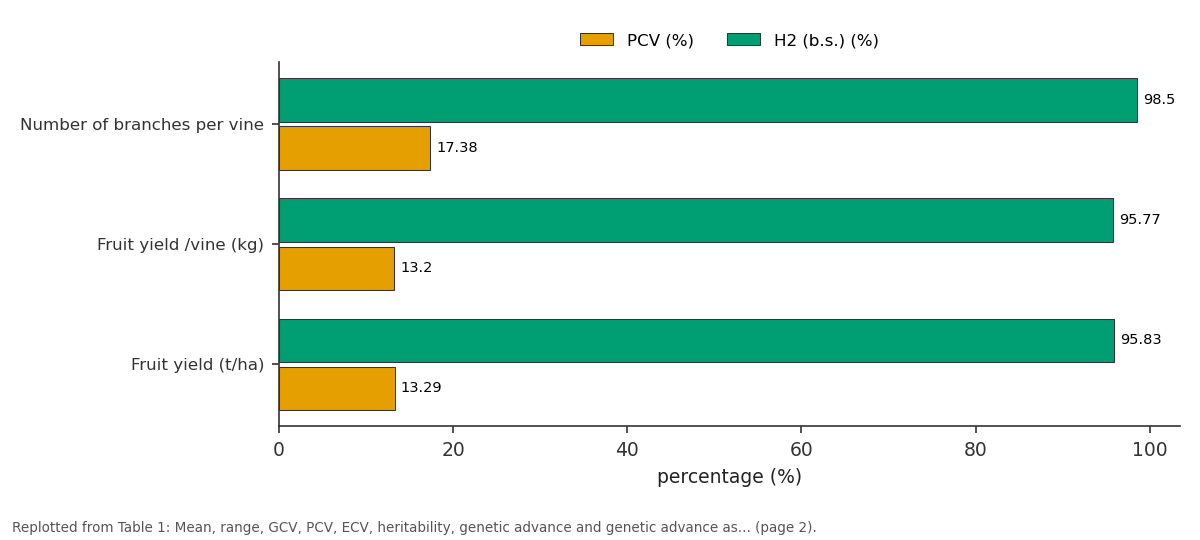
PCV (%) and H2 (b.s.) (%): Number of branches per... vs Fruit yield /vine (kg) vs Fruit yield (t/ha)
Replotted from Table 1 (page 2) of the original paper. Every bar is the paper's own table value.
View source evidence ↗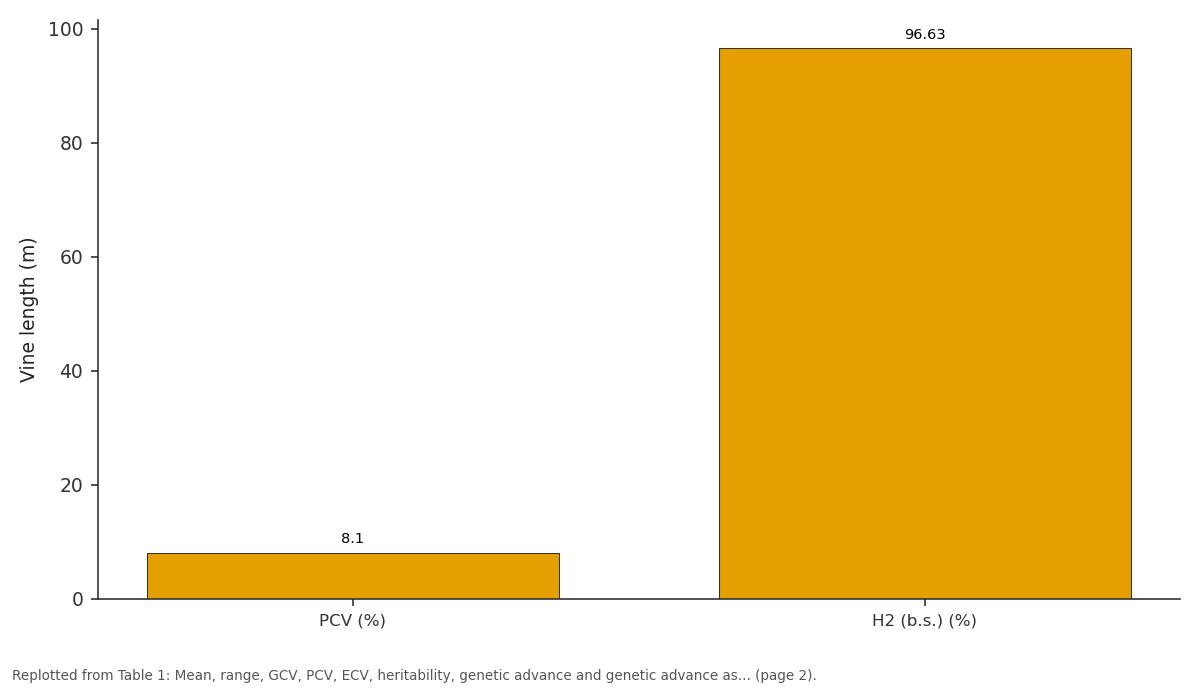
Vine length (m): PCV (%) vs H2 (b.s.) (%)
Replotted from Table 1 (page 2) of the original paper. Every bar is the paper's own table value.
View source evidence ↗Figures & tables
From the original paper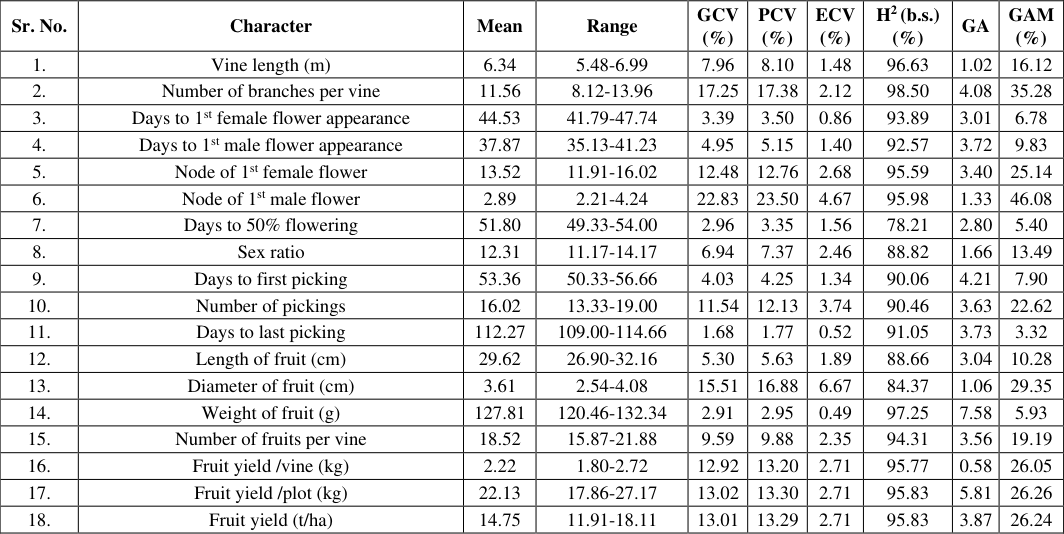 Table 1
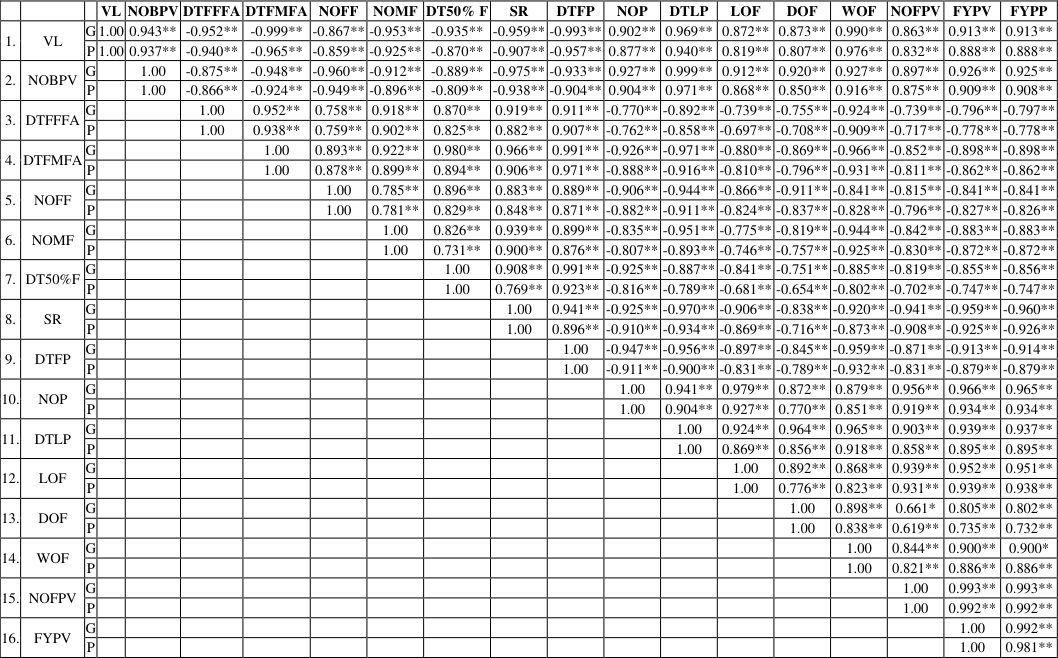 Table 2
Introduction
Ridge gourd (Luffa acutangula (L.) Roxb.), also recognized as angled gourd, angled loofah, or ribbed gourd, is a member of the Cucurbitaceae family with a diploid chromosome count of 26. Predominantly grown in tropical and sub-tropical areas, its young fruits are commonly used in culinary dishes, particularly in curries or as a cooked vegetable. The nutritional content of the fruit comprises moisture (92.5 g), protein (0.5 g), fat (0.5 g), carbohydrates (3.4 g), energy (17 kcal), calcium (18 mg), vitamin C (5 mg), riboflavin (0.01 mg), phosphorus (26 mg), iron (0.5 mg) and carotene (33 µg) per 100 g of edible portion (Sheshadri and Parthasarthy, 1980) [23] . Recognized as a low-calorie vegetable, it is considered advantageous for individuals with diabetes (Pullaiah, 2006) [22] . In Ayurveda, it is recognized for its properties including immune system enhancement, antioxidant effects, hypoglycemic benefits, diuretic properties, blood purification and treatment for jaundice (Manikandaselvi et al., 2016) [19] . The crop is thought to have its origins in India, where wild varieties still exist, and later spread to areas with ample rainfall (Grubben and Denton, 2004) [13] . Traditionally, ridge gourd has been utilized for addressing stomach ailments and fever. The seeds are recognized for their purgative, emetic, and antihelminthic properties attributed to the presence of secondary metabolites. Ridge gourd seeds have gained attention for isolating Ribosome Inactivating Proteins (RIPs) and luffaculin, showcasing various pharmacological activities including abortifacient, antifungal, antitumor, antivirus and HIV-1 integrase inhibitory properties. As a predominantly monoecious cross-pollinated crop, ridge gourd is cultivated in tropical and sub-tropical regions for its tender edible fruits, both commercially and in small-scale kitchen gardens across India, as well as in parts of Indonesia, Myanmar, Malaysia, the Philippines, Sri Lanka and Taiwan. It can be cultivated in spring, summer or as a rainy season crop. Significant genetic variation is observed across different regions of India, encompassing variations in fruit shape, size, color and the sex ratio of staminate and pistillate flowers. The efficacy of any breeding program depends on the careful selection of germplasm, allowing plant breeders to create novel gene combinations and select varieties suitable for diverse agricultural systems. Successful breeding relies on understanding the nature and extent of genetic variability, the transmissibility of desirable traits and the expected genetic gain for a given trait in a population. Therefore, assessing variability and heritability within available germplasm is crucial for informed breeding program planning. The present study aims to investigate genetic variability and heritability in a set of genotypes, offering valuable insights for future breeding endeavors.
Materials and Methods
The investigation was conducted at AICRP on Vegetable Crops, Department of Horticulture, MPKV, Rahuri, Maharashtra, India, in the summer of 2023. The study utilized five progenies obtained from the cross (Arka Sumeet x Konkan Harita) and included their respective parents as genetic material. Planting of the ten progenies and their five parental lines took place in the summer of 2023 and evaluated in the F 5 generation. The assessment of the F 5 generation was conducted using a randomized block design (RBD) with three replications. Numerous observations were documented during the research, encompassing parameters like vine length, number of branches per vine, duration until the initial appearance of female and male flowers, node where the first female flower emerged, node where the first male flower emerged, time to achieve 50% flowering, sex ratio, duration until the first harvest, duration until the final harvest, fruit length, fruit diameter, fruit weight, number of fruits per vine, fruit yield per vine, fruit yield per plot and fruit yield per hectare.
Results and Discussion
The extent of variability within the selected genotype of ridge gourd in the F 5 generation arising from the cross between Arka Sumeet and Konkan Harita was assessed and the measurements for variability, heritability and genetic advance as a percentage of the mean are presented in Table 1.
| Sr. No. | Character | Mean | Range | GCV (%) | PCV (%) | ECV (%) | H2 (b.s.) (%) | GA | GAM (%) |
|---|---|---|---|---|---|---|---|---|---|
| 1. | Vine length (m) | 6.34 | 5.48-6.99 | 7.96 | 8.10 | 1.48 | 96.63 | 1.02 | 16.12 |
| 2. | Number of branches per vine | 11.56 | 8.12-13.96 | 17.25 | 17.38 | 2.12 | 98.50 | 4.08 | 35.28 |
| 3. | Days to 1st female flower appearance | 44.53 | 41.79-47.74 | 3.39 | 3.50 | 0.86 | 93.89 | 3.01 | 6.78 |
| 4. | Days to 1st male flower appearance | 37.87 | 35.13-41.23 | 4.95 | 5.15 | 1.40 | 92.57 | 3.72 | 9.83 |
| 5. | Node of 1st female flower | 13.52 | 11.91-16.02 | 12.48 | 12.76 | 2.68 | 95.59 | 3.40 | 25.14 |
| 6. | Node of 1st male flower | 2.89 | 2.21-4.24 | 22.83 | 23.50 | 4.67 | 95.98 | 1.33 | 46.08 |
| 7. | Days to 50% flowering | 51.80 | 49.33-54.00 | 2.96 | 3.35 | 1.56 | 78.21 | 2.80 | 5.40 |
| 8. | Sex ratio | 12.31 | 11.17-14.17 | 6.94 | 7.37 | 2.46 | 88.82 | 1.66 | 13.49 |
| 9. | Days to first picking | 53.36 | 50.33-56.66 | 4.03 | 4.25 | 1.34 | 90.06 | 4.21 | 7.90 |
| 10. | Number of pickings | 16.02 | 13.33-19.00 | 11.54 | 12.13 | 3.74 | 90.46 | 3.63 | 22.62 |
| 11. | Days to last picking | 112.27 | 109.00-114.66 | 1.68 | 1.77 | 0.52 | 91.05 | 3.73 | 3.32 |
| 12. | Length of fruit (cm) | 29.62 | 26.90-32.16 | 5.30 | 5.63 | 1.89 | 88.66 | 3.04 | 10.28 |
| 13. | Diameter of fruit (cm) | 3.61 | 2.54-4.08 | 15.51 | 16.88 | 6.67 | 84.37 | 1.06 | 29.35 |
| 14. | Weight of fruit (g) | 127.81 | 120.46-132.34 | 2.91 | 2.95 | 0.49 | 97.25 | 7.58 | 5.93 |
| 15. | Number of fruits per vine | 18.52 | 15.87-21.88 | 9.59 | 9.88 | 2.35 | 94.31 | 3.56 | 19.19 |
| 16. | Fruit yield /vine (kg) | 2.22 | 1.80-2.72 | 12.92 | 13.20 | 2.71 | 95.77 | 0.58 | 26.05 |
| 17. | Fruit yield /plot (kg) | 22.13 | 17.86-27.17 | 13.02 | 13.30 | 2.71 | 95.83 | 5.81 | 26.26 |
| 18. | Fruit yield (t/ha) | 14.75 | 11.91-18.11 | 13.01 | 13.29 | 2.71 | 95.83 | 3.87 | 26.24 |
Table text extracted from the original PDF; superscript letters are shown inline. The original table image is below.
View original table image
Genotypic and phenotypic coefficient of correlation
Significant variability was evident across a broad spectrum of traits in the F 5 generation resulting from the cross Arka Sumeet x Konkan Harita. Notably, for all quantitative traits, the genotypic coefficient of variation consistently appeared lower than the phenotypic coefficient of variation, suggesting the influence of environmental factors on the expression of these traits. [16] on ridge gourd, Abhijeet et al. (2018) [1] on sponge gourd, Muttur et al. (2017) [20] and Ingole et al. (2021) [14] on pumpkin, Chaudhari (2019) [4] and Pradhan et al. (2021) [21] on bitter gourd and Mali et al. (2015) [18] and Gaikwad (2016) [10] on muskmelon.
A moderate degree of both genotypic and phenotypic variation was noted for various traits, such as the number of branches per vine (17.25; 17.38) [17] on ridge gourd, Ingole et al. (2021) [14] on pumpkin, Chaudhari (2019) [4] on bitter gourd and Mali et al. (2015) [18] and Gaikwad (2016) [10] on muskmelon.
Conversely, significant levels of genetic and phenotypic variation were detected for the node of first male flower appearance (22.83; 23.50). These findings align with research conducted by Durga et al. (2021) [8] and Farheen et al. (2022) [9] in ridge gourd and Pradhan et al. (2021) [21] in bitter gourd. Across the progenies of this cross, there was generally a moderate to low range of variation observed for most traits, indicating that the F 5 generation of ridge gourd exhibits moderate to low levels of variation.
Heritability and genetic advance as percent of mean
For the Cross (Arka Sumeet × Konkan Harita), there was a substantial heritability observed alongside significant genetic advance as a percent of the mean for various [17] in ridge gourd, Abhijeet et al. (2018) [1] in sponge gourd, Ingole et al.
(2021) [14] in pumpkin, and Pradhan et al. (2021) [21] [16] in ridge gourd, Ingole et al. (2021) [14] in pumpkin and Pradhan et al. (2021) [21] in bitter gourd.
Correlation coefficient 3.3.1 Correlation coefficient of cross Arka Sumeet × Konkan Harita (C1: P3 x P4) for F5 generation
The correlation coefficients, both genotypic and phenotypic, for the cross between Arka Sumeet and Konkan Harita (C1: P 3 × P 4 ) in the F 5 generation, are presented in Table 2.
| — | — | — | VL | NOBPV | DTFFFA | DTFMFA | NOFF | NOMF | DT50% F | SR | DTFP | NOP | DTLP | LOF | DOF | WOF | NOFPV | FYPV | FYPP |
|---|---|---|---|---|---|---|---|---|---|---|---|---|---|---|---|---|---|---|---|
| 1. | VL | G | 1.00 | 0.943** | -0.952** | -0.999** | -0.867** | -0.953** | -0.935** | -0.959** | -0.993** | 0.902** | 0.969** | 0.872** | 0.873** | 0.990** | 0.863** | 0.913** | 0.913** |
| P | 1.00 | 0.937** | -0.940** | -0.965** | -0.859** | -0.925** | -0.870** | -0.907** | -0.957** | 0.877** | 0.940** | 0.819** | 0.807** | 0.976** | 0.832** | 0.888** | 0.888** | ||
| 2. | NOBPV | G | 1.00 | -0.875** | -0.948** | -0.960** | -0.912** | -0.889** | -0.975** | -0.933** | 0.927** | 0.999** | 0.912** | 0.920** | 0.927** | 0.897** | 0.926** | 0.925** | |
| P | 1.00 | -0.866** | -0.924** | -0.949** | -0.896** | -0.809** | -0.938** | -0.904** | 0.904** | 0.971** | 0.868** | 0.850** | 0.916** | 0.875** | 0.909** | 0.908** | |||
| 3. | DTFFFA | G | 1.00 | 0.952** | 0.758** | 0.918** | 0.870** | 0.919** | 0.911** | -0.770** | -0.892** | -0.739** | -0.755** | -0.924** | -0.739** | -0.796** | -0.797** | ||
| P | 1.00 | 0.938** | 0.759** | 0.902** | 0.825** | 0.882** | 0.907** | -0.762** | -0.858** | -0.697** | -0.708** | -0.909** | -0.717** | -0.778** | -0.778** | ||||
| 4. | DTFMFA | G | 1.00 | 0.893** | 0.922** | 0.980** | 0.966** | 0.991** | -0.926** | -0.971** | -0.880** | -0.869** | -0.966** | -0.852** | -0.898** | -0.898** | |||
| P | 1.00 | 0.878** | 0.899** | 0.894** | 0.906** | 0.971** | -0.888** | -0.916** | -0.810** | -0.796** | -0.931** | -0.811** | -0.862** | -0.862** | |||||
| 5. | NOFF | G | 1.00 | 0.785** | 0.896** | 0.883** | 0.889** | -0.906** | -0.944** | -0.866** | -0.911** | -0.841** | -0.815** | -0.841** | -0.841** | ||||
| P | 1.00 | 0.781** | 0.829** | 0.848** | 0.871** | -0.882** | -0.911** | -0.824** | -0.837** | -0.828** | -0.796** | -0.827** | -0.826** | ||||||
| 6. | NOMF | G | 1.00 | 0.826** | 0.939** | 0.899** | -0.835** | -0.951** | -0.775** | -0.819** | -0.944** | -0.842** | -0.883** | -0.883** | |||||
| P | 1.00 | 0.731** | 0.900** | 0.876** | -0.807** | -0.893** | -0.746** | -0.757** | -0.925** | -0.830** | -0.872** | -0.872** | |||||||
| 7. | DT50%F | G | 1.00 | 0.908** | 0.991** | -0.925** | -0.887** | -0.841** | -0.751** | -0.885** | -0.819** | -0.855** | -0.856** | ||||||
| P | 1.00 | 0.769** | 0.923** | -0.816** | -0.789** | -0.681** | -0.654** | -0.802** | -0.702** | -0.747** | -0.747** | ||||||||
| 8. | SR | G | 1.00 | 0.941** | -0.925** | -0.970** | -0.906** | -0.838** | -0.920** | -0.941** | -0.959** | -0.960** | |||||||
| P | 1.00 | 0.896** | -0.910** | -0.934** | -0.869** | -0.716** | -0.873** | -0.908** | -0.925** | -0.926** | |||||||||
| 9. | DTFP | G | 1.00 | -0.947** | -0.956** | -0.897** | -0.845** | -0.959** | -0.871** | -0.913** | -0.914** | ||||||||
| P | 1.00 | -0.911** | -0.900** | -0.831** | -0.789** | -0.932** | -0.831** | -0.879** | -0.879** | ||||||||||
| 10. | NOP | G | 1.00 | 0.941** | 0.979** | 0.872** | 0.879** | 0.956** | 0.966** | 0.965** | |||||||||
| P | 1.00 | 0.904** | 0.927** | 0.770** | 0.851** | 0.919** | 0.934** | 0.934** | |||||||||||
| 11. | DTLP | G | 1.00 | 0.924** | 0.964** | 0.965** | 0.903** | 0.939** | 0.937** | ||||||||||
| P | 1.00 | 0.869** | 0.856** | 0.918** | 0.858** | 0.895** | 0.895** | ||||||||||||
| 12. | LOF | G | 1.00 | 0.892** | 0.868** | 0.939** | 0.952** | 0.951** | |||||||||||
| P | 1.00 | 0.776** | 0.823** | 0.931** | 0.939** | 0.938** | |||||||||||||
| 13. | DOF | G | 1.00 | 0.898** | 0.661* | 0.805** | 0.802** | ||||||||||||
| P | 1.00 | 0.838** | 0.619** | 0.735** | 0.732** | ||||||||||||||
| 14. | WOF | G | 1.00 | 0.844** | 0.900** | 0.900* | |||||||||||||
| P | 1.00 | 0.821** | 0.886** | 0.886** | |||||||||||||||
| 15. | NOFPV | G | 1.00 | 0.993** | 0.993** | ||||||||||||||
| P | 1.00 | 0.992** | 0.992** | ||||||||||||||||
| 16. | FYPV | G | 1.00 | 0.992** | |||||||||||||||
| P | 1.00 | 0.981** |
Table text extracted from the original PDF; superscript letters are shown inline. The original table image is below.
View original table image
Inter correlations among yield attributing components
At both the genotypic and phenotypic levels, vine length during harvest demonstrated a statistically significant positive association with various parameters. These included the number of primary branches per vine, number of pickings, days to last picking, dimensions of the fruit (length and diameter), weight of the fruit, number of fruits per vine, as well as the overall fruit yield per vine and per plot. Additionally, vine length exhibited a notable and significantly negative relationship with several factors across both genotypic and phenotypic levels. These factors included the days to appearance of the first female flowers, days to appearance of the first male flowers, specific node where the initial female flower emerged, node where the initial male flower appeared, time taken for 50% flowering to occur, the duration until the first picking and the sex ratio. Similarly, at both the genotypic and phenotypic levels, the number of branches per vine showed a noteworthy and statistically significant positive correlation with a variety of factors. These included the number of pickings, days to last picking, dimensions of the fruit (length and diameter), weight of the fruit, number of fruits per vine, as well as the overall fruit yield per vine and per plot. Conversely, the number of branches per vine displayed a significant and notable negative correlation with several parameters across both genotypic and phenotypic levels. These parameters encompassed the days to the first appearance of female flowers, days to the first appearance of male flowers, specific node where the first female flower emerged, node where the first male flower appeared, sex ratio, as well as the days to the first picking. At both the genotypic and phenotypic levels, the duration until the first appearance of female flowers exhibited a significant and statistically positive relationship with factors such as the duration until the first appearance of male flowers, specific node where the first female flower emerged, node where the first male flower appeared, period required for 50% flowering, sex ratio, as well as the time needed for the first picking. Additionally, across both the genotypic and phenotypic perspectives, the duration until the first appearance of female flowers displayed a significant and substantial negative correlation with various parameters. These included the number of pickings, duration until the last picking, dimensions of the fruit (both length and diameter), weight of the fruit, number of fruits per vine, as well as the overall fruit yield per vine and per plot. Similarly, in both the genotypic and phenotypic dimensions, the duration until the first appearance of male flowers showed a substantial and statistically significant positive relationship with factors such as the specific node where the first female flower appeared, node where the first male flower emerged, period required for 50% flowering to occur, sex ratio, as well as the duration until the first picking. Moreover, across both the genotypic and phenotypic perspectives, the duration until the first appearance of male flowers exhibited a meaningful and significant negative correlation with various parameters. These included the number of pickings, duration until the last picking, dimensions of the fruit (both length and diameter), weight of the fruit, number of fruits per vine, as well as the overall fruit yield per vine and per plot.
The specific node where the first female flower appeared displayed a statistically significant positive relationship with factors including the node where the first male flower appeared, period required for 50% flowering, sex ratio, as well as the duration until the first picking. Furthermore, spanning both the genotypic and phenotypic dimensions, this particular node exhibited a significant and notable inverse correlation with various parameters. These encompassed the number of pickings, duration until the last picking, dimensions of the fruit (length and diameter), weight of the fruit, number of fruits per vine, as well as the overall fruit yield per vine and per plot.
Likewise, the specific node where the first male flower appeared showed a notable and statistically significant positive relationship with factors such as the period required for 50% flowering, sex ratio, and days to the first picking. Furthermore, across both the genotypic and phenotypic dimensions, this particular node demonstrated a significant and negative correlation with various parameters. These encompassed the number of pickings, duration until the last picking, dimensions of the fruit (length and diameter), weight of the fruit, number of fruits per vine, as well as the overall fruit yield per vine and per plot.
The duration taken to reach 50% flowering demonstrated a notable and statistically significant positive relationship with factors such as the sex ratio and the time to the first picking. Additionally, across both the genotypic and phenotypic contexts, this duration showed a significant and meaningful negative correlation with various parameters. These encompassed the number of pickings, the duration until the last picking, dimensions of the fruit (both length and diameter), weight of the fruit, the number of fruits per vine, as well as the overall fruit yield per vine and per plot. The observed sex ratio exhibited a notable and statistically significant positive relationship with the time to the first picking, observed across both genotypic and phenotypic levels. Simultaneously, there was a significant and meaningful negative correlation between the sex ratio and various parameters, including the number of pickings, the duration until the last picking, dimensions of the fruit (both length and diameter), weight of the fruit, the number of fruits per vine, as well as the overall fruit yield per vine and per plot. At both the genotypic and phenotypic levels, the time to the first picking displayed a significant and inverse relationship with a range of factors. These encompassed the number of pickings, the duration until the last picking, dimensions of the fruit (both length and diameter), weight of the fruit, the number of fruits per vine, as well as the overall fruit yield per vine and per plot.
The number of pickings exhibited a notable and statistically significant positive correlation, observed across both the genotypic and phenotypic dimensions. This correlation extended to various parameters, including the duration until the last picking, dimensions of the fruit (length and diameter), weight of the fruit, the number of fruits per vine, as well as the overall fruit yield per vine and per plot. At both the genotypic and phenotypic levels, there was a meaningful and statistically significant positive relationship observed between the duration until the last picking and various factors. These encompassed dimensions of the fruit (length and diameter), weight of the fruit, the number of fruits per vine, as well as the overall fruit yield per vine and per plot. Within both the genotypic and phenotypic dimensions, fruit length exhibited a notable and statistically significant positive correlation with various attributes, including fruit diameter, fruit weight, the number of fruits per vine, as well as the overall fruit yield per vine and per plot.
In both the genotypic and phenotypic contexts, there was a significant positive correlation observed between fruit diameter and attributes such as fruit weight, the number of fruits per vine, as well as the overall fruit yield per vine and per plot. A significant positive correlation was observed between fruit weight and factors including the number of fruits per vine as well as the overall fruit yield per vine and per plot. At both the genotypic and phenotypic levels, the number of fruits per vine exhibited a meaningful and statistically significant positive correlation with both fruit yield per vine and fruit yield per plot. There was a notable and significant positive correlation between fruit yield per vine and fruit yield per plot, observed at both the genotypic and phenotypic levels. The outcomes of this study are in line with similar research conducted by Choudhary and Kumar (2011) [6] , Dubey et al.
(2013) [7] , Ananthan and Krishnamoorthy (2017) [2] , and Kannan and Rajamanickam (2019) [16] , as well as Thulasiram et al. (2023) [24] in the context of ridge gourd, Chithra et al. (2023) [5] in sponge gourd. Additionally, analogous findings were reported by Vaidya et al. (2020) [25] concerning bottle gourd, Ingole et al. (2021) [14] , Ingole et al. 2022 [15] and Ban et al. (2022) [3] in pumpkin.
Conclusion
Moderate genetic coefficient of variation (GCV) and phenotypic coefficient of variation (PCV), coupled with high heritability and substantial genetic advance as a percentage of the mean, were observed for certain characteristics in the F 5 generation of the cross between Arka Sumeet and Konkan Harita. These characteristics included the number of branches per vine, node of the first female flower appearance, node of the first male flower appearance, number of pickings, diameter of fruit, fruit yield per vine, fruit yield per plot and fruit yield per hectare.
Conversely, traits such as vine length, days to the first female flower appearance, days to the first male flower appearance, days to 50% flowering, sex ratio, days to the first picking, days to the last picking, length of fruit, weight of fruit and number of fruits per vine displayed high heritability but had a moderate to low genetic advance as a percentage of the mean in the F 5 generation. This suggests that further selection may not significantly alter these traits, as they have already achieved a certain level of homozygosity. In terms of correlation, a significant and positive relationship was observed between fruit yield per vine and several growth-related traits, including vine length, number of branches per vine, number of pickings, days to the last picking, length of fruit, diameter of fruit, weight of fruit, number of fruits per vine, fruit yield per vine and fruit yield per plot. Conversely, a substantial and negative correlation was noted between fruit yield per vine and various reproductive traits, such as days to the first appearance of female and male flowers, node number at which the first female and male flowers emerged, duration until 50% flowering, sex ratio and days taken for the first picking.
References
23 in the original paper- Abhijeet, Kasera S, Yadav NP, Singh VB, Mishra SK. Genetic variability studies on sponge gourd [Luffa cylindrica (L.) Roem.]. Int J Agric Environ Biotechnol. 2018;941-945.
- Ananthan M, Krishnmoorthy V. Genetic variability, correlation and path analysis in ridge gourd (Luffa acutangula (Roxb) L.). Int J Curr Microbiol Appl Sci. 2017;6(6):3022-3026.
- Ban SJ, Kshirsagar DB, Kagane BV. Genetic variability and correlation analysis in F6 generation of pumpkin (Cucurbita moschata Duch Ex. Poir). Pharma Innov J. 2022;11(12):3510-3513.
- Chithra K, Shashikanth E, Allolli TB, Jagadeesh SL, Sarvamangala C. Correlation coefficient analysis for yield and yield attributing traits in sponge gourd (Luffa cylindrica (L.) Roem.). Biol Forum -Int J. 2023;15(1):419-424.
- Choudhary BR, Kumar S. Genetic analysis in ridge gourd (Luffa acutangula Roxb. L.) under hot and arid conditions. Indian J Arid Hortic. 2011;6(12):55-58.
- Dubey RK, Singh V, Upadhyay G. Genetic variability and interrelationship among some ridge gourd (Luffa acutangula L.) accessions under foothills of Arunachal Pradesh. Prog Horticult. 2013;45(1):191-197.
- Durga PM, Kranthi RG, Usha KK, Uma JK, Narasimharao S. Variability studies in F3 population of ridge gourd (Luffa acutangula) for yield and yield attributing traits. Pharma Innov J. 2021;10(7):612-615.
- Farheen SM, Ramanna CV, Sivakumar V, Kranthi R, Rao MP. Studies on genetic variability, heritability, genetic advance in F4 generation of ridge gourd (Luffa acutangula (L.) Roxb.). Pharma Innov J. 2022;11(8):1298-1301.
- Glaszmann JC, Kilian B, Upadhyaya HD, Varshney RK. Accessing genetic diversity for crop improvement. Curr Opin Plant Biol. 2010;13:167-173.
- Golani IJ, Mehta DR, Purohit VL, Pandya HM. Genetic variability and path coefficient studies in tomato. Indian J Agric Res. 2007;41(2):146-149.
- Grubben GJH, Denton OA. Plant Genetic Resources of Tropical Africa 2. Wageningen, Netherlands. 2004.
- Ingole VS, Bhalekar MN, Kagane BV. Assessment of genetic variability in F4 generation of pumpkin (Cucurbita moschata Duch ex. Poir). Pharma Innov J. 2021;10(12):1858-1861.
- Ingole VS, Bhalekar MN, Kagane BV. Genetic studies of F4 progenies in pumpkin (Cucurbita moschata Duch Ex. Poir). Pharma Innov J. 2022;11(1):252-255.
- Kannan A, Rajamanickam C. Genetic variability, correlation and path analysis of F5 generation of ridge gourd (Luffa acutangula (L.) Roxb.) for yield and quality. Int J Curr Microbiol Appl Sci. 2019;8(11):1153-1164.
- Koppad SB, Chavan ML, Hallur RH, Rathod V, Shantappa T. Variability and character association studies in ridge gourd (Luffa acutangula Roxb.) with reference to yield attributes. J Global Biosci. 2015;4(5):2332-2342.
- Mali MD, Musmade AM, Bhalekar MN. Genetic studies in F3 progenies of muskmelon (Cucumis melo L.). Bioinfolet -Q J Life Sci. 2015;12(3b):739-744.
- Manikandaselvi S, Vadivel V, Brindha P. Review on Luffa acutangula L.: Ethnobotany, Phytochemistry, Nutritional Value and Pharmacological Properties. Int J Curr Pharm Rev Res. 2016;7(3):151-155.
- Muttur MS, Mulge R, Gasti VD, Mastiholi AB, Koulagi S, Nagesh GC. Genetic variability studies in F4 generation of pumpkin (Cucurbita spp.). Int J Agric Sci. 2017;9(1):3603-3605.
- Pradhan P, Tripathy P, Sahu GS, Tripathy B, Sourabh S. Assessment of genetic variability in F4 segregating population of bitter gourd (Momordica charantia L.). J Pharmacogn Phytochem. 2021;10(2):1452-1455.
- Pullaiah T. Encyclopedia of World Medicinal Plants. Daya Books 2. 2006;1271-1274.
- Sheshadri VS, Parthasarthy UA. Cucurbits. In: Vegetable Crops. 1980;496-497.
- Thulasiram LB, Ranpise SA, Anarase SA, Kshirsagar DB, Shinde S. Genotypic and phenotypic variability and correlation studies in ridge gourd (Luffa acutangula L. Ruxb.). Int J Plant Soil Sci. 2023;35(13):165-171.
- Vaidya AV, Bhalekar MN, Damse DN. Genetic studies in F4 progenies of bottle gourd (Lagenaria siceraria (Molina) Standl.). Int J Curr Microbiol Appl Sci. 2020;9(8):2616-2622.
Cited by 1
From OpenAlex, OpenCitations and reference lists read by Scinovex
- Genetic variability, trait association and divergence analysis of ridge gourd [Luffa acutangula (L.) Roxb.] genotypes for growth, flowering and yield related traits
Vridulashree V, Mangi VL, Badiger BA, Harsha B, Manu B, Hosamani J · International Journal of Research in Agronomy · 2026
During the kharif season of 2025, eight ridge gourd genotypes were evaluated at the Agricultural Research Station, Kallolli, employing a randomized complete block design with three replications for 15 growth, flowering and yield related traits. Analysis of variance revealed significant genotypic variation for all the traits studied. Gujanatti Local recorded the highest fruit yield (26.26 tonnes per hectare) and seed yield (1.85 tonnes per hectare), whereas Kashi Khushi despite flowering earlier recorded the lowest fruit yield (1.71 tonnes per hectare) due to its limited vegetative growth. Arka