
Research article · 2023 · Full text
International Journal of Statistics and Applied MathematicsOptimization of green gram pumpkin peda by response surface methodology
Volume 8(6S) · Pages 1364–1369 · DOI: 10.22271/maths.2023.v8.i6sr.1602 ↗
Research areasAdvances in Cucurbitaceae ResearchSeed and Plant BiochemistryFood Science and Nutritional Studies
Abstract
Author-writtenThe study was aimed to develop a process to manufacture peda using green gram flour and pumpkin pulp. Optimization of the manufacturing parameters was carried out by using Response Surface Methodology (RSM) with central composite rotatable design (CCRD) using three independent variables viz. green gram flour, pumpkin pulp and sugar percentage on milk weight basis and the responses are measured in terms of sensory attributes like flavor, color and appearance, body and texture, sweetness and overall acceptability. The suggested solution with 93 percent desirability from RSM analysis was 2.537% green gram flour, 10.319% pumpkin pulp and 8.512% sugar taken on the milk weight basis. The interaction effect of green gram flour and pumpkin pulp showed positive effect towards overall acceptability scores.
Summary
Source-checkedPlain-language reading of the full paper, prepared with AI and checked against the text. Each point links to the authors' own words.
Why it matters
- Peda is a popular traditional Indian sweet produced by adding sugar to the Pindi variety of khoa. View evidence ↗
- Green gram is a significant legume crop in India and provides a rich source of proteins, vitamins, minerals, fat, and dietary fiber. View evidence ↗
- Pumpkin is a highly nutritious vegetable that serves as an excellent source of dietary fiber, minerals, vitamins, and alpha and beta carotenes. View evidence ↗
The question
- The objective of the study was to develop a manufacturing process for peda that incorporates pumpkin pulp and green gram flour. View evidence ↗
What they did
- The researchers used Response Surface Methodology (RSM) with a central composite rotatable design (CCRD) to optimize three variables: sugar percentage, pumpkin pulp, and green gram flour, all based on milk weight. View evidence ↗
- A five-member panel of judges used a 9-point hedonic scale to evaluate the peda's sweetness, flavor, overall acceptability, body and texture, and color and appearance. View evidence ↗
- The experimental design consisted of 20 different experiments. View evidence ↗
What they found
- Increasing the amount of green gram flour had a significant negative linear effect on the flavor score. View evidence ↗
- The addition of pumpkin pulp significantly improved the scores for color and appearance. View evidence ↗
- The sweetness of the product decreased significantly as the quantity of green gram flour increased. View evidence ↗
- The optimized formulation, which achieved 93% desirability, consisted of 8.512% sugar, 10.3195% pumpkin pulp, and 2.537% green gram flour. View evidence ↗
- Validation tests showed no significant difference between the observed sensory attributes and the values predicted by the model. View evidence ↗
What it means
- The authors conclude that green gram pumpkin peda can be successfully prepared using 2.537% green gram flour, 10.319% pumpkin pulp, and 8.512% sugar based on milk weight. View evidence ↗
Visual summary
3 visualsIllustrations explain the paper; charts are replotted from the paper's own table values.
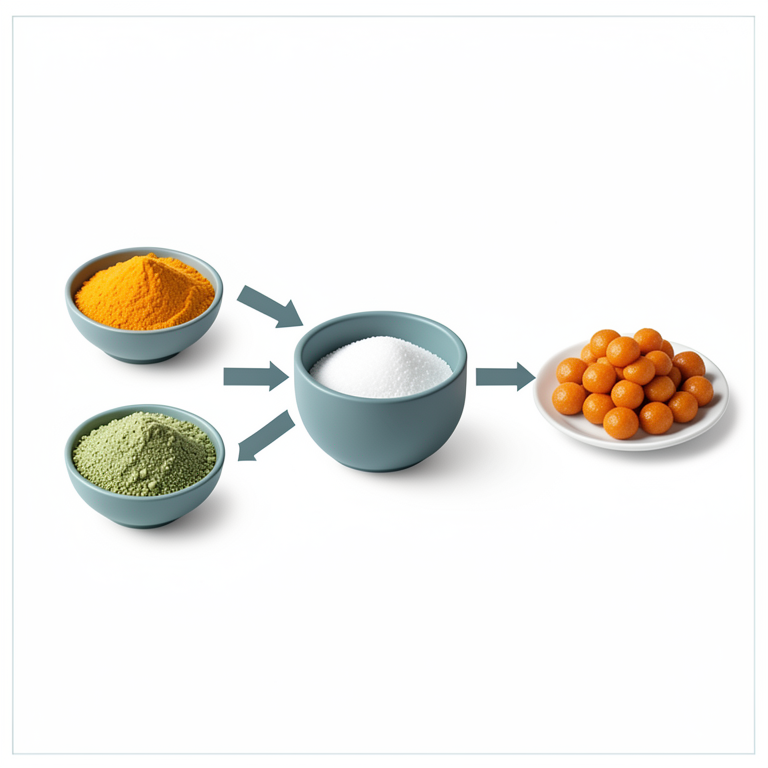
Optimization Process Flow
AI-generated conceptual illustration (green gram pumpkin peda (Indian sweet confection)). It explains the idea and does not show study data.
View source evidence ↗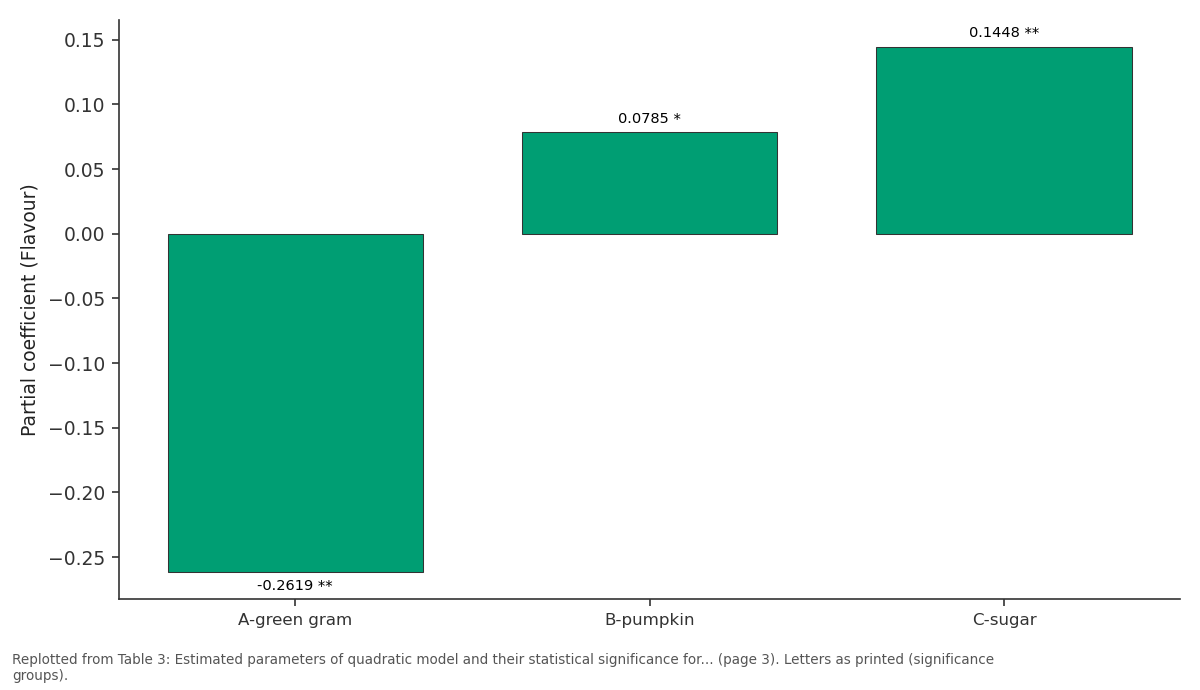
Flavour: A-green gram vs B-pumpkin vs C-sugar
Replotted from Table 3 (page 3) of the original paper. Every bar is the paper's own table value.
View source evidence ↗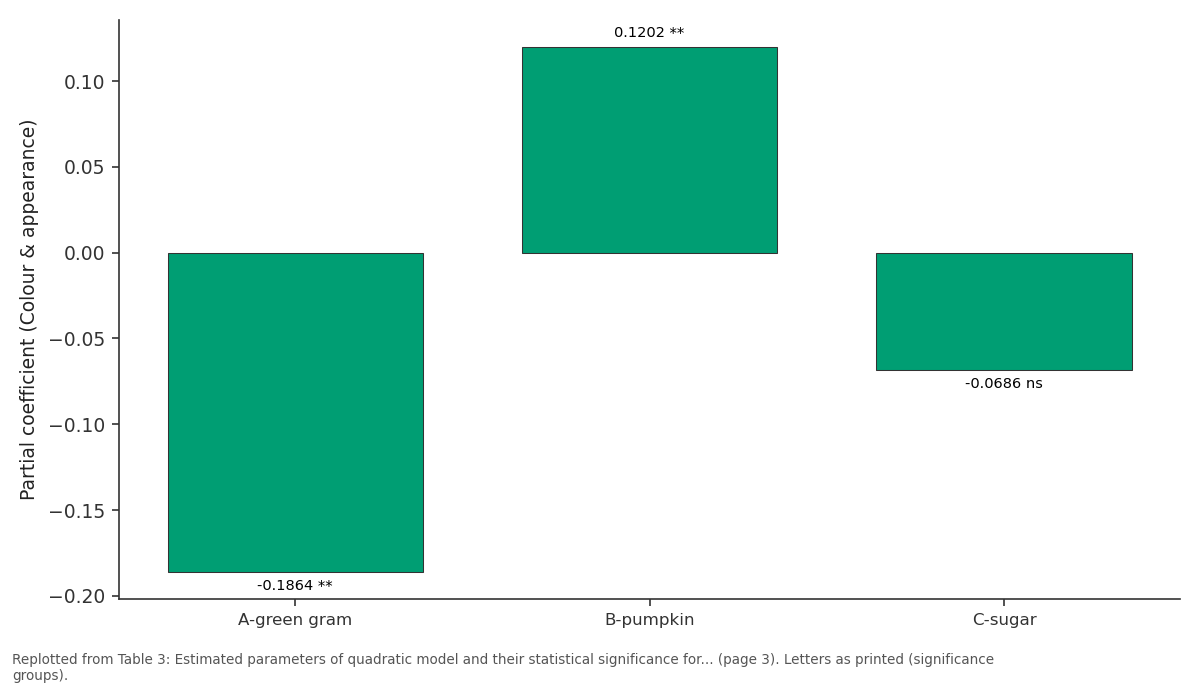
Colour& appearance: A-green gram vs B-pumpkin vs C-sugar
Replotted from Table 3 (page 3) of the original paper. Every bar is the paper's own table value.
View source evidence ↗Figures & tables
From the original paper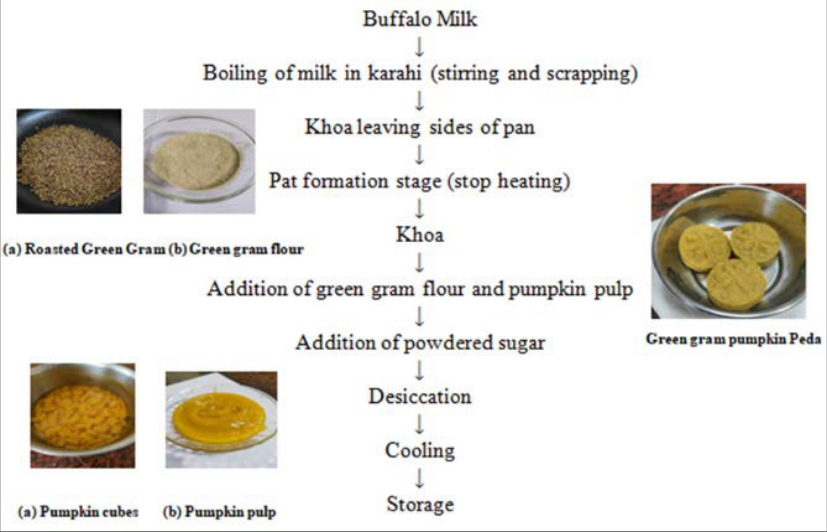 Figure 1
 Table 1
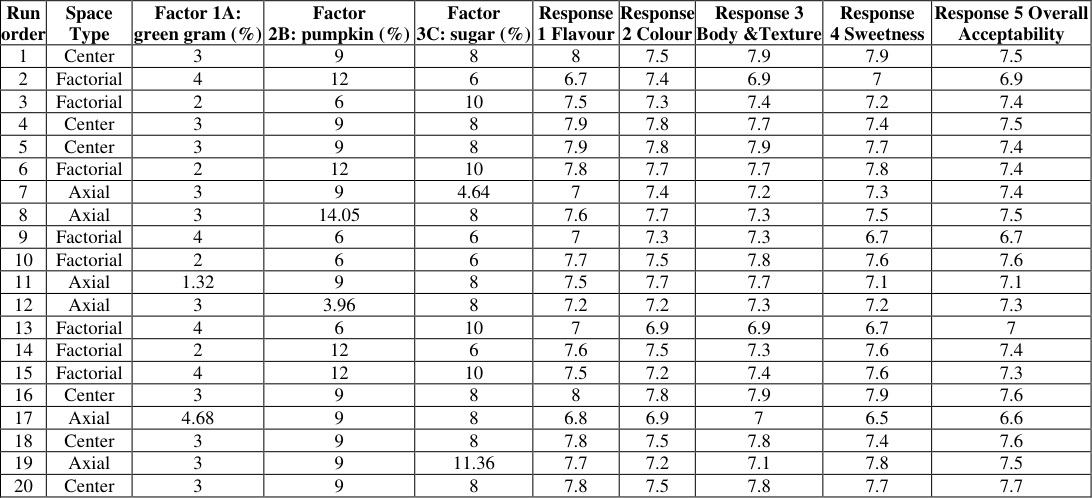 Table 2
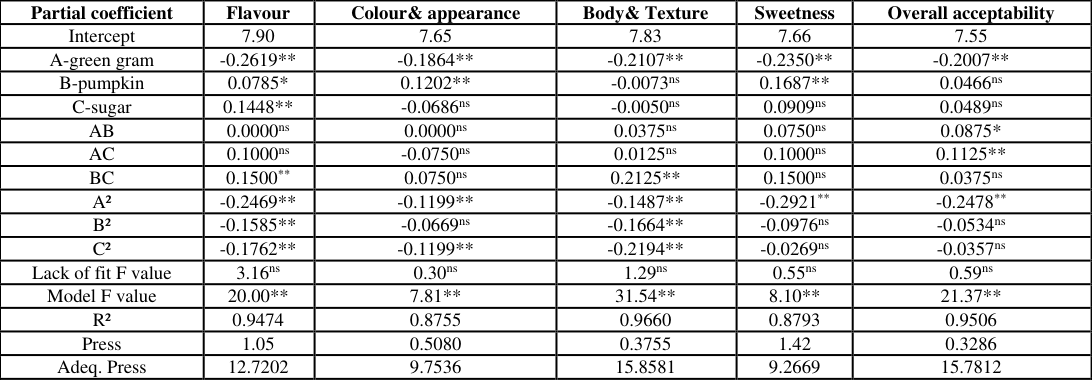 Table 3
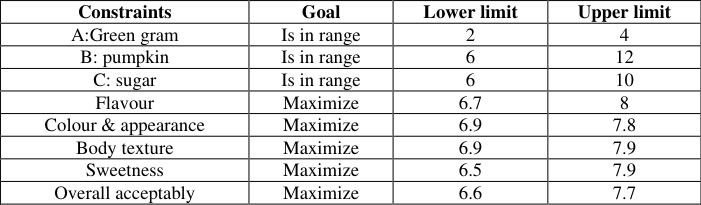 Table 4
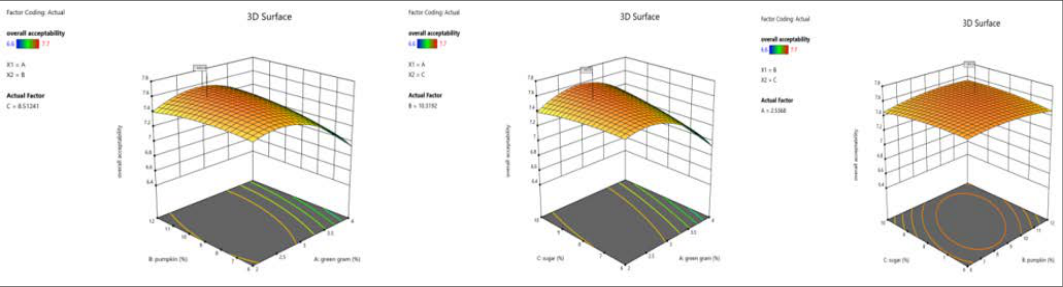 Figure 2
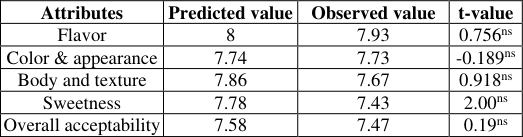 Table 5
Introduction
In India, about 50% of the total milk produced in the country is converted into traditional milk products. The conversion of milk to traditional dairy products leads to value addition of these products besides improving their shelf life at room temperature. Among the traditional milk sweets, Peda is a highly popular Indian sweet made from Pindi variety of khoa by adding sugar. It has got higher shelf life because of lower moisture content and sugar in it. Due to its popularity and demand there is a great opportunity for innovation and product diversification of peda. Green gram (Vigna radiata L.) alternatively known as mung bean, maash, mung is an ancient and well known third most important legume crop of India. They are rich source of proteins, dietary fiber, fat, vitamins and minerals. Rajiv et al. (2012) [7] reported that green gram flour can be used to prepare cookies. The Green gram flour added at 40% to cookies increased the protein content by 1.25 times, iron by 1.6 times, calcium and zinc by 2 times and total dietary fibre by 2.3 times than the control. Pumpkin (Cucurbita moschata or Cucurbita spp.) is a vegetable with high nutritive value and excellent source of beta and alpha carotenes, vitamins, minerals and dietary fiber. Pumpkin can be converted into a variety of value added products such as jam, jelly, marmalade, candy, puree, sauce, chutney, pickle and halwa (Dhiman et al., 2009) [3] . Gotarne et al. (2015) [4] enhanced the nutritive value of peda by addition of date's powder. The brown dates-peda was prepared by optimizing the levels of date powder (5%, 10%, and 15%) and sugar (15%, 20%, and 25%) using RSM. In total, thirteen formulations with different levels of dried date powder flesh (3-17%) and sugar (13-27%) were prepared as per CCRD design for sensory evaluation. The 10% date powder and 27% sugar had highly desirable sensory quality scores viz., flavor (9), body& texture (8.5), color &appearance (4.5) and overall acceptability (22).The Response model coefficients for overall acceptance (OA) were significant (p≤0.01) and positive in linear form (1.254) for sugar, and significant (p≤0.05) and negative (-0.685) in quadratic form for date powder (R 2 = 0.86). The Response model coefficients and the R 2 values indicated that the second order polynomial models can be used as a good fit to predict the sensory changes.
The incorporation of green gram flour and pumpkin pulp can improve the nutritional profile of Peda viz. the protein and crude fiber content can be increased. The present paper deals optimization and preparation of Peda by incorporation with Green gram flour, sugar and pumpkin pulp using RSM (Response Surface Methodology) statistics tool.
Materials and Methods
The buffalo milk used was procured from University Dairy Plant, Mannuthy, Thrissur, Kerala. The green gram, pumpkin and sugar were purchased from local market.
Preparation of Green Gram Flour
The green gram flour was prepared as per the method suggested by Mishra et al. (2020) [5] . The green gram seeds were cleaned and it was soaked in water for 8 -12 hours or overnight steeping was done. The sprouted green gram was then roasted in frying pan for 15 minutes. Later, it was cooled and grounded into powder using mixer grinder.
Preparation of Pumpkin pulp
The fully ripened Pumpkin was cleaned, manually peeled and cut into cubes. Then the Pumpkin cubes were blanched in boiling water for 10 minutes. The water was drained out and cubes were transferred to mixer grinder to obtain pumpkin pulp (Barakat and Hassan, 2017) [2] .
Preparation of Green gram Pumpkin Peda
Peda was prepared according to process mentioned by Aneja et al. (2002) [1] . Buffalo milk was boiled in iron karahi and it was continuously stirred and scrapped using ladle. The desiccation continued till khoa pat was obtained. The obtained khoa was mixed thoroughly with green gram flour, pumpkin pulp and powdered sugar. It was further desiccated to obtain relatively firm dough. The whole mass was transferred to greased tray and allowed to cool. After cooling, the dough was portioned and molded into round shapes using peda mould. Then it was packed and stored in LDPE pouches.
Experimental Design for Optimization of Levels of Green gram Pumpkin Peda
The Central Composite Rotatable Design (CCRD) of Response Surface Methodology (Design-Expert software Version 9) was used for the optimization of Green gram pumpkin peda. The ranges for experimental parameters were selected based on preliminary trials. Peda was prepared using the combination of different levels of green gram flour, pumpkin pulp and sugar as per the procedure in Fig. 1. The response to variation in process parameter was measured in terms of flavor, color and appearance, body and texture, sweetness and overall acceptability. The responses obtained were fed to the software and the levels of the variables were optimized. The model adequacy was evaluated by the coefficients of determination (R 2 ), lack of fit test, PRESS, Adequate Precision Value (APV) and the F value (At 5% level significance). The predicted sensory scores responses corresponding to the optimum levels of the factors were statistically analyzed using actual responses in a one sample t test of SPSS 24 software.
Sensory evaluation
The peda sample was evaluated on a 9 point hedonic scale by a selected panel of judges comprising five members for sensory attributes like flavor, color and appearance, body and texture, sweetness and overall acceptability.
Results and Discussions 3.1 Optimization of levels of green gram, pumpkin pulp and sugar by response surface methodology
The minimum and maximum levels of three independent factors i.e. "green gram flour", "pumpkin pulp" and "sugar" percentage on milk weight basis were selected and set to their levels coded as -1, 0 and +1 are depicted in Table 1. The experimental design had 20 experiments. The design matrix representing different combinations of the three independent actors and their sensory responses are presented in the Table 2. The treatments are listed in run order. A quadratic regression model was fitted to the experimental data. A second order polynomial regression model for the dependent variables was established to fifth experimental data for each response. Regression models developed from the experimental data were found to be significant with the observed p-values. The partial regression coefficients of linear, quadratic and interaction terms for each model and their R 2 values, F values, lack of fit, APV and PRESS values with their significance are shown in the Table 3. The surface plots (3-D) for the effect of variables on sensory characteristics of green gram pumpkin peda is shown in Fig 2. In the quadratic model by RSM, F value of the sensory characteristics was greater than tabled F value showing the developed model is significant. The coefficient of determination (R 2 ) for flavor, color, and appearance, body and texture sweetness and overall acceptability were found to be 0.9474, 0.8755, 0.9660, 0.8793, 0.9506 respectively revealed that the quadratic model indicated more than 80% of the deviation in the data. The non-significant lack of fit, significant F-test value, R 2 value of more than 0.8 and adequate precision value of more than four for all the sensory attributes indicate that the model is fit and it can give a good prediction of the parameters under study.
| Partial coefficient | Flavour | Colour& appearance | Body& Texture | Sweetness | Overall acceptability |
|---|---|---|---|---|---|
| Intercept | 7.90 | 7.65 | 7.83 | 7.66 | 7.55 |
| A-green gram | -0.2619** | -0.1864** | -0.2107** | -0.2350** | -0.2007** |
| B-pumpkin | 0.0785* | 0.1202** | -0.0073ns | 0.1687** | 0.0466ns |
| C-sugar | 0.1448** | -0.0686ns | -0.0050ns | 0.0909ns | 0.0489ns |
| AB | 0.0000ns | 0.0000ns | 0.0375ns | 0.0750ns | 0.0875* |
| AC | 0.1000ns | -0.0750ns | 0.0125ns | 0.1000ns | 0.1125** |
| BC | 0.1500** | 0.0750ns | 0.2125** | 0.1500ns | 0.0375ns |
| A² | -0.2469** | -0.1199** | -0.1487** | -0.2921** | -0.2478** |
| B² | -0.1585** | -0.0669ns | -0.1664** | -0.0976ns | -0.0534ns |
| C² | -0.1762** | -0.1199** | -0.2194** | -0.0269ns | -0.0357ns |
| Lack of fit F value | 3.16ns | 0.30ns | 1.29ns | 0.55ns | 0.59ns |
| Model F value | 20.00** | 7.81** | 31.54** | 8.10** | 21.37** |
| R² | 0.9474 | 0.8755 | 0.9660 | 0.8793 | 0.9506 |
| Press | 1.05 | 0.5080 | 0.3755 | 1.42 | 0.3286 |
| Adeq. Press | 12.7202 | 9.7536 | 15.8581 | 9.2669 | 15.7812 |
Table text extracted from the original PDF; superscript letters are shown inline. The original table image is below.
View original table image
| Run order | Space Type | Factor 1A: green gram (%) | Factor 2B: pumpkin (%) | Factor 3C: sugar (%) | Response 1 Flavour | Response 2 Colour | Response 3 Body &Texture | Response 4 Sweetness | Response 5 Overall Acceptability |
|---|---|---|---|---|---|---|---|---|---|
| 1 | Center | 3 | 9 | 8 | 8 | 7.5 | 7.9 | 7.9 | 7.5 |
| 2 | Factorial | 4 | 12 | 6 | 6.7 | 7.4 | 6.9 | 7 | 6.9 |
| 3 | Factorial | 2 | 6 | 10 | 7.5 | 7.3 | 7.4 | 7.2 | 7.4 |
| 4 | Center | 3 | 9 | 8 | 7.9 | 7.8 | 7.7 | 7.4 | 7.5 |
| 5 | Center | 3 | 9 | 8 | 7.9 | 7.8 | 7.9 | 7.7 | 7.4 |
| 6 | Factorial | 2 | 12 | 10 | 7.8 | 7.7 | 7.7 | 7.8 | 7.4 |
| 7 | Axial | 3 | 9 | 4.64 | 7 | 7.4 | 7.2 | 7.3 | 7.4 |
| 8 | Axial | 3 | 14.05 | 8 | 7.6 | 7.7 | 7.3 | 7.5 | 7.5 |
| 9 | Factorial | 4 | 6 | 6 | 7 | 7.3 | 7.3 | 6.7 | 6.7 |
| 10 | Factorial | 2 | 6 | 6 | 7.7 | 7.5 | 7.8 | 7.6 | 7.6 |
| 11 | Axial | 1.32 | 9 | 8 | 7.5 | 7.7 | 7.7 | 7.1 | 7.1 |
| 12 | Axial | 3 | 3.96 | 8 | 7.2 | 7.2 | 7.3 | 7.2 | 7.3 |
| 13 | Factorial | 4 | 6 | 10 | 7 | 6.9 | 6.9 | 6.7 | 7 |
| 14 | Factorial | 2 | 12 | 6 | 7.6 | 7.5 | 7.3 | 7.6 | 7.4 |
| 15 | Factorial | 4 | 12 | 10 | 7.5 | 7.2 | 7.4 | 7.6 | 7.3 |
| 16 | Center | 3 | 9 | 8 | 8 | 7.8 | 7.9 | 7.9 | 7.6 |
| 17 | Axial | 4.68 | 9 | 8 | 6.8 | 6.9 | 7 | 6.5 | 6.6 |
| 18 | Center | 3 | 9 | 8 | 7.8 | 7.5 | 7.8 | 7.4 | 7.6 |
| 19 | Axial | 3 | 9 | 11.36 | 7.7 | 7.2 | 7.1 | 7.8 | 7.5 |
| 20 | Center | 3 | 9 | 8 | 7.8 | 7.5 | 7.8 | 7.7 | 7.7 |
Table text extracted from the original PDF; superscript letters are shown inline. The original table image is below.
View original table image
| Independent factors | Coded levels | — | — | — | — |
|---|---|---|---|---|---|
| -α | -1 | 0 | +1 | +α | |
| A:Green gram flour% | 1.32 | 2 | 3 | 4 | 4.68 |
| B: Pumpkin pulp% | 3.98 | 6 | 9 | 12 | 14.04 |
| C:Sugar% | 4.64 | 6 | 8 | 10 | 11.36 |
Table text extracted from the original PDF; superscript letters are shown inline. The original table image is below.
View original table image
Effect on Flavor
The model showed a significant F-value whereas lack of fit was found to be non-significant. A coefficient of determination (R 2 =0.95) indicated 95 percent variations in the response shown by the variables in the model. Adequate precision ratio of 12.7202 was obtained which indicates and equate signal. Figures 2 illustrate the 3D response surface graphs obtained for flavor. The sensory scores obtained for the flavor of green gram pumpkin peda ranged from 6.7 to 8. Treatment no 1 and 16 have got the maximum score while minimum score was obtained for the treatment 2. In linear effect, as quantity of green gram flour increases the flavor score decrease significantly. The pumpkin pulp and sugar showed positive towards the flavor. The interaction effect of pumpkin pulp and sugar showed significant positive effect towards flavor scores. Quadratic effect the quantity of green gram flour pumpkin pulp and sugar showed significant negative effect on flavor scores. The result of effect of sugar on flavor was found similar to work done by Gotarne et al. (2015) [4] who optimized date powder and sugar in brown dates peda by RSM and found that coefficients (RMCs) for flavor were significant (p≤0.01) and negative (-0.178) in quadratic form for sugar (R 2 = 0.88).
Effect on Colour and Appearance
The scores obtained varied from 6.9 to 7.8 with maximum score for the treatment 4,5,16 and minimum for treatment 13 and17. In linear effect, as quantity of green gram flour increased the color and appearance score decreased significantly. But the addition of pumpkin pulp significantly improved the color and appearance score. In quadratic effect, the quantity of green gram flour and sugar showed significant negative effect on color and appearance scores. Shukla et al. (2016) [8] observed that when the green gram flour was used to fortify protein content in biscuits it significantly decreased the color score during storage. Patel et al. (2020) [6] revealed that score of color and appearance of pumpkin flavored buffalo milk improve significantly the concentration of pumpkin pulp increased this may be due to concentration of beta carotene.
Effect on body and texture
The sensory scores obtained for the body and texture of green gram pumpkin peda ranged from 6.9 to 7.9. In linear effect, as quantity of green gram flour increases the body and texture score decrease significantly. The interaction effect of pumpkin pulp and sugar showed significant positive effect towards body and texture scores. In quadratic effect the quantity of green gram flour pumpkin pulp and sugar showed significant negative effect on body and texture scores. Mishra et al. (2020) [5] revealed that as the percentage of green gram flour increased the body and texture scores decreased from 8 to 7 in cookies fortified with green gram flour of 50 to 75%.
Effect on sweetness
The model showed a significant F-value of 8.10 whereas lack of fit was found to be non-significant. A coefficient of determination (R 2 ) of 88 percent was obtained which indicated 88 percent variations in the response shown by the variables in the model. The sweetness score ranged from 6.5 to 7.9. In linear effect, as quantity of green gram flour increased the sweetness of the product decrease significantly. But addition of the pumpkin pulp significantly improved the sweetness of product. Quadratic effect the quantity of green gram flour showed significant negative effect on sweetness scores.
Effect on Overall acceptability
The coefficient of determination (R 2 ) of 0.9506 with adequate precision of 15.78 firmly suggests the use of this response viz. overall acceptability to guide the design. The sensory scores for overall acceptability ranged from 7.7 to 6.6 with highest score for the treatment 20 and lowest for treatment 17. In linear and quadratic effect, as the quantity of green gram flour increased the overall acceptability score decreased significantly. The interaction effect of green gram flour and pumpkin pulp showed positive effect towards overall acceptability scores. Similar results were obtained by Patel et al. (2020) [6] who found that the overall acceptability scores got increased by increasing the level of pumpkin pulp and sugar in pumpkin flavored buffalo milk. Mishra et al. (2020) [5] revealed that as the percentage of green gram flour increased the overall acceptability scores decreased from 7.8 to 6.1 in cookies fortified with green gram flour of 50 to 75 percentages.
Optimized Solutions and their Validation
Numerical optimization was carried out with the goal to obtain best feasible formulation of green gram flour, pumpkin pulp, and sugar in the preparation of peda. All the factors were kept in range and the sensory scores were kept at maximum. The constraints and criteria that had been generated by RSM for the development of peda incorporated with green gram and pumpkin pulp is given in the Table 4. The optimum values selected were 2.537% green gram flour, 10.3195% pumpkin pulp and 8.512% sugar with desirability of 93%. The predicted values for sensory score responses, flavor, color and appearance, body and texture, sweetness and overall acceptability were 8.0, 7.74, 7.8.6, 7.8 and 7.58 respectively. Green gram pumpkin peda was prepared by the addition of the ingredients at the levels recommended by RSM. The result obtained were statistically analyzed using ttest with the corresponding predicted value. Closeness between the observed and predicted values is depicted in Table 5. There was no significant difference between the predicted and observed value with regard to all sensory attributes
| Attributes | Predicted value | Observed value | t-value |
|---|---|---|---|
| Flavor | 8 | 7.93 | 0.756ns |
| Color & appearance | 7.74 | 7.73 | -0.189ns |
| Body and texture | 7.86 | 7.67 | 0.918ns |
| Sweetness | 7.78 | 7.43 | 2.00ns |
| Overall acceptability | 7.58 | 7.47 | 0.19ns |
Table text extracted from the original PDF; superscript letters are shown inline. The original table image is below.
View original table image
| Constraints | Goal | Lower limit | Upper limit |
|---|---|---|---|
| A:Green gram | Is in range | 2 | 4 |
| B: pumpkin | Is in range | 6 | 12 |
| C: sugar | Is in range | 6 | 10 |
| Flavour | Maximize | 6.7 | 8 |
| Colour & appearance | Maximize | 6.9 | 7.8 |
| Body texture | Maximize | 6.9 | 7.9 |
| Sweetness | Maximize | 6.5 | 7.9 |
| Overall acceptably | Maximize | 6.6 | 7.7 |
Table text extracted from the original PDF; superscript letters are shown inline. The original table image is below.
View original table image
Conclusion
Central Composite Rotatable Design of Response Surface Methodology was used to optimize the various levels of green gram flour, pumpkin pulp and sugar on the sensory characteristics such as flavor, color and appearance, body and texture, sweetness and overall acceptability. The coefficients of determination (R 2 ) of Flavor, Color and appearance, Body and Texture, sweetness and Overall acceptability were 0.9474, 0.8755, 0.9660, 0.8793 and 0.9506 respectively, indicating that the fitted quadratic model explained more than 80 per cent of the variation in the experimental data. Green gram pumpkin peda can be prepared from 2.537% green gram flour, 10.319% pumpkin pulp and 8.512% sugar taken on the milk weight basis.
Acknowledgement
AcknowledgmentsThe authors gratefully acknowledge the infrastructure and laboratory support extended by Department of Dairy Technology, Verghese Kurien Institute of Dairy and Food Technology, Kerala Veterinary Animal Sciences University, Mannuthy, Thrissur to carry out study.
References
7 in the original paper- Barakat H, Hassan MFY. Chemical, Nutritional, Rheological and Organoleptical Characterizations of Stirred Pumpkin-Yoghurt. Food and Nutrition Sciences. 2017;8:746-759.
- Dhiman AK, Sharma KD, Attri S. Functional constituents and processing of pumpkin: A review. Journal of Food Science and Technology. 2009;46(5):411-417.
- Gotarne RR, Londhe GK, Korake RL. Optimization of levels of dates powder and sugar in brown dates-peda by response surface methodology. Animal Science Reporter. 2015;9(3):95-104.
- Mishra P, Devi S, Sonkar S, Singh S, Prakash HG. Formulation of High Protein Cookies Fortified with Green gram. International Journal of Creative Research Thoughts. 2020;8(8):3332-3336.
- Patel AS, Bariya AR, Ghodasara SN, Chavda JA, Patil SS. Total carotene content and quality characteristics of pumpkin flavored buffalo milk. Heliyon. 2020;6(7):1-5.
- Rajiv J, Lobo S, Jyothi Lakshmi A, Venkateswara Rao G. Influence of green gram flour (Phaseolus aureus) on the rheology, microstructure and quality of cookies. Journal of Texture studies. 2012;43(5):350-360.
- Shukla RN, Mishra AA, Gautam AK. Development of protein enriched biscuit fortified with green gram flour. Food Science Research Journal. 2016;7(1): 112-118.