
Research article · 2024 · Full text
International Journal of Agriculture Extension and Social DevelopmentThe study on effect of online marketing in purchasing of dairy products
Volume 7(1) · Pages 182–185 · DOI: 10.33545/26180723.2024.v7.i1c.206 ↗
Research areasCOVID-19 Pandemic ImpactsDigital Marketing and Social MediaDiverse Scientific Research Studies
Abstract
Author-writtenIn this paper the study of the impact of online marketing on purchase decisions in dairy industry is discussed. Interest in online shopping increased significantly during last few years. The trade restrictions imposed by COVID-19, forced the market to align with non-traditional options like online marketing. Thus an analysis about various parameters which influence purchase decisions of the buyers was carried out. The study reveals that product features play the most important part in making a favourable customer attitude. Respondents gave more importance to perceived ease of use. Respondents gave second rank to perceived benefits. This is followed by, product features, customer preferences and brand preferences. They gave least importance to social influence.
Summary
Source-checkedPlain-language reading of the full paper, prepared with AI and checked against the text. Each point links to the authors' own words.
Why it matters
- The COVID-19 pandemic's trade restrictions accelerated the shift toward online marketing as a necessary non-traditional business option. View evidence ↗
- Social distancing and remote work created a fundamental need for brands to utilize virtual marketing for customer interaction and general business operations. View evidence ↗
The question
- The study aims to analyze the potential of online marketing for milk and milk products by examining consumer attitudes. View evidence ↗
What they did
- The research was conducted within the Thrissur municipal corporation in Kerala, India. View evidence ↗
- The study utilized a convenient sampling method to collect data from 100 customers who use online platforms. View evidence ↗
- Primary data was gathered through a structured interview schedule designed around the study's objectives. View evidence ↗
- The researchers employed correlation and regression analyses to evaluate the collected data. View evidence ↗
What they found
- Product features had a high overall mean score of 4.5, suggesting they significantly influence customer attitude and make product lines more attractive. View evidence ↗
- Perceived benefits were found to influence consumers, with an overall mean score of 3.93. View evidence ↗
- Perceived ease of use received an overall mean score of 4.17, indicating it is an important factor affecting consumer attitude. View evidence ↗
- Social influence had a moderate overall mean of 3.21, suggesting it is not a primary factor in decision or attitude formation. View evidence ↗
- Correlation analysis showed the strongest relationship between perceived benefits and customer attitude, with a coefficient of 0.71023 (p=0.004). View evidence ↗
- Ranking analysis identified product features as the most important factor (Rank 1, Mean 85.31), although the author's text contradictory mentions perceived ease of use as 1st rank. View evidence ↗
What it means
- The authors conclude that product features are the most critical element in creating a favorable customer attitude toward dairy products. View evidence ↗
- The authors recommend focusing on impressing third-party distributors to increase sales, as customers trust products that distributors are willing to order. View evidence ↗
Visual summary
2 visualsIllustrations explain the paper; charts are replotted from the paper's own table values.
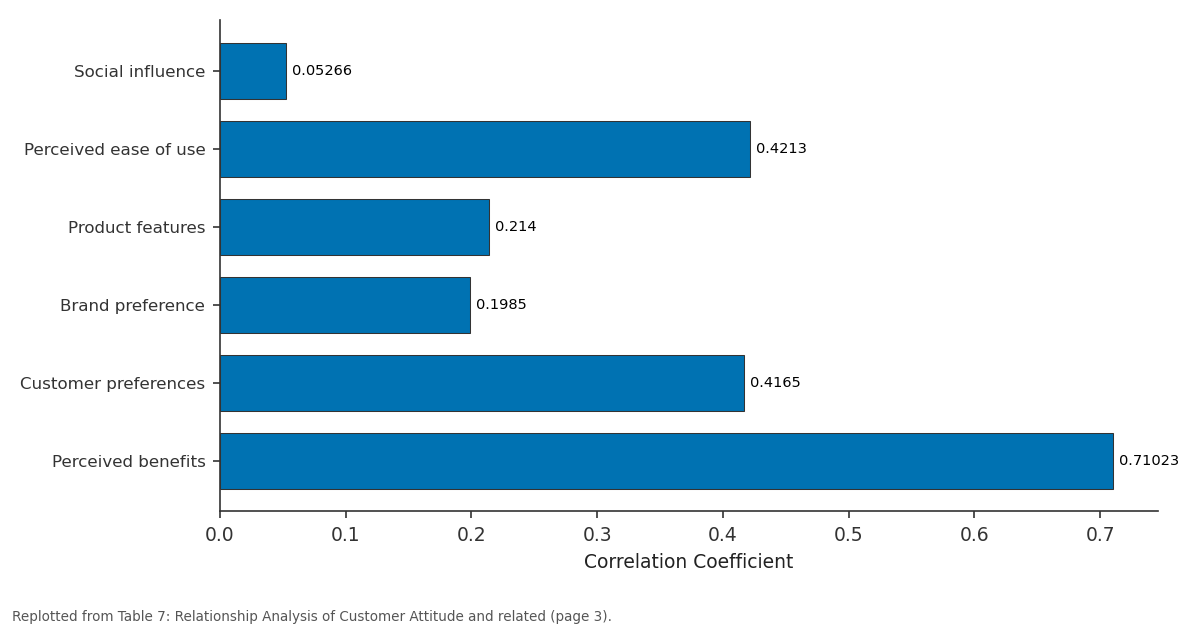
Correlation Coefficient: Social influence vs Perceived ease of use vs Product features vs Brand preference vs Customer preferences
Replotted from Table 7 (page 3) of the original paper. Every bar is the paper's own table value.
View source evidence ↗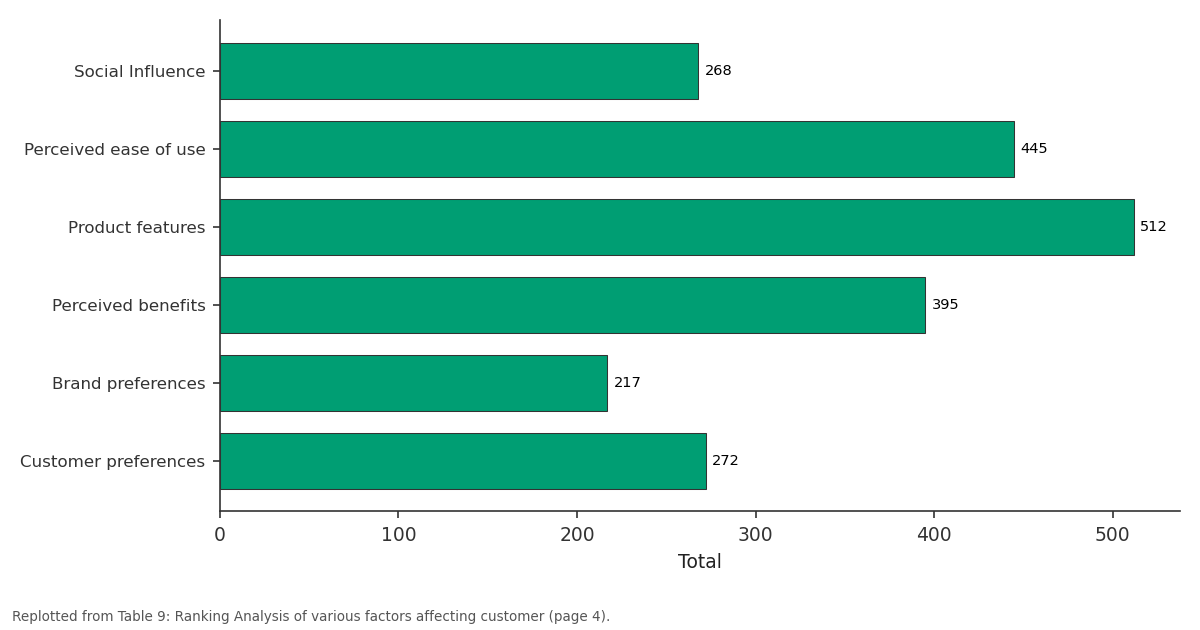
Total: Social Influence vs Perceived ease of use vs Product features vs Perceived benefits vs Brand preferences
Replotted from Table 9 (page 4) of the original paper. Every bar is the paper's own table value.
View source evidence ↗Figures & tables
From the original paper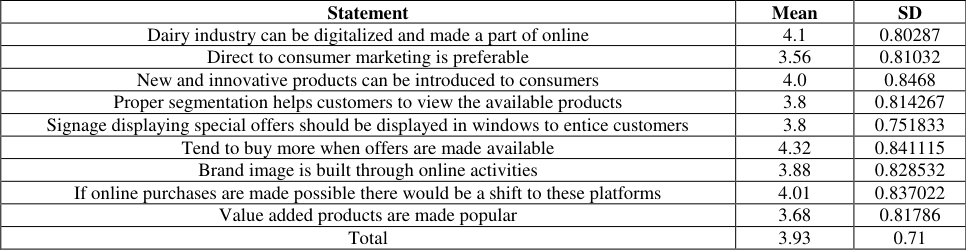 Table 1
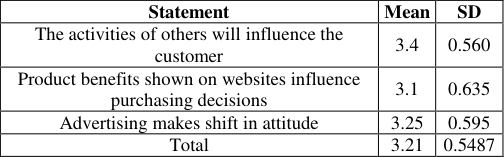 Table 3
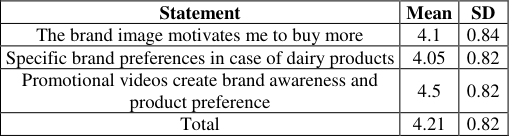 Table 2
 Table 4
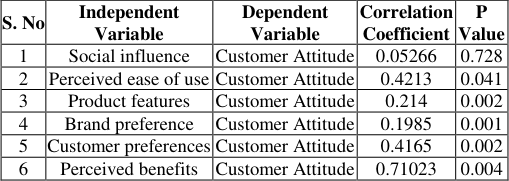 Table 7
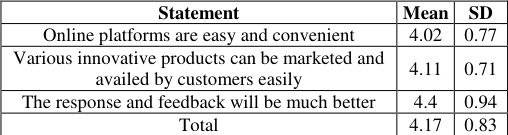 Table 5
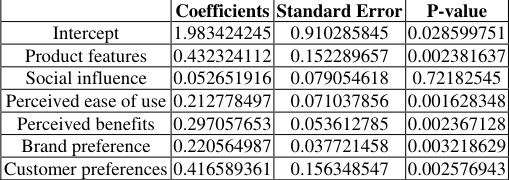 Table 8
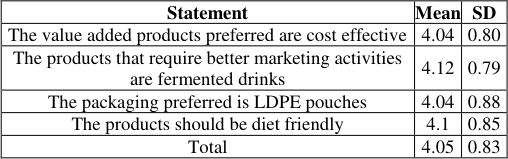 Table 6
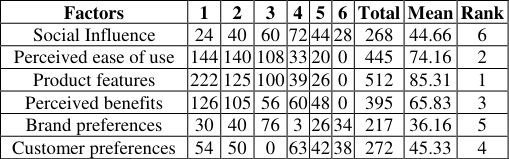 Table 9
Introduction
During the pandemic, interest in online shopping increased significantly. The outbreak of the Covid-19 pandemic had upended the projections of every business and digital marketing is no exception. The transition to remote work prompted by the social distancing measures has created the need for virtual marketing of brands, customer interactions and basically conducting overall business. The crippling impacts in the early couple of months during the first wave of the pandemic have been long-lasting and potentially permanent in case of certain businesses. Thus, internet has become the medium which has helped people lead a simpler life. This project is to study the attitude of consumers in online marketing of milk and milk products and thereby analyse the potential for marketing. This paper aims to study the potential of online marketing for milk and milk products.
Materials and Methods
The study is analytical in nature and tries to analyse the potential of online marketing for milk and milk products in Thrissur Corporation.
Data Source:
Primary data is used for the study.
Sampling Design 2.1.1.1 Selection of Location:
The study was conducted in Thrissur municipal corporation, Kerala, India.
Selection of respondents:
The study was conducted among 100 customers using online platforms using convenient sampling method.
Method of Data Collection
The primary data was collected using structured interview schedule to be developed based on the objectives of study.
Variables
Variables
Statistical Tools Used for the Study
The data collected was analysed using appropriate statistical tools such as Correlation analysis and Regression analysis
Correlation Analysis
Correlation analysis in research is a statistical method used to measure the strength of the linear relationship between two variables and compute their association. Correlation analysis calculates the level of change in one variable due to the change in the other. Researchers use correlation analysis to analyse quantitative data collected through research methods like surveys and live polls. They try to identify the relationship, patterns, significant connections, and trends between two variables or datasets. There is a positive correlation between two variables, when an increase in one variable leads to the increase in the other. On the other hand, a negative correlation means that when one variable increases, the other decreases and vice-versa. Correlation between two variables can be either a positive correlation, a negative correlation, or no correlation.
Regression Analysis
Regression analysis is a set of statistical methods used for the estimation of relationships between a dependent variable and one or more independent variables. It can be utilized to www.extensionjournal.com assess the strength of the relationship between variables and for modeling the future relationship between them.
Operational Definitions Used in the industry
Attitude: measure of how a consumer evaluates the marketing efforts Online marketing: online marketing is "efforts to market. Products and services and build customer relationships over the Internet
Consumers
Consumer is any person buys goods or avail any service for a consideration and includes any user except for the person who has availed such services or goods for the purchase of resale or commercial use.
Results and Discussion
The collected data regarding various factors that influence the consumer attitude are presented as under.
Perceived benefits
Perceived benefits refer to an individual's assessment of the value or efficacy of engaging in a health-promoting behavior to decrease risk of disease. If an individual believes that a particular action will reduce susceptibility to a health problem or decrease its seriousness, then he or she is likely to engage in that behavior regardless of objective facts regarding the effectiveness of the action. Here the customer is trying to find a health benefit from consumption of the product. The table above shows the overall mean and standard deviation of how brand image creates an overall impression in the minds of the customers. The mean obtained from the following statements is 3.93 which is quiet high indicating that the consumers are influenced by the perceived benefits. Most of the customers had given "agree and strongly agree" as their responses which means that display plays an important role in consumers shopping behaviour.
Brand preference
Brand preference reflects a desire to use a particular company's products or services, even when there are equally priced and equally-available alternatives. In fact, more often than not, brand preference indicates a desire to seek out a specific product or service, even when it requires paying more or expending more effort to obtain it. Brand preference is important to companies because it provides an indicator of their customers' loyalty, the success of their marketing tactics, and the strength of their respective brands. According to the table given above it is been observed that the correlation coefficient i.e 0.4213 obtained when correlational analysis was done between brand preference and customer attitude was significant and so it can be concluded that brand preference plays an important role in the customer attitude
Product features
Product features are the characteristics of your product. These are the plain facts about the productits size, weight, and functionality. These are elements that are more important in the eyes of the customer. www.extensionjournal.com The table above shows the responses given by customers to the above statements relating to product features. The overall mean is 4.5 which is quiet high as most of the customers have given agree and strongly agree as the responses indicating that product features make the product line look more attractive and capable of influencing the customer attitude.
Perceived ease of use
This refers to the way in which the customer perceives a product or service to convenient to use. It conveys an idea of the image about the product or service The response and feedback will be much better 4.4 0.94 Total 4.17 0.83
The table above shows the the responses relating to the statements about their perceived ease of use. The overall mean is 4.17 which indicates that consumers place colour as an important factor which affects the consumers attitude
Customer preference
Customer preferences are inclinations, expectations, motivations, dislikes and likes that influence the buying decisions of potential buyers. These are factors that push clients in purchasing various products in the market. The table above shows the responses given by consumers on the questions relating to their preferences. The overall mean is 4.045 which is high indicating that preferences are important factors
Relationship Analysis
The correlation analysis was conducted between the various independent and dependent variables. The following results were obtained after the analysis which is given in the table below. The regression equation indicates that product features, social influence, perceived ease of use, perceived benefits, brand preferences and customer preferences are the factors which are positively related with frequency of customer attitude.
Ranking analysis of different factors affecting customer attitude
Given below is the ranking analysis of different factors affecting customer attitude Towards online platforms ranked according to their choices. From the above table the following can be interpreted: Respondents give more importance (1st rank) to perceived ease of use. Respondents give second rank to perceived benefits. This is followed by, product features, customer preferences and brand preferences. They give least importance to social influence. www.extensionjournal.com
Conclusion
From the results of the research it has been found that the product features play the most important part in making a favourable customer attitude. We should know about the price point of the product, competition level of the product, and possible changes in price and competition that affect our market. These help to further improve our features. One additional element included in marketing strategy should be to be unique in the market. We can target the category of dairy products or we may separate two distinct products with similar names. The focus of our dairy products should be to impress the distributor (third parties) as well to order more of our product. Customers will place more trust in your product based on their good rapport with your distributor and the fact that the distributor is willing to place an order. This will lead to the distributor making more exciting orders, all designed to increase the sales of dairy product.
Figures and tables from the paper
| Statement | Mean | SD |
|---|---|---|
| Dairy industry can be digitalized and made a part of online | 4.1 | 0.80287 |
| Direct to consumer marketing is preferable | 3.56 | 0.81032 |
| New and innovative products can be introduced to consumers | 4.0 | 0.8468 |
| Proper segmentation helps customers to view the available products | 3.8 | 0.814267 |
| Signage displaying special offers should be displayed in windows to entice customers | 3.8 | 0.751833 |
| Tend to buy more when offers are made available | 4.32 | 0.841115 |
| Brand image is built through online activities | 3.88 | 0.828532 |
| If online purchases are made possible there would be a shift to these platforms | 4.01 | 0.837022 |
| Value added products are made popular | 3.68 | 0.81786 |
| Total | 3.93 | 0.71 |
Table text extracted from the original PDF; superscript letters are shown inline. The original table image is below.
View original table image
| Statement | Mean | SD |
|---|---|---|
| The activities of others will influence the customer | 3.4 | 0.560 |
| Product benefits shown on websites influence purchasing decisions | 3.1 | 0.635 |
| Advertising makes shift in attitude | 3.25 | 0.595 |
| Total | 3.21 | 0.5487 |
Table text extracted from the original PDF; superscript letters are shown inline. The original table image is below.
View original table image
| Statement | Mean | SD |
|---|---|---|
| The brand image motivates me to buy more | 4.1 | 0.84 |
| Specific brand preferences in case of dairy products | 4.05 | 0.82 |
| Promotional videos create brand awareness and product preference | 4.5 | 0.82 |
| Total | 4.21 | 0.82 |
Table text extracted from the original PDF; superscript letters are shown inline. The original table image is below.
View original table image
| Statement | Mean | SD |
|---|---|---|
| Nutritional qualities highlighted are important while making purchase decision | 4.5 | 0.59 |
| Value added products (fermented products) are more preferred | 4.4 | 0.62 |
| Customer is fully satisfied with parameters (Colour, taste, spoilage etc.) of the products being sold | 4.6 | 0.54 |
| Total | 4.5 | 0.583 |
Table text extracted from the original PDF; superscript letters are shown inline. The original table image is below.
View original table image
| S. No | Independent Variable | Dependent Variable | Correlation Coefficient | P Value |
|---|---|---|---|---|
| 1 | Social influence | Customer Attitude | 0.05266 | 0.728 |
| 2 | Perceived ease of use | Customer Attitude | 0.4213 | 0.041 |
| 3 | Product features | Customer Attitude | 0.214 | 0.002 |
| 4 | Brand preference | Customer Attitude | 0.1985 | 0.001 |
| 5 | Customer preferences | Customer Attitude | 0.4165 | 0.002 |
| 6 | Perceived benefits | Customer Attitude | 0.71023 | 0.004 |
Table text extracted from the original PDF; superscript letters are shown inline. The original table image is below.
View original table image
| Statement | Mean | SD |
|---|---|---|
| Online platforms are easy and convenient | 4.02 | 0.77 |
| Various innovative products can be marketed and availed by customers easily | 4.11 | 0.71 |
| The response and feedback will be much better | 4.4 | 0.94 |
| Total | 4.17 | 0.83 |
Table text extracted from the original PDF; superscript letters are shown inline. The original table image is below.
View original table image
| — | Coefficients | Standard Error | P-value |
|---|---|---|---|
| Intercept | 1.983424245 | 0.910285845 | 0.028599751 |
| Product features | 0.432324112 | 0.152289657 | 0.002381637 |
| Social influence | 0.052651916 | 0.079054618 | 0.72182545 |
| Perceived ease of use | 0.212778497 | 0.071037856 | 0.001628348 |
| Perceived benefits | 0.297057653 | 0.053612785 | 0.002367128 |
| Brand preference | 0.220564987 | 0.037721458 | 0.003218629 |
| Customer preferences | 0.416589361 | 0.156348547 | 0.002576943 |
Table text extracted from the original PDF; superscript letters are shown inline. The original table image is below.
View original table image
| Statement | Mean | SD |
|---|---|---|
| The value added products preferred are cost effective | 4.04 | 0.80 |
| The products that require better marketing activities are fermented drinks | 4.12 | 0.79 |
| The packaging preferred is LDPE pouches | 4.04 | 0.88 |
| The products should be diet friendly | 4.1 | 0.85 |
| Total | 4.05 | 0.83 |
Table text extracted from the original PDF; superscript letters are shown inline. The original table image is below.
View original table image
| Factors | 1 | 2 | 3 | 4 | 5 | 6 | Total | Mean | Rank |
|---|---|---|---|---|---|---|---|---|---|
| Social Influence | 24 | 40 | 60 | 72 | 44 | 28 | 268 | 44.66 | 6 |
| Perceived ease of use | 144 | 140 | 108 | 33 | 20 | 0 | 445 | 74.16 | 2 |
| Product features | 222 | 125 | 100 | 39 | 26 | 0 | 512 | 85.31 | 1 |
| Perceived benefits | 126 | 105 | 56 | 60 | 48 | 0 | 395 | 65.83 | 3 |
| Brand preferences | 30 | 40 | 76 | 3 | 26 | 34 | 217 | 36.16 | 5 |
| Customer preferences | 54 | 50 | 0 | 63 | 42 | 38 | 272 | 45.33 | 4 |
Table text extracted from the original PDF; superscript letters are shown inline. The original table image is below.
Social influence
Social influence refers to the way in which individuals change their ideas and actions to meet the demands of a social group, perceived authority, social role or a minority within a group wielding influence over the majority.