
Research article · 2022 · Full text
International Journal of Research in AgronomyHeterotic groupings, perse performance and standard heterosis of quality protein maize (Zea mays L.) for yield and yield contributor traits adapted at mid altitude of Ethiopia
Volume 5(2) · Pages 42–52 · DOI: 10.33545/2618060x.2022.v5.i2a.112 ↗
Research areasCrop Yield and Soil Fertility
Abstract
Author-writtenFor an organized cross breeding program, information on heterotic grouping, perse performance, and commercial heterosis of newly introduced maize lines is required. Therefore, the present study was conducted to determine the heterotic group, commercial heterosis, perse and crosses mean performance of newly introduced from IITA-Nigeria and CIMMYT- Zimbabwe quality protein maize inbred lines. 36F1 progenies generated from the four testers and nine lines, and including four standard checks a total of 40 entries, and thirteen inbred lines were planted by using Alpha lattice design with three replications at Bako National Maize Research Center and Jimma Agricultural Research center in 2019/20 main cropping season. The combined analysis over the two locations showed there were significant differences at (p
Summary
Source-checkedPlain-language reading of the full paper, prepared with AI and checked against the text. Each point links to the authors' own words.
Why it matters
- Maize is a critical staple crop in Sub-Saharan Africa, but conventional varieties often lack essential amino acids like lysine and tryptophan, which can lead to severe malnutrition and growth failures in infants. View evidence ↗
- Quality protein maize (QPM) was developed by CIMMYT to provide a more balanced protein source by increasing levels of lysine and tryptophan. View evidence ↗
- Developing QPM varieties in Ethiopia is challenging due to a narrow genetic base of available germplasm and a complex genetic system. View evidence ↗
The question
- The study aimed to determine the heterotic groups, commercial heterosis, and the mean performance of newly introduced QPM inbred lines from IITA-Nigeria and CIMMYT-Zimbabwe. View evidence ↗
What they did
- Researchers measured grain yield, days to anthesis, silking, and maturity, as well as plant and ear height, ear diameter, ear length, and kernel weight. View evidence ↗
- Heterotic grouping was determined based on the specific combining ability (SCA) values for grain yield across locations when crossed with testers. View evidence ↗
What they found
- Among the inbred lines, L5 achieved the highest yield at 3.6 t/ha, followed by L2 at 3.13 t/ha and L7 at 2.53 t/ha. View evidence ↗
- Eight hybrid crosses (L2xT4, L3xT4, L4xT4, L5xT2, L6xT3, L7xT2, L9xT1, and L9xT4) were identified as promising because they yielded more than the standard checks. View evidence ↗
- The overall mean grain yield across locations was 7.23 t/ha, with the highest yield from cross L5xT2 (8.8 t/ha) and the lowest from L9xT3 (5 t/ha). View evidence ↗
- Inbred lines L1, L5, and L8 were assigned to heterotic group B because they showed significant negative SCA effects when crossed with Tester B. View evidence ↗
- Inbred lines L2 and L9 showed significant positive SCA effects with both Tester A and Tester B, suggesting they belong to a combined heterotic group AB. View evidence ↗
What it means
- The authors recommend that the promising crosses identified should be used as candidates for selection and release, provided their performance is confirmed across multiple sites and an additional season. View evidence ↗
- The authors state that the findings must be confirmed through further multilocation evaluations and re-evaluation of the tryptophan and lysine content of the genotypes. View evidence ↗
- The testers used in this study were unable to clearly differentiate some inbred lines into distinct heterotic groups, indicating a need for additional studies with different testers. View evidence ↗
Visual summary
1 visualsIllustrations explain the paper; they do not show study data.
Heterotic Grouping Logic
AI-generated conceptual illustration (Quality protein maize (Zea mays L.)). It explains the idea and does not show study data.
View source evidence ↗Figures & tables
From the original paper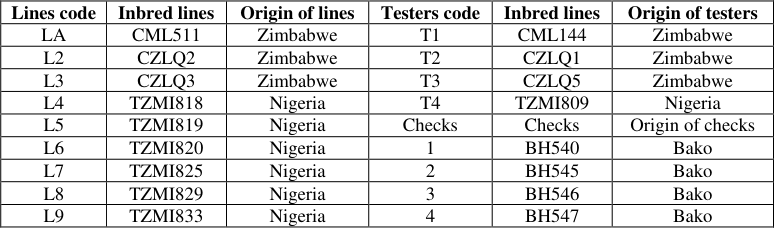 Table 1
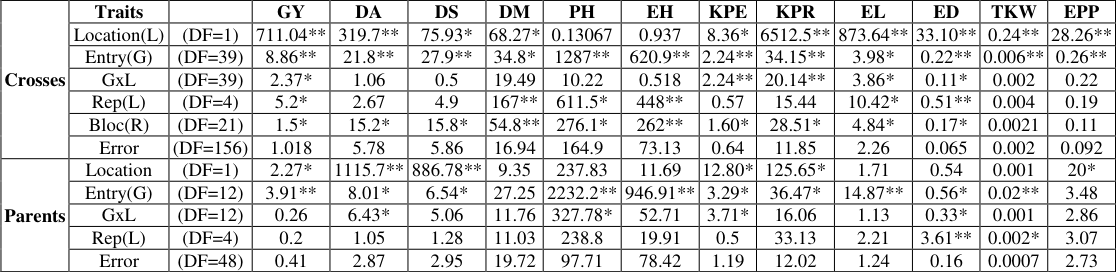 Table 2
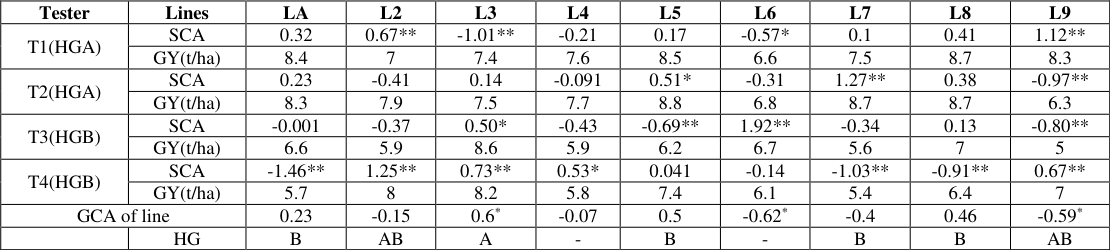 Table 3
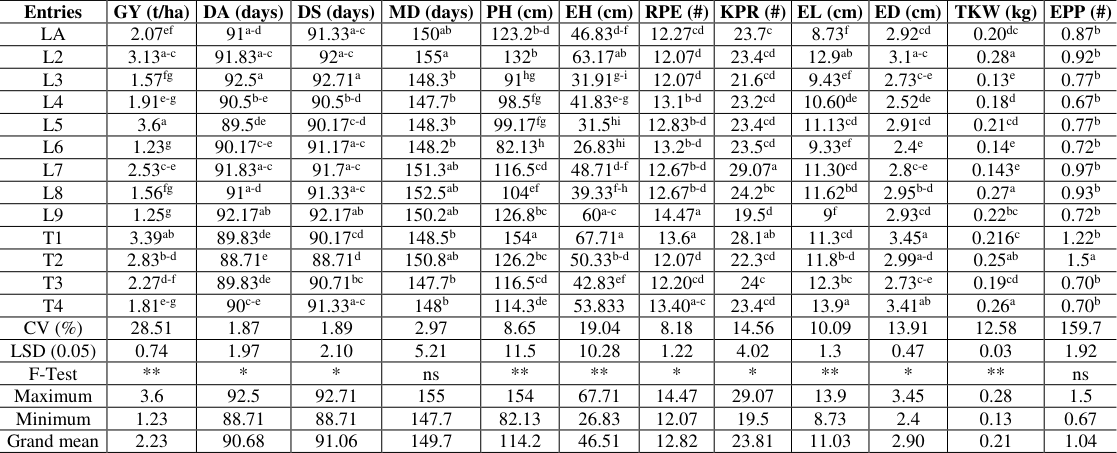 Table 4
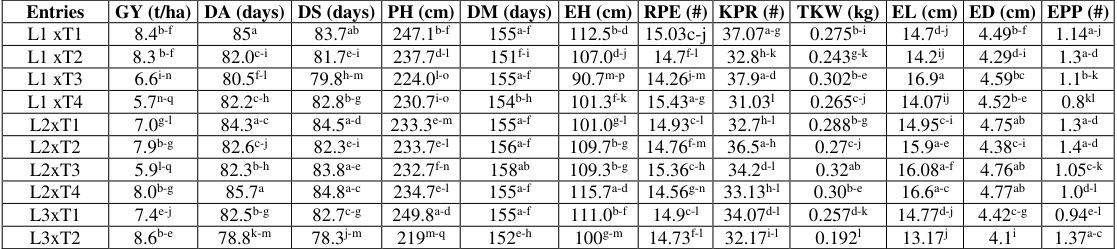 Table 5
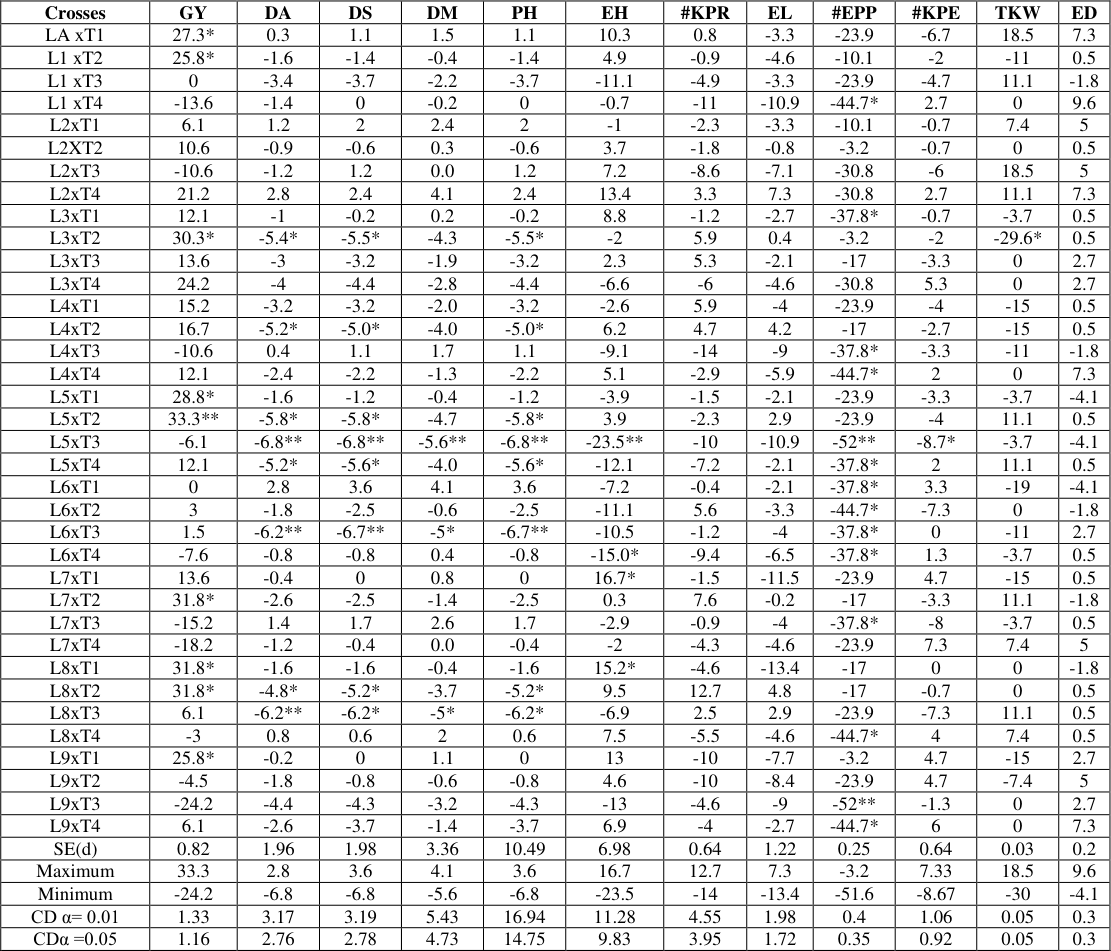 Table 6
Introduction
Maize, one of the key staple crops in SSA, is consumed in a variety of ways, such as baby food, snacks, and main entrees. Since the 1990s, Sub-Saharan Africa's (SSA) increased access to staple foods has significantly decreased the prevalence of undernutrition [6] . In SSA, staple foods tend to be heavy in carbohydrates but poor in other food nutrients including protein, vitamins, and minerals [40] . Malnutrition can occur in populations in high maize-consuming regions due to natural deficiencies or low quantities of some nutrients in maize, limitations of the maize food matrix, the presence of anti-nutrients, physical loss or chemical damage to the nutritional composition during post-harvest handling, and a lack of alignment of maize breeding programs with the preferences of end users, i.e., maize processors and consumers [39] . Preferences for maize and maize-based foods differ across Africa, implying that broad solutions are not feasible for the diverse and dynamic continent [49] . Similarly, maize is an important crop in Ethiopia for production, consumption, and revenue generation for poor men and women. Maize germplasm has a high genetic diversity, with adaptations to a wide range of growing conditions [7] . It is widely grown from sea level to over 3000 meters above sea level, in climates ranging from heavy rainfall to semi-arid, and from cool to very hot [30] . It can be grown in Ethiopia from moisture deficit semi-arid lowlands to moisture surplus mid-altitude and highland areas [32] . Maize can be grown in soils ranging from loamy sand to heavy clay [59] . Historically, maize is grown across Ethiopia, but the western, south-western, southern, and eastern highlands of Hararghe provide the majority of the nation's maize. It expands from locations with low moisture levels to those with high rainfall levels and from lowlands to highlands [37] . Maize is the world's third most produced cereal crop, trailing only wheat and rice [60] . Despite this, maize yield in East Africa has remained stagnant at less than 1.95 tons per acre, compared to the global average of more than 6.53 tons per hectare [19] . This implies that, despite recent progress in productivity, yield levels in Ethiopia remain very low in comparison to what they could be since it is in East Africa. Thus, Ethiopia's national average maize yield is also low when compared to the global average grain yield of 3.63 t ha -1 [19] . Ethiopia is also the second-most populous country in Africa, with a population of over 110 million people. The climate varies greatly due to the country's wide range of altitudes. Food insecurity is a top priority for policymakers in Ethiopia, as it is in other SSA countries. So far, these require critical attention to achieve the demand and supply balance to ensure food security in the face of a rapidly increasing population, particularly given recent history's high urbanization and reduced agricultural labor in rural areas. As a result, maize is one of Ethiopia's five key crops for food security (along with rice, wheat, sorghum, and teff). It is a significant staple crop, ranking first in total grain production (27.43%) and second in area coverage (16.79%) among cereals [13] . Even through its increased consumption as a source of carbohydrates, maize grain, like all other cereals, has a low protein quality, particularly in two essential amino acids, lysine and tryptophan [43] . Inadequate levels of tryptophan and lysine in conventional maize consumption, particularly by infants, may result in initial growth failures such as 'Kwashiorkor,' a weakened immune system, and, ultimately, death [51] . Due to the high cost of animal protein, small-scale farmers in major maize-growing areas have limited access to protein sources such as meat, eggs, and milk for daily consumption [14] . In general, one of the main health concerns nowadays is malnutrition brought on by consuming an imbalanced diet, especially in developing and underdeveloped nations [12] . To address this issue, CIMMYT developed quality protein maize varieties with superior protein quality and desirable agronomic characteristics using conventional breeding techniques [56] . Quality protein maize (QPM) varieties with higher levels of lysine and tryptophan provide a more balanced protein for humans and other monogastric animals [22,16] . The high protein quality in QPM is due to a recessive gene opaque-2, which causes maize grain to have increased protein quality. Through subsequent breeding, scientists at CIMMYT were able to develop QPM varieties with superior yield, vitreous endosperm, disease and insect resistance, and improved storage qualities, which are comparable to those of superior conventional maize varieties after so many challenges [2] . To capitalize on QPM's potential nutritional benefits, research on QPM began in Ethiopia in 1994 [2] , with the introduction and evaluation of open-pollinated varieties and pools introduced from CIMMYT QPM pools [25] . Ethiopia's National Maize Research Program has released QPM maize varieties (BH542, BH545, BH548, Melkassa-1Q, Melkassa 6Q, MH138Q, AMH760Q, and AMH852Q) that are adapted to the country's mid-altitude, low moisture stress, and highland agro-ecologies. However, their market share is generally small due to several characteristics that have limited their adoption by farmers, including: High susceptibility to CLR, for example, BH542, especially when grown in rust hot spot; susceptibility to TLB (AMH760Q); and low seed yield of BH545. Breeding for QPM varieties is a difficult task when compared to conventional maize due to the narrow genetic base of QPM germplasm, complex genetic system, and limited funding were the other argent issue in Ethiopia. Due to these reasons, the released varieties were doesn't achieve the demand of the stakeholders. Therefore, development of new QPM varieties should therefore prioritize addressing the previously identified shortcomings of QPM varieties in order to increase adoption of new varieties by small holder farmers and thus contribute to food and nutritional security for some extent. Ethiopia's national maize program addresses these issues by introducing new finished and early generation inbred lines from CIMMYT and IITA for breeding and hybrid formation. Based on the SCA effects for grain yield and other quantitative traits, heterotic groups are established, and high-yielding maize hybrids from inbred lines could be developed. Standard heterosis is an important predictor of breeding value in hybrid breeding programs. The heterotic grouping and standard heterosis of these newly introduced QPM inbred lines used in this study, on the other hand, have never been studied before. As a result, new inbred lines from IITA and CIMMYT are introduced in this study to evaluate the heterotic group and standard heterosis of the genotypes.
Materials and Methods
Materials and Methods
Descriptions of Experimental Sites
The experiment was conducted at Bako National Maize Research Center and Jimma Agricultural Research Center during 2019 cropping season Bako National Maize Research Center is located in East Wollega zone of the Oromia National Regional State, Western Ethiopia. Bako National Maize Research Center lies between 9 o 06' north latitude and 37 o 09' east longitude in the sub-humid agro-ecology, at an altitude of 1650 meters above sea level. The mean minimum and maximum temperatures of the location are 19.7 °C and 22.7 °C, respectively. The long-term annual rain fall of the site is 1245 mm per year and relative humidity of 63.55%. The soil type at Bako National Maize Research Center is characterized by reddish brown in color and clay and loam in texture with pH of 6.0 and 5.9 for top soil (0-30 cm) and sub-soil (30-60 cm), respectively, [1,23] . Jimma Agricultural Research center is located in Jimma zone, Oromia National Regional State, South Western of Ethiopia, 358 km away from Addis Ababa. The center is located between 7 o 40'37'N and 36 o 49'47'E and at an altitude of 1753 M.A.S.L. The average maximum and minimum temperatures are 11.9 and 26.2 °C, respectively. It receives an average annual rainfall of 1532 mm. The long-term annual rain fall of the site is 1572 mm per year with RH of 67%. The soil type at Jimma Agricultural Research center is characterized by reddish brown/ nitosols with pH of 5.20 [33] .
Experimental Materials
The experiment consisted of 36 F1 hybrids, four standard checks (BH540, BH545, BH546 and BH547) and 13 parental lines. The 36 F1 hybrids were generated by using design-II in 2018/2019 cropping season at Bako National Maize Research Center from 13 parental lines (9 as females and 4 as males) (
Experimental design and field managements
Two trials (a hybrid and inbred trial) were conducted during the main cropping season of 2018/2019. The hybrid trial which is consisted of 36F1 experimental crosses and four standard checks were planted using 5x8 alpha lattices experimental design [38] with three replications. Each entry was planted in one row plot of 5m long with spacing of 0.75 m between rows and 0.25 m between plants respectively to attain a total of 53333 plants/ha. The hybrid and parental trials were planted adjacent to each other in the same field to avoid the shading effect of hybrids on inbred lines when included in the same trial. Planting was conducted on the onset of the main rainy season once adequate soil moisture level was reached in order to ensure good germination and seedling development. A pre-emergence herbicide, ®Prim gram-Gold was applied at the rate of 4 liters per hectare after planting to control weeds and post-emergence herbicides such as 2-4-D was sprayed at the rate of 2 L/ha to control broadleaf weeds. Hand weeding and slashing was used to control weeds throughout the growing time. NPS (Nitrogen, phosphorous, Sulfur) and urea fertilizers were applied at the rate of 150 kg/ha and 200 kg/ha, respectively. NPS was applied only at sowing time, while urea was applied in split, half at planting and the remaining half three weeks after planting.
Data Collected
Data on grain yield and other important agronomic traits were collected on a plot and sampled plants bases. Data collected on a plot basis include days to 50% silking (DS), days to anthesis (DA), days to maturity (DM), number of ears per plant (EPP), grain yield (GY), while data recorded on sampled plants basis were ear height (EH) (cm) and plant height (PH) (cm), number of rows per ear (RPE), number of kernels per row (KPR), ear diameter (ED), ear length (EL), thousand kernels weight (TKW).
Data Analysis Analysis of Variance (ANOVA)
Analyses of variance (ANOVA) was computed for grain yield and other agronomic traits for individual location. Prior to combined data analysis across locations, Bartlett's test for grain yield and related traits were conducted to test homogeneity of error variances [24] . As a result, combined analysis over the two locations was carried out for these traits by using PROC MIXED in SAS [44] . Least significant difference (LSD) was used for mean comparisons for both hybrid and parent genotypes.
Heterotic Grouping Method
The idea of heterotic groups and patterns is central to hybrid breeding theory and practice [41] . Grouping germplasm into divergent heterotic groups is advantageous because it i) results in higher mean heterosis and hybrid performance and (ii) results in lower specific combining ability (SCA) variance and a lower ratio of SCA to general combining ability (GCA) variance [41] .
Heterotic groups and patterns among inbred lines benefit in identifying the best hybrid combinations using information obtained from field crosses, primarily using diallel or top crosses to testers [28,52] , pedigree information, morphological traits, and molecular markers [28,52,50] . The magnitude of the combining ability effect is important in heterotic grouping because it indicates gene action types as a preliminary indicator of heterotic expression [48] . Maximum heterosis can be realized if the breeding program employs inbred lines with a significant positive GCA effect on grain yield and are classified in the opposing heterotic group [8] . When a breeder decides to cross lines from different maize heterotic groups, he or she increases the likelihood of producing superior hybrids. However, because there are infinite genetic combinations between any two inbred lines, no heterotic group classification method can be perfect. Thus, a good heterotic group classification method is one in which the classified heterotic groups allow interheterotic group crosses to produce more superior hybrids than within-group crosses [18] . Heterotic patterns have a significant impact on crop improvement because they predetermine the type of germplasm used in a hybrid breeding program over a long period of time [34] . Heterotic effects of the maize lines and their allocation into well-known heterotic groups are the secret for the success of a maize breeding program, which would give utmost exploitation of heterosis. Knowledge of the genetic architecture of traits is significant for assigning the parental lines into heterotic groups, and predicting future hybrid performance [58] . Thus, assigning maize lines into the different heterotic groups is very vital for hybrid breeding programs in giving information about the germplasms [27] . Heterotic Grouping were done as suggested by [48] , based on the grain yield SCA values computed from them across location cross performance with the testers, the inbred lines were assigned to any one of the heterotic tester groups. An inbred line which possessed significant and negative SCA with any one of heterotic testers were grouped with the tester with which it revealed negative effects. On the other hand, a line with positive SCA effect with the tester A were categorized under opposite heterotic group (tester B); similarly, the lines that showed positive SCA effect with tester B were categorized under opposite heterotic group (tester A).
Heterosis Estimation
Standard heterosis (SH) or economic heterosis in percent was calculated for those characters showed statistically significant differences among genotypes as suggested by [17] . These was computed as percentage increase or decrease of the cross performances over the best standard check as follows. One best standard check BH545 was used to estimate of standard heterosis. This was calculated as percentage increase or decrease of the cross performances over the standard checks. The standard checks selected are well adapted to mid altitude agroecology and popular among the farming community for high yielding potential and quality protein Maize. Due that, among the commercial checks used in the experiment as best check only BH545 was the quality protein maize variety since the others were normal maize. Thereby to estimate standard heterosis we used only this (BH545) variety subsequently the evaluated genotypes were quality protein maize to compare yield advantages and other traits.
Where: F1 ═ Mean value of a cross and SV = Mean value of standard check variety
Where, SE (d) is standard error of the difference, MSe is error mean square and r is number of replications. Significance of heterosis was tested using the t-test against the critical difference (CD). The CD for testing the significance of standard heterosis (SH) was calculated as suggested by [48] as follows:
Where's, SE (d) is standard error of the difference, MSe is the error mean square, r is the number of replication and F1 and SV are mean values of the hybrids and standard variety, respectively.
The computed t values were tested against the t value at the error degrees of freedom for table value at 5% and 1% probability levels.
Result and Discussion
The analysis of variance showed highly significant differences among the hybrid and parent genotypes for most of the traits (Table -2). Also, mean squares due to parents were highly significant and significant for all traits studied, except for Days to maturity (DM) and Ear per plant (EPP) (Table -2). Significant differences were observed among the genotypes for most of the traits studied, indicating the presence of genetic variation among the materials for further improvement of the traits. In other sentence, the genotypes were sufficiently different from each other for these traits, and hence, the selection is possible to identify the most necessary hybrids for further genetic analysis.
In agreement with this finding, significant mean square due to genotypes for grain yield and yield related traits in maize were also reported by previous investigators [31,15,53,10,21,4] .
Grain yield, kernels per ear, and ear diameter all showed significant differences for hybrid genotype by location (G x L) interactions, but for number of kernels per row, highly significant differences (p 0.01) and significant differences due to genotypes were observed, indicating that genotypes performed differently across locations, i.e., the relative performances of the genotypes were influenced by the variable environmental conditions. A half of traits such as days to anthesis, days to silking, days to maturity, plant height, ear height, thousand kernel weight and ears per plant showed non-significant differences for genotype by location (G x L) interactions, implying the similar performance of the genotypes for these specific traits across the test locations. The non-significant of G x L interaction for most yield related traits in a genotype is desirable as it displays the opportunity of developing steady genotypes with respect to these parameters (Table -2). The majority of the parent genotypes' investigated attributes revealed highly significant differences (p<0.01). This showed that the parental lines have reached a level of variation, enabling the breeder to choose the parents with the highest performance among the tested parents for upcoming breeding programs in the targeted areas. GxE interactions for Parent genotypes did not exhibit significance for variables including grain yield, days to silking, days to maturity, kernels per row, ear length, and thousand kernel weight. In all analyzed variables, with the exception of ear position, combined analysis of mean square was significant at p<0.05 and very significant at p<0.01, according to [53] , showing the existence of genetic diversity among crosses. Additionally, he noted that all examined features, some traits showed non-significant variance in mean squares due to crosses location interaction. Crosses x sites for several of the examined traits exhibited significant and extremely significant (p<0.01) or (p<0.05) results, according to the analysis. Grain yield, date to 50% silking, number of ears per plot, maturity date, ear diameter, ear length, and common leaf rust were among the studied traits that showed highly significant differences (p<0.01), while date to 50% anthesis, plant aspect, and thousand seed weight were significant differences (p<0.05). The breeder will be able to choose the genotypes for those particular places because it shows that the researched attributes were affected by location variability and genotypes performed differently across locations for those traits. In general, several researchers at various times and places reported comparable findings for significant genotype of grain yield and other traits such as number of kernels per row, ear diameter, number of rows per ear, and ear length owing to mean square of genotypes revealed significant variations [29,11,15,55,4] .
Heterotic Grouping
To facilitate operation and increase genetic gain, a hybrid breeding program should organize its germplasm into heterotic groups [26,42] . Accordingly, if lines exhibit a negative SCA effect when crossed to a specific tester, this implies that both the line and the tester belong to the same heterotic group, whereas the opposite is true when the SCA effect is positive [56] . Table-3 showed that some inbred lines displayed negative SCA effects when crossed to tester A, while other inbred lines expressed favorable SCA effects. The opposite was true when these lines crossed to tester B. Lines that showed positive SCA when crossed with tester A were categorized with the opposing heterotic group (group B), and vice versa, based on the importance of the SCA effects. When crossed with tester A, the inbred line L3 had a noticeable negative SCA effect on grain yield (Table-3). Additionally, these inbred lines had poor mean grain yields when tested by tester A (T1), suggesting that they might belong to the same heterotic group as tester A. Similarly, when crossed to tester A, L1, L5, L7, and L8 exhibited non-significant negative SCA impacts and for grain yields (T1). When crossed with Tester B(T4), inbred line L1 had highly substantial negative SCA impacts on grain yield, and inbred line L5 had similarly large negative SCA effects (T3). Additionally, when crossed with Tester B, inbred line L8 exhibited significantly significant adverse SCA impacts on grain yield (T4). This suggests that tester B and these inbred lines could be in the same heterotic group (T4). When crossed with Tester A (T1) and Tester B, Inbred lines L2 and L9 had highly significant positive SCA effects for grain yield (T4). The possibility of placing these inbred lines in the same heterotic group into AB is suggested by this. Based on their SCA effects and heterosis for grain production, [16] classified several heterotic groups of mid-altitude quality protein maize inbred lines [55] . Assigned various heterotic groups of mid-altitude maize inbred lines based on the SCA effects and heterosis on grain yield. Additionally, a number of studies used heterosis and SCA effects to calculate the genetic distance between genotypes and partition germplasm into heterotic groups [56,32,23] .
Parents Perse performance and Mean Performance of Crosses
The perse performances of the parents (nine inbred lines and four testers) and mean performance of crosses are given in Tables-4 and 5 respectively. Between the inbred lines, L5 had the highest yield (3.6 t/ha), followed by L2 (3.13 t/ha) and L7 (2.53 t/ha). On the other hand, L6 and L9 had the lowest grain yields of 1.23 and 1.25 t/ha, respectively. The mean grain yield for tester 1 (T1) was 3.39 t/ha and for tester 2 (T2) was 2.83 t/ha. Whereas the lowest yield for testers scored from tester 4(T4) 1.81t/ha and tester 3 (T3) 2.27t/ha. Days to anthesis (DA) ranged from 88.7 to 92.5 with over all mean of 90.68 days, this indicates that almost all of the inbred lines used in this study mature late and can be used to develop higher yielding varieties for areas with a long rainy season. Whereas Days to silking (DS) ranged from 88.71 to 92.71with over all mean of 91.06 days. Plant height ranged from 82.13cm (L6) to 154cm (T1) with mean values of 114.2cm. Shorter inbred lines could be used to create high-yielding varieties that are resistant to lodging. The mean perse performance of the parental lines for number of rows per ear (RPE) the grand mean is 12.82. The highest PRE was recorded for T1 (13.6 rows) and the lowest for the line L2, L3 and T1 (12.07 rows). The mean perse performance of the inbreed lines for number of kernels per row (KPR) is 23.81 29.07. The highest KPR was recorded for L7 (29.07 kernels) and the lowest for the line L9 (19.5 kernels). The highest and lowest EL values were 13.9 and 8.73cm, which were observed in T4 and L1 respectively. The mean ear diameter (ED) ranged from 2.4 (L6) to 3.45 cm (T1) with over all mean of 2.90 cm. These inbred lines and testers with wider ED had high grain yield per hectare, indicating that this trait has a direct contribution to grain yield. Regarding the mean thousand kernel weight (TKW) of the inbreed lines is 0.21 Kg or 210 g. The inbred line L2 had the highest TKW (280 g), while the lowest yielder L3 (130 g) scored the lowest TKW. Across locations, overall mean grain yield of the genotypes was 7.23 t/ha ranging from 5 t/ha to 9.8 t/ha. Cross L5xT2 (8.8 ton/ha), followed by crosses L7xT2 (8.7 ton/ha), L8xT1 (8.7 ton/ha) and L8xT2 (8.7 ton/ha), had higher grain yields while crosses L9 x T3 (5 ton/ha) and L7xT4 (5.4 ton/ha) showed lower grain yield. In combined analysis across locations, the maximum grain yield obtained from standard check BH546 (9.81 ton/ha) whereas the lowest grain yield recorded from L9xT3 (5ton/ha), respectively. In another way, about 63.9% and 19.44% of crosses greater grain yield than the standard checks BH545 and BH540, respectively while about 22.2% crosses lower grain yields when compared to the standard check BH545. These implies about 77.78% of crosses performed good and showing the probability of obtaining good hybrids of quality protein maize for both studied areas. In a simultaneous analysis across locations, L2xT4 (86 days) and L5xT3 (86 days) had the longest duration of days anthesis and days to silking among the crosses, while L5xT3 (78 days) and L5xT3 (77 days) had the shortest duration, with general mean values of 82 and 81 days as its arrangement. In other words, more than 77.78 percent and 69.44 percent of crosses were taken greater than 80 days to anthesis and less than 86 days to silking, respectively. The majority of crosses had a longer period between anthesis and silking. As a result, crosses with a longer number of days to anthesis and silking could be categorized as late maturing types. Across locations, the tallest plant height and ear height were obtained from BH546 (263.63 cm) and BH547 (112.3 cm), respectively, and the shortest from crosses of L6xT4 (104.3 cm) and L5xT3 (78 cm). These revealed that the performance of the histological arrangement was relatively grouped into the same range because there were no more differences between them for both studied locations. Across locations, in ear height to plant height ratio or ear position ranged from 0.38 to 0.5 from lowest to highest, conversely, about 97.22% of crosses ranged between 0.40 to 0.50 whereas only 2.78% of crosses out of the majority domain of 0.40 to 0.5. As the majority of crosses showed ear placement near to the mid part of the plant, indicating desirable character for lodging tolerance [23] . Crosses which have shorter plant and ear height are anticipated for lodging tolerance and to apply indispensable management practices, whereas taller crosses are important to harvest high biomass yield that could be used as animal feed and source of fuel for poor farmers and important as biomass could be used as animal feed [9,23] . Several scholars [40,3] suggested that Plant and ear heights are among essential agronomic parameters in maize selection breeding. Shorter plant height and medium ear placement is desirable for lodging resistance and mechanized agriculture. In combined analysis across locations, the maximum and minimum of number kernels per rows obtained from the crosses of L3xT3 (40.07) and L6xT4 (30.77), whereas the longest and widest ear length and ear diameter and shortest and slightest (narrowest) ear length and ear diameter were recorded from the crosses of L7xT3 (17.53 cm) & BH547 (4.93 cm) and L3xT2 (13.17 cm) and L3xT2 (4.10 cm), respectively. Across locations, the number of plants per ear ranged from 0.68 to 1.46 with grand mean values of 1.05 by means of the maximum number scored from the check BH545 (1.46) and the minimum from L9xT3 (0.68) estimated to one ear from one stand. For general explanations, nearly 61.1% of crosses contributes ≥ 1 ear per plant. Relatively when compared with standard checks, 94.44% of crosses better contributors than the check of BH547 (0.76) estimated to one ear from one stand, similarly about 36.11% of crosses greater than the standard check BH540. Indicating thereby these were prolific crosses as they showed higher number of ears per plant. Across locations, the maximum and the minimum thousand seed grain weight was attained from the check BH540 (355g) and cross L3xT2 (192g), respectively, whereas almost 50% of crosses showed greater than or equal (≥) to the standard check BH545 and also about 27.78% of crosses had greater than the standard check BH546.
8.4 b-f 85 a 83.7 ab 247.1 b-f 155 a-f 112.5 b-d 15.03c-j 37.07 a-g 0.275 b-i 14.7 d-j 4.49 b-f 1.14 a-j L1 xT2 8.3 b-f 82.0 c-i 81.7 e-i 237.7 d-l 151 f-i 107.0 d-j 14.7 f-l 32.8 h-k 0.243 g-k 14.2 ij 4.29 d-i 1.3 a-d L1 xT3
6.6 i-n 80.5 f-l 79.8 h-m 224.0 l-o 155 a-f 90.7 m-p 14.26 j-m 37.9 a-d 0.302 b-e 16.9 a 4.59 bc 1.1 b-k L1 xT4 5.7 n-q 82.2 c-h 82.8 b-g 230.7 i-o 154 b-h 101.3 f-k 15.43 a-g 31.03 l 0.265 c-j 14.07 ij 4.52 b-e 0.8 kl L2xT1 7.0 g-l 84.3 a-c 84.5 a-d 233.3 e-m 155 a-f 101.0 g-l 14.93 c-l 32.7 h-l 0.288 b-g 14.95 c-i 4.75 ab 1.3 a-d L2xT2 7.9 b-g 82.6 c-j 82.3 e-i 233.7 e-l 156 a-f 109.7 b-g 14.76 f-m 36.5 a-h 0.27 c-j 15.9 a-e 4.38 c-i 1.4 a-d L2xT3 5.9 l-q 82.3
Standard Heterosis
The values of standard heterosis estimated for grain yield and other traits across locations presented in Table-6. In the combined analysis, for grain yield, about twelve crosses nine crosses showed positive and significant advantages over the standard check BHQPY545 with range of (33.3% to-24.2%). Most of the crosses showed that negative and non-significant difference over commercial check that implies less promising yield than the check. Positive heterosis is desired as it indicates increased yield over the existing standard check. In crop breeding, those hybrids perform better than the best standard variety could be of commercial importance [45] . Others authors described that inbreeding program, hybrids perform better than checks could be used as a commercial production [11,16] . This result reassures the earlier findings of several academics [9,5,57,44,35,36,16,20,55,30] . The crosses such as, L1 xT3 and L6xT1 showed zero and non-significant over commercial variety heterosis which indicates that the hybrids and the commercial check gave the same or equal amount of yield with the variety. For days to anthesis and days to silking crosses such as, L3xT2, L4xT2, L5xT2, L5xT3, L5xT4, L8xT2 and L8xT3 showed negative and significant differences that implies the crosses would be take short days to anthesis and silking than the commercial varieties or it implies desirable direction for both the days to anthesis and silking than the check. Similarly for plant and ear height some crosses showed that negative and significant heterosis. Standard heterosis with negative direction are desired for traits like days to anthesis, silking and maturity, plant and ear height, as negative standard heterosis for these traits is directly contributed for earliness, a short number of days between anthesis and silking, short plant stature, which is resistant to lodging, and firm husk cover, which prevents the ear from rotting and external damage. Among the yield contributors' traits, both kernels per row and ear length showed positive and negative non-significant difference whereas about fourteen crosses showed that negative and significant for ear per plant while only the cross L3xT2 showed negative and significant for thousand kernel weight. In general, for yield and yield contributors the versus is true by means the positive directions are desirable. Finally, the evidence from this finding could be valuable for investigators who required doing in advance to improve high yielding and other characters of varieties of quality protein maize in order to select the alternative cultivars. The presence of genetic difference for grain yield and its components characters offers an additional route for maize breeders mainly those who are attentive in heterosis breeding. Both direction's significant standard heterosis for these traits results and similar to these findings were described by several researchers, for instance, both negative and positive heterosis for these traits in maize has been reported by [46, 11, 16] .
Summary and Conclusions
Analysis of the variance hybrids performance showed significant genotypic variance for yield contributor traits such as, grain yield, days of anthesis, days of silking, plant height, and ear height, number of kernels per row, ear length, ear diameter, thousand kernel weights, and ear per plant across locations. The study identified a number of high yielding quality protein maize inbred lines, L5, L2 and L7. However, in order to use these inbred lines in genetic improvement projects and/or variety breeding for economic use, its tryptophan content must be reevaluated. Eight promising crosses L2xT4, L3xT4, L4xT4, L5xT2, L6xT3, L7xT2, L9xT1 and L9xT4 which had higher yield as compared to the checks were identified based on their mean performance which can improve the production and productivity of quality protein maize yield were observed. About 63.9% and 19.44% of crosses greater grain yield than the standard checks BH545 and BH540 respectively. While about 22.2% crosses lower grain yields when compared to the standard check BH545 were observed. These imply that these crosses were well performed and preferences for impending quality protein maize breeding prospective alternatives and for recycling in breeding activities than one standard check for both studied areas. Hence, promising crosses were identified in this study should be used in quality protein maize research platforms as possible candidates for selection and release after approving the permanency of their performance in multi sites and one more season in respectable agro ecology's. The study also characterized inbred lines into different heterotic groups based on the crosses' SCA effect. Accordingly, inbred lines were grouped under heterotic group A, B and AB, respectively. However, the testers used in the present study could not clearly differentiate some of the inbred lines into well-known and distinct heterotic groups. Hence, additional studies should explore the possibility of classifying these and other inbred lines into well-known and distinct heterotic groups using the currently used inbred lines and other more different testers. In the across location analysis, for grain yield, about twelve crosses nine crosses showed positive and significant advantages over the standard check BH545 with range of (33.3% to -24.2%). Most of the crosses showed that negative and non-significant difference over commercial check that implies less promising yield than the check. Positive heterosis is desired as it indicates increased yield over the existing standard check. In crop breeding, those crosses perform better than the best standard variety could be of commercial importance. When introducing new maize germplasms into a heterotic group, it is best to use a variety of techniques. But, molecular approaches, in particular, may be more effective in clarifying material categorization. In general, positive standard heterosis is desirable for GY and traits that directly contribute to yield. Negative heterosis, on the other hand, is desirable for traits such as DA, DS, PH and EH. In general, in Ethiopia, where maize is the primary food source for the majority of rural communities, having such like QPM inbred lines is indispensable particularly where cereal crops, specifically maize dominated. Based on mean grain yield and standard heterosis with similar genotypes, the well-performing and promising crosses in this study should be advanced for further multilocation evaluation by the maize breeding program for possible release. To confirm the findings of this study, multilocation evaluation, tryptophan and lysine content of this genotypes must be re-evaluated.
Figures and tables from the paper
| Lines code | Inbred lines | Origin of lines | Testers code | Inbred lines | Origin of testers |
|---|---|---|---|---|---|
| LA | CML511 | Zimbabwe | T1 | CML144 | Zimbabwe |
| L2 | CZLQ2 | Zimbabwe | T2 | CZLQ1 | Zimbabwe |
| L3 | CZLQ3 | Zimbabwe | T3 | CZLQ5 | Zimbabwe |
| L4 | TZMI818 | Nigeria | T4 | TZMI809 | Nigeria |
| L5 | TZMI819 | Nigeria | Checks | Checks | Origin of checks |
| L6 | TZMI820 | Nigeria | 1 | BH540 | Bako |
| L7 | TZMI825 | Nigeria | 2 | BH545 | Bako |
| L8 | TZMI829 | Nigeria | 3 | BH546 | Bako |
| L9 | TZMI833 | Nigeria | 4 | BH547 | Bako |
Table text extracted from the original PDF; superscript letters are shown inline. The original table image is below.
View original table image
| Crosses | Traits | — | GY | DA | DS | DM | PH | EH | KPE | KPR | EL | ED | TKW | EPP |
|---|---|---|---|---|---|---|---|---|---|---|---|---|---|---|
| Location(L) | (DF=1) | 711.04** | 319.7** | 75.93* | 68.27* | 0.13067 | 0.937 | 8.36* | 6512.5** | 873.64** | 33.10** | 0.24** | 28.26** | |
| Entry(G) | (DF=39) | 8.86** | 21.8** | 27.9** | 34.8* | 1287** | 620.9** | 2.24** | 34.15** | 3.98* | 0.22** | 0.006** | 0.26** | |
| GxL | (DF=39) | 2.37* | 1.06 | 0.5 | 19.49 | 10.22 | 0.518 | 2.24** | 20.14** | 3.86* | 0.11* | 0.002 | 0.22 | |
| Rep(L) | (DF=4) | 5.2* | 2.67 | 4.9 | 167** | 611.5* | 448** | 0.57 | 15.44 | 10.42* | 0.51** | 0.004 | 0.19 | |
| Bloc(R) | (DF=21) | 1.5* | 15.2* | 15.8* | 54.8** | 276.1* | 262** | 1.60* | 28.51* | 4.84* | 0.17* | 0.0021 | 0.11 | |
| Error | (DF=156) | 1.018 | 5.78 | 5.86 | 16.94 | 164.9 | 73.13 | 0.64 | 11.85 | 2.26 | 0.065 | 0.002 | 0.092 | |
| Parents | Location | (DF=1) | 2.27* | 1115.7** | 886.78** | 9.35 | 237.83 | 11.69 | 12.80* | 125.65* | 1.71 | 0.54 | 0.001 | 20* |
| Entry(G) | (DF=12) | 3.91** | 8.01* | 6.54* | 27.25 | 2232.2** | 946.91** | 3.29* | 36.47* | 14.87** | 0.56* | 0.02** | 3.48 | |
| GxL | (DF=12) | 0.26 | 6.43* | 5.06 | 11.76 | 327.78* | 52.71 | 3.71* | 16.06 | 1.13 | 0.33* | 0.001 | 2.86 | |
| Rep(L) | (DF=4) | 0.2 | 1.05 | 1.28 | 11.03 | 238.8 | 19.91 | 0.5 | 33.13 | 2.21 | 3.61** | 0.002* | 3.07 | |
| Error | (DF=48) | 0.41 | 2.87 | 2.95 | 19.72 | 97.71 | 78.42 | 1.19 | 12.02 | 1.24 | 0.16 | 0.0007 | 2.73 |
Table text extracted from the original PDF; superscript letters are shown inline. The original table image is below.
View original table image
| Tester | Lines | LA | L2 | L3 | L4 | L5 | L6 | L7 | L8 | L9 |
|---|---|---|---|---|---|---|---|---|---|---|
| T1(HGA) | SCA | 0.32 | 0.67** | -1.01** | -0.21 | 0.17 | -0.57* | 0.1 | 0.41 | 1.12** |
| GY(t/ha) | 8.4 | 7 | 7.4 | 7.6 | 8.5 | 6.6 | 7.5 | 8.7 | 8.3 | |
| T2(HGA) | SCA | 0.23 | -0.41 | 0.14 | -0.091 | 0.51* | -0.31 | 1.27** | 0.38 | -0.97** |
| GY(t/ha) | 8.3 | 7.9 | 7.5 | 7.7 | 8.8 | 6.8 | 8.7 | 8.7 | 6.3 | |
| T3(HGB) | SCA | -0.001 | -0.37 | 0.50* | -0.43 | -0.69** | 1.92** | -0.34 | 0.13 | -0.80** |
| GY(t/ha) | 6.6 | 5.9 | 8.6 | 5.9 | 6.2 | 6.7 | 5.6 | 7 | 5 | |
| T4(HGB) | SCA | -1.46** | 1.25** | 0.73** | 0.53* | 0.041 | -0.14 | -1.03** | -0.91** | 0.67** |
| GY(t/ha) | 5.7 | 8 | 8.2 | 5.8 | 7.4 | 6.1 | 5.4 | 6.4 | 7 | |
| GCA of line | 0.23 | -0.15 | 0.6* | -0.07 | 0.5 | -0.62* | -0.4 | 0.46 | -0.59* | |
| HG | B | AB | A | - | B | - | B | B | AB |
Table text extracted from the original PDF; superscript letters are shown inline. The original table image is below.
View original table image
| Entries | GY (t/ha) | DA (days) | DS (days) | MD (days) | PH (cm) | EH (cm) | RPE (#) | KPR (#) | EL (cm) | ED (cm) | TKW (kg) | EPP (#) |
|---|---|---|---|---|---|---|---|---|---|---|---|---|
| LA | 2.07ef | 91a-d | 91.33a-c | 150ab | 123.2b-d | 46.83d-f | 12.27cd | 23.7c | 8.73f | 2.92cd | 0.20dc | 0.87b |
| L2 | 3.13a-c | 91.83a-c | 92a-c | 155a | 132b | 63.17ab | 12.07d | 23.4cd | 12.9ab | 3.1a-c | 0.28a | 0.92b |
| L3 | 1.57fg | 92.5a | 92.71a | 148.3b | 91hg | 31.91g-i | 12.07d | 21.6cd | 9.43ef | 2.73c-e | 0.13e | 0.77b |
| L4 | 1.91e-g | 90.5b-e | 90.5b-d | 147.7b | 98.5fg | 41.83e-g | 13.1b-d | 23.2cd | 10.60de | 2.52de | 0.18d | 0.67b |
| L5 | 3.6a | 89.5de | 90.17c-d | 148.3b | 99.17fg | 31.5hi | 12.83b-d | 23.4cd | 11.13cd | 2.91cd | 0.21cd | 0.77b |
| L6 | 1.23g | 90.17c-e | 91.17a-c | 148.2b | 82.13h | 26.83hi | 13.2b-d | 23.5cd | 9.33ef | 2.4e | 0.14e | 0.72b |
| L7 | 2.53c-e | 91.83a-c | 91.7a-c | 151.3ab | 116.5cd | 48.71d-f | 12.67b-d | 29.07a | 11.30cd | 2.8c-e | 0.143e | 0.97b |
| L8 | 1.56fg | 91a-d | 91.33a-c | 152.5ab | 104ef | 39.33f-h | 12.67b-d | 24.2bc | 11.62bd | 2.95b-d | 0.27a | 0.93b |
| L9 | 1.25g | 92.17ab | 92.17ab | 150.2ab | 126.8bc | 60a-c | 14.47a | 19.5d | 9f | 2.93cd | 0.22bc | 0.72b |
| T1 | 3.39ab | 89.83de | 90.17cd | 148.5b | 154a | 67.71a | 13.6a | 28.1ab | 11.3cd | 3.45a | 0.216c | 1.22b |
| T2 | 2.83b-d | 88.71e | 88.71d | 150.8ab | 126.2bc | 50.33b-d | 12.07d | 22.3cd | 11.8b-d | 2.99a-d | 0.25ab | 1.5a |
| T3 | 2.27d-f | 89.83de | 90.71bc | 147.7b | 116.5cd | 42.83ef | 12.20cd | 24c | 12.3bc | 2.73c-e | 0.19cd | 0.70b |
| T4 | 1.81e-g | 90c-e | 91.33a-c | 148b | 114.3de | 53.833 | 13.40a-c | 23.4cd | 13.9a | 3.41ab | 0.26a | 0.70b |
| CV (%) | 28.51 | 1.87 | 1.89 | 2.97 | 8.65 | 19.04 | 8.18 | 14.56 | 10.09 | 13.91 | 12.58 | 159.7 |
| LSD (0.05) | 0.74 | 1.97 | 2.10 | 5.21 | 11.5 | 10.28 | 1.22 | 4.02 | 1.3 | 0.47 | 0.03 | 1.92 |
| F-Test | ** | * | * | ns | ** | ** | * | * | ** | * | ** | ns |
| Maximum | 3.6 | 92.5 | 92.71 | 155 | 154 | 67.71 | 14.47 | 29.07 | 13.9 | 3.45 | 0.28 | 1.5 |
| Minimum | 1.23 | 88.71 | 88.71 | 147.7 | 82.13 | 26.83 | 12.07 | 19.5 | 8.73 | 2.4 | 0.13 | 0.67 |
| Grand mean | 2.23 | 90.68 | 91.06 | 149.7 | 114.2 | 46.51 | 12.82 | 23.81 | 11.03 | 2.90 | 0.21 | 1.04 |
Table text extracted from the original PDF; superscript letters are shown inline. The original table image is below.
View original table image
| Entries | GY (t/ha) | DA (days) | DS (days) | PH (cm) | DM (days) | EH (cm) | RPE (#) | KPR (#) | TKW (kg) | EL (cm) | ED (cm) | EPP (#) |
|---|---|---|---|---|---|---|---|---|---|---|---|---|
| L1 xT1 | 8.4b-f | 85a | 83.7ab | 247.1b-f | 155a-f | 112.5b-d | 15.03c-j | 37.07a-g | 0.275b-i | 14.7d-j | 4.49b-f | 1.14a-j |
| L1 xT2 | 8.3 b-f | 82.0c-i | 81.7e-i | 237.7d-l | 151f-i | 107.0d-j | 14.7f-l | 32.8h-k | 0.243g-k | 14.2ij | 4.29d-i | 1.3a-d |
| L1 xT3 | 6.6i-n | 80.5f-l | 79.8h-m | 224.0l-o | 155a-f | 90.7m-p | 14.26j-m | 37.9a-d | 0.302b-e | 16.9a | 4.59bc | 1.1b-k |
| L1 xT4 | 5.7n-q | 82.2c-h | 82.8b-g | 230.7i-o | 154b-h | 101.3f-k | 15.43a-g | 31.03l | 0.265c-j | 14.07ij | 4.52b-e | 0.8kl |
| L2xT1 | 7.0g-l | 84.3a-c | 84.5a-d | 233.3e-m | 155a-f | 101.0g-l | 14.93c-l | 32.7h-l | 0.288b-g | 14.95c-i | 4.75ab | 1.3a-d |
| L2xT2 | 7.9b-g | 82.6c-j | 82.3e-i | 233.7e-l | 156a-f | 109.7b-g | 14.76f-m | 36.5a-h | 0.27c-j | 15.9a-e | 4.38c-i | 1.4a-d |
| L2xT3 | 5.9l-q | 82.3b-h | 83.8a-e | 232.7f-n | 158ab | 109.3b-g | 15.36c-h | 34.2d-l | 0.32ab | 16.08a-f | 4.76ab | 1.05c-k |
| L2xT4 | 8.0b-g | 85.7a | 84.8a-c | 234.7e-l | 155a-f | 115.7a-d | 14.56g-n | 33.13h-l | 0.30b-e | 16.6a-c | 4.77ab | 1.0d-l |
| L3xT1 | 7.4e-j | 82.5b-g | 82.7c-g | 249.8a-d | 155a-f | 111.0b-f | 14.9c-l | 34.07d-l | 0.257d-k | 14.77d-j | 4.42c-g | 0.94e-l |
| L3xT2 | 8.6b-e | 78.8k-m | 78.3j-m | 219m-q | 152e-h | 100g-m | 14.73f-l | 32.17i-l | 0.192l | 13.17j | 4.1i | 1.37a-c |
Table text extracted from the original PDF; superscript letters are shown inline. The original table image is below.
View original table image
| Crosses | GY | DA | DS | DM | PH | EH | #KPR | EL | #EPP | #KPE | TKW | ED |
|---|---|---|---|---|---|---|---|---|---|---|---|---|
| LA xT1 | 27.3* | 0.3 | 1.1 | 1.5 | 1.1 | 10.3 | 0.8 | -3.3 | -23.9 | -6.7 | 18.5 | 7.3 |
| L1 xT2 | 25.8* | -1.6 | -1.4 | -0.4 | -1.4 | 4.9 | -0.9 | -4.6 | -10.1 | -2 | -11 | 0.5 |
| L1 xT3 | 0 | -3.4 | -3.7 | -2.2 | -3.7 | -11.1 | -4.9 | -3.3 | -23.9 | -4.7 | 11.1 | -1.8 |
| L1 xT4 | -13.6 | -1.4 | 0 | -0.2 | 0 | -0.7 | -11 | -10.9 | -44.7* | 2.7 | 0 | 9.6 |
| L2xT1 | 6.1 | 1.2 | 2 | 2.4 | 2 | -1 | -2.3 | -3.3 | -10.1 | -0.7 | 7.4 | 5 |
| L2XT2 | 10.6 | -0.9 | -0.6 | 0.3 | -0.6 | 3.7 | -1.8 | -0.8 | -3.2 | -0.7 | 0 | 0.5 |
| L2xT3 | -10.6 | -1.2 | 1.2 | 0.0 | 1.2 | 7.2 | -8.6 | -7.1 | -30.8 | -6 | 18.5 | 5 |
| L2xT4 | 21.2 | 2.8 | 2.4 | 4.1 | 2.4 | 13.4 | 3.3 | 7.3 | -30.8 | 2.7 | 11.1 | 7.3 |
| L3xT1 | 12.1 | -1 | -0.2 | 0.2 | -0.2 | 8.8 | -1.2 | -2.7 | -37.8* | -0.7 | -3.7 | 0.5 |
| L3xT2 | 30.3* | -5.4* | -5.5* | -4.3 | -5.5* | -2 | 5.9 | 0.4 | -3.2 | -2 | -29.6* | 0.5 |
| L3xT3 | 13.6 | -3 | -3.2 | -1.9 | -3.2 | 2.3 | 5.3 | -2.1 | -17 | -3.3 | 0 | 2.7 |
| L3xT4 | 24.2 | -4 | -4.4 | -2.8 | -4.4 | -6.6 | -6 | -4.6 | -30.8 | 5.3 | 0 | 2.7 |
| L4xT1 | 15.2 | -3.2 | -3.2 | -2.0 | -3.2 | -2.6 | 5.9 | -4 | -23.9 | -4 | -15 | 0.5 |
| L4xT2 | 16.7 | -5.2* | -5.0* | -4.0 | -5.0* | 6.2 | 4.7 | 4.2 | -17 | -2.7 | -15 | 0.5 |
| L4xT3 | -10.6 | 0.4 | 1.1 | 1.7 | 1.1 | -9.1 | -14 | -9 | -37.8* | -3.3 | -11 | -1.8 |
| L4xT4 | 12.1 | -2.4 | -2.2 | -1.3 | -2.2 | 5.1 | -2.9 | -5.9 | -44.7* | 2 | 0 | 7.3 |
| L5xT1 | 28.8* | -1.6 | -1.2 | -0.4 | -1.2 | -3.9 | -1.5 | -2.1 | -23.9 | -3.3 | -3.7 | -4.1 |
| L5xT2 | 33.3** | -5.8* | -5.8* | -4.7 | -5.8* | 3.9 | -2.3 | 2.9 | -23.9 | -4 | 11.1 | 0.5 |
| L5xT3 | -6.1 | -6.8** | -6.8** | -5.6** | -6.8** | -23.5** | -10 | -10.9 | -52** | -8.7* | -3.7 | -4.1 |
| L5xT4 | 12.1 | -5.2* | -5.6* | -4.0 | -5.6* | -12.1 | -7.2 | -2.1 | -37.8* | 2 | 11.1 | 0.5 |
| L6xT1 | 0 | 2.8 | 3.6 | 4.1 | 3.6 | -7.2 | -0.4 | -2.1 | -37.8* | 3.3 | -19 | -4.1 |
| L6xT2 | 3 | -1.8 | -2.5 | -0.6 | -2.5 | -11.1 | 5.6 | -3.3 | -44.7* | -7.3 | 0 | -1.8 |
| L6xT3 | 1.5 | -6.2** | -6.7** | -5* | -6.7** | -10.5 | -1.2 | -4 | -37.8* | 0 | -11 | 2.7 |
| L6xT4 | -7.6 | -0.8 | -0.8 | 0.4 | -0.8 | -15.0* | -9.4 | -6.5 | -37.8* | 1.3 | -3.7 | 0.5 |
| L7xT1 | 13.6 | -0.4 | 0 | 0.8 | 0 | 16.7* | -1.5 | -11.5 | -23.9 | 4.7 | -15 | 0.5 |
| L7xT2 | 31.8* | -2.6 | -2.5 | -1.4 | -2.5 | 0.3 | 7.6 | -0.2 | -17 | -3.3 | 11.1 | -1.8 |
| L7xT3 | -15.2 | 1.4 | 1.7 | 2.6 | 1.7 | -2.9 | -0.9 | -4 | -37.8* | -8 | -3.7 | 0.5 |
| L7xT4 | -18.2 | -1.2 | -0.4 | 0.0 | -0.4 | -2 | -4.3 | -4.6 | -23.9 | 7.3 | 7.4 | 5 |
| L8xT1 | 31.8* | -1.6 | -1.6 | -0.4 | -1.6 | 15.2* | -4.6 | -13.4 | -17 | 0 | 0 | -1.8 |
| L8xT2 | 31.8* | -4.8* | -5.2* | -3.7 | -5.2* | 9.5 | 12.7 | 4.8 | -17 | -0.7 | 0 | 0.5 |
| L8xT3 | 6.1 | -6.2** | -6.2* | -5* | -6.2* | -6.9 | 2.5 | 2.9 | -23.9 | -7.3 | 11.1 | 0.5 |
| L8xT4 | -3 | 0.8 | 0.6 | 2 | 0.6 | 7.5 | -5.5 | -4.6 | -44.7* | 4 | 7.4 | 0.5 |
| L9xT1 | 25.8* | -0.2 | 0 | 1.1 | 0 | 13 | -10 | -7.7 | -3.2 | 4.7 | -15 | 2.7 |
| L9xT2 | -4.5 | -1.8 | -0.8 | -0.6 | -0.8 | 4.6 | -10 | -8.4 | -23.9 | 4.7 | -7.4 | 5 |
| L9xT3 | -24.2 | -4.4 | -4.3 | -3.2 | -4.3 | -13 | -4.6 | -9 | -52** | -1.3 | 0 | 2.7 |
| L9xT4 | 6.1 | -2.6 | -3.7 | -1.4 | -3.7 | 6.9 | -4 | -2.7 | -44.7* | 6 | 0 | 7.3 |
| SE(d) | 0.82 | 1.96 | 1.98 | 3.36 | 10.49 | 6.98 | 0.64 | 1.22 | 0.25 | 0.64 | 0.03 | 0.2 |
| Maximum | 33.3 | 2.8 | 3.6 | 4.1 | 3.6 | 16.7 | 12.7 | 7.3 | -3.2 | 7.33 | 18.5 | 9.6 |
| Minimum | -24.2 | -6.8 | -6.8 | -5.6 | -6.8 | -23.5 | -14 | -13.4 | -51.6 | -8.67 | -30 | -4.1 |
| CD α= 0.01 | 1.33 | 3.17 | 3.19 | 5.43 | 16.94 | 11.28 | 4.55 | 1.98 | 0.4 | 1.06 | 0.05 | 0.3 |
| CDα =0.05 | 1.16 | 2.76 | 2.78 | 4.73 | 14.75 | 9.83 | 3.95 | 1.72 | 0.35 | 0.92 | 0.05 | 0.3 |
Table text extracted from the original PDF; superscript letters are shown inline. The original table image is below.
View original table image
References
43 in the original paper- Abebe G, Assefa T, Harrun H, Mesfine T, Abdel Rahman M, Tawaha AI. Participatory Selection of Drought Tolerant Maize Varieties using Mother and Baby Methodology: A case study in the semi-arid zones of the central rift valley of Ethiopia. World Journal of Agricultural Science. 2005;1(1):22-27.
- Ali A, Urrahman H, Shah L, Shah KA, Rehman S. Heterosis for grain yield and its attributing components in maize variety azam using line x tester analysis method. Academia Journal of Agricultural Research. 2014;2(11):225-230.
- Amare Seyoum, Dagne Wegary, Sentayehu Alamerew. Combining ability of elite highland maize (Zea mays L.) inbred lines at Jimma Dedo, South West Ethiopia. Advances in Crop Science and Technology. 2016;4(2):1-9.
- Amiruzzaman M, Islam M, Hassan L, Rohman M. Combining ability and heterosis for yield and component characters in maize. Academic Journal of Plant Sciences. 2010;3(2):79-84.
- Andersson MS, Saltzman A, Virk PS, Pfeiffer WH. Progress update: crop development of biofortified staple food crops under Harvestplus. African Journal of Food, Agriculture, Nutrition and Development. 2017;1190511935. DOI: 10.18697/ajfand. HarvestPlus05.
- Anley W, Zeleke H, Dessalegn Y. Genotype x environment interaction of maize (Zea mays L.) across north western Ethiopia. Journal of Plant Breeding and Crop Science. 2013;5(9):171-181.
- Annor B, Badu-Apraku B, Nyadanu D, Akromah R, Fakorede MAB. Identifying heterotic groups and testers for hybrid development in early maturing yellow maize (Zea mays) for sub Saharan Africa. Plant Breeding. 2020;139(4):708-716.
- Bitew T, Mideksa D, Temesgen D, Belay G, Girma D, Dejene K, et al. Combining ability analyses of quality protein maize (QPM) inbred lines for grain yield, agronomic traits and reaction to grey leaf spot in midaltitude areas of Ethiopia. African Journal of Agricultural Research. 2017;12(20):1727-1737.
- CSA. Agricultural Sample Survey 2017/2018: Report on area and production of major crops (private peasant holdings, 'Meher' season). Statistical Bulletin. CSA, Addis Ababa, Ethiopia; c2018.
- Dereje B, Mosisa W, Hadji T, Wonde A, Twumasi-Afiriyie S, Mandefro N, et al. On-farm evaluation of cimmyt's quality protein maize varieties in Ethiopia. Seventh eastern and southern African Regional maize conference, Februarys 11 -15 th , 2001. Jimma Agricultural Research center, Jimma, Ethiopia; c2001. p. 77-79.
- Dufera T, Bulti T, Girum A. Heterosis and combining ability analyses of quality protein maize (Zea mays L.) inbred lines adapted to mid-altitude subhumid agro-ecology of Ethiopia. African Journal of Plant Science. 2018;12(3):47-57.
- Fan XM, Zhang YM, Yao WH, Chen HM, Tan J, Xu CX, et al. Classifying Maize Inbred Lines into Heterotic Groups using a Factorial Mating Design. Agronomy Journal. 2009;101(1):106-112.
- FAOSTAT. Crop prospects and food situation. Rome: Food and Agriculture Organization of the United Nation; c2018. Accessed July 06, 2018. Available from: http://faostat.fao.org.
- Gemechu G, Azmech G, Abu NE. Combining ability of maize inbred lines (Zea mays L.) for yields in mid altitude sub-humid Agroecology of Ethiopia. African Journal of Plant Science. 2020;14(6):231-242.
- Girma A, Samson T, Gunaratna NS, Groote HD. The effectiveness of quality protein maize in improving the nutritional status of young children in the Ethiopian highlands. Food and Nutrition Bulletin. 2010;31(3):418430.
- Girma Hosana C, Sentayehu Alamerew, Berhanu Tadesse, Temesgen Menamo. Test Cross Performance and Combining Ability of Maize (Zea mays L.) Inbred Lines at Bako, Western Ethiopia, Global Journal of Science Frontier Research: Agriculture and Veterinary. 2015;15(4):1-24.
- Gudeta N, Dagne W, Wassu M, Habtamu Z. Mean Performance and Heterosis in Single Crosses of Selected Quality Protein Maize (QPM) Inbred Lines. Journal of Science and Sustainable Development. 2017;5(2):19-31.
- Han GC, Vasal SK, Beck DL, Elis E. Combining ability of inbred lines derived from CIMMYT maize (Zea mays L.) germplasm. Maydica. 1991;36(1):57-64.
- Hossein MH, Maqsadollah E, Rajab C. Diallel analyses of some agronomic traits in maize (Zea mays L.). International Journal of Plant, Animal and Environmental Sciences. 2014;4(1):257-265.
- Kumar P, Prashanth Y, Narsimha V, Kumar RS, Venkateshwara PR. Character Association and path coefficient analysis in maize (Zea mays L.). International Journal of Applied Biology and Pharmaceutical Technology. 2014;5(1):257-260.
- Kumar Narendra, Joshi VN, Dagla MC. Estimation of components of genetic variance in maize (Zea mays L.). The Bioscan. 2013;8(2):503-507.
- Legesse W, Mosisa W, Berhanu T, Girum A, Wande A, Solomon A, et al. Genetic improvement of maize for midaltitude and lowland sub-humid agro-ecologies of Ethiopia. In: Worku M, Twumasi-Afriyie S, Wolde L, Tadesse B, Demisie G, Bogale G, et al. (Editiobs.), 18-20 April 2012. Proceedings of the Third National Maize Workshop of Ethiopia. Addis Ababa, Ethiopia. c2012. p. 24-34.
- Lemi B, Sentayew A, Ashenafi A, Gerba D. Genotype x environment interaction and yield stability of Arabica coffee (Coffee Arabica L.) genotypes. 2018;13(4):210-219.
- Melkamu E. Estimation of combining ability and heterosis of quality protein maize inbred lines. African Journal of Agricultural Research. 2013;8(48):6309-6317.
- Worku M, Zelleke H. Advances in improving harvest index and grain yield of maize in Ethiopia. East African Journal of Sciences. 2007;1(2):112-119.
- Patterson H, Williams E. A new class of resolvable incomplete block designs. Biometrika. 1976;63(1):83-92.
- Ranum P, Pena-Rosas JP, Garcia-Casal MN. Global maize production, utilization, and consumption. Annals of the New York Academy of Sciences. 2014;1312(1):105-112.
- Rawi. Relative performance and combining ability for yield and yield components in maize by using full diallel cross. International Journal of Current Research. 2016;8(9):3772137728.
- Reif JC, Gumpert FM, Fischer S, Melchinger AE. Impact of interpopulation divergence on additive and dominance variance in hybrid populations. Genetics. 2007;176(3):1931-1934.
- Reif JC, Hallauer AR, Melchinger AE. Heterosis and heterotic patterns in maize. Maydica. 2005;50(3):215-223.
- Sarika K, Hossain F, Muthusamy V, Zunjare RU, Baveja A, Goswami R, et al. Marker-assisted pyramiding of opaque2 and novel opaque 16 genes for further enrichment of lysine and tryptophan in sub-tropical maize. Plant Science. 2018;272:142-152.
- Shushay W. Standard Heterosis of Maize (Zea mays L.) Inbred Lines for Grain Yield and Yield Related Traits in Central Rift Valley of Ethiopia. Journal of Biology, Agriculture and Healthcare. 2014;4(23):31-37
- Singode A, Manivannan A, Ahmad B, Srivastava E, Mahajan V. Heterotic grouping in early maturing Indian maize lines. International Journal of Agriculture Innovations and Research. 2017;6(1):57-62.
- Smith JSJ, Smith OS. Fingerprinting crop varieties, Advances in Agronomy. 1992;47:85-129.
- Sultana R, Jamil S, Aslam M, Shahzad R, Fatima R, Maqbool MA, et al. Overview of quality protein maize and molecular breeding approaches for its development. International Journal of Biosciences. 2019;14(1):533-542.
- Terron A, Preciado E, Cordova H, Mickelson H, Lopez R. Determinacion del patron heterotico de 30 lineas de maiz derivadas dela poblacion 43SR del CIMMYT, Agronomía Mesoamericana. 1997;8:26-34.
- Tilahun B, Girum A, Tolera K, Temesgen Ch, Belay G, Beyene A, et al. Test cross performance and combining ability of newly introduced quality protein maize (Zea mays L.) inbred lines for grain yield and agronomic traits evaluated in mid-altitude agro-ecological zones of Ethiopia, South African Journal of Plant and Soil. c2018;36(3):173180. DOI: 10.1080/02571862.2018.1537009.
- Tolera K, Mosisa W, Habtamu Z. Combining ability and heterotic orientation of mid altitude sub-humid tropical maize inbred lines for grain yield and related traits. African Journal of Plant Science. 2017;11(6):229-239.
- Vasal SK, Srinivasan G, Crossa J, Beck DL. Heterosis and combining ability of CIMMYT's sub-tropical and temperate early maturing maize germplasm. Crop Science. 1992;32(4):884-890.
- Wali MC, Kachapur RM, Chandrashekhar CP, Kulkarni VR, Devara NSB. Gene action and combining ability studies in single cross hybrids of maize (Zea mays L.). Karnataka Journal of Agricultural Sciences. 2010;23(4):557-562.
- Xia XC, Reif JC, Hoisington DA, Melchinger AE, Frisch M, Warburton ML. Genetic diversity among CIMMYT maize inbred lines investigated with SSR markers: I. Lowland tropical maize. Crop Science. 2004;44(6):22302237.
- Jodage K, Kuchanur PH, Zaidi PH, Patil A, Seetharam K, Vinayan MT, et al. Genetic analysis of heat stress tolerance and association of traits in tropical maize (Zea mays L.). Environment & Ecology. 2017;35(3C):2354-2360.
- Zamir MSI, Yasin G, Javeed HMR, Ahmad AUH, Tanveer A, Yaseen M. Effect of different sowing techniques and mulches on the growth and yield behavior of spring planted maize (Zea mays L.). Cercetari Agronomic in Moldova. 2013;46(1):77-82.
Cited by 4
From OpenAlex, OpenCitations and reference lists read by Scinovex
- Assessment of genetic diversity and heterotic alignment of CIMMYT and IITA maize inbred lines adapted to sub‐Saharan Africa ↗
Tinovonga Gonhi, Thomas Lapaka Odong, Isaac Onziga Dramadri, Mildred Ochwo‐Ssemakula, Z. A. Chiteka, Emmanuel Amponsah Adjei et al. · Crop Science · 2024
Abstract Despite the breeding efforts by many institutions, maize ( Zea mays L.) productivity in sub‐Saharan Africa is still low. A limited number of productive maize hybrids have been developed partly due to a lack of knowledge on the diversity and heterotic relationship of the germplasm, especially in public breeding programs. Understanding the extent of diversity, structure, and heterotic grouping…
❝ 7PDF - Heterotic Groupings, Perse Performance and Standard Heterosis of Quality Protein Maize (Zea Mays L.) for Yield and Yield Contributor Traits Adapted at Mid Altitude of Ethiopia ↗
Lemi Yadesa, Debela Diro · EAS Journal of Biotechnology and Genetics · 2022
For an organized cross breeding program, information on heterotic grouping, perse performance, and commercial heterosis of newly introduced maize lines is required. Therefore, the present study was conducted to determine the heterotic group, commercial heterosis, perse and crosses mean performance of newly introduced from IITA-Nigeria and CIMMYT- Zimbabwe quality protein maize inbred lines. 36F1 progenies generated from the four testers…
❝ 2PDF - Per se Performance, Heterosis and Heterotic Groupings of Maize Inbred Lines for Yield and Tolerance to Low Soil Nitrogen ↗
Olawale Serifdeen Aboderin, M. Oyekunle, Folusho Anuoluwapo Bankole, Gbadebo Olaoye · Research Square · 2023
Abstract Information onper seperformance, heterosis and heterotic grouping of newly developed maize lines is required for successful hybrids development. The study was conducted to assess theper seperformance of inbreds, examine the inbred-hybrid relationship and classify the lines into heterotic groups. Seventy-nine inbreds developed at Institute for Agricultural Research Zaria were crossed to three testers to generate 237 hybrids. The parental…
❝ 1PDF - Estimating Magnitude of Standard Heterosis in Mid-altitude Maize (Zea mays L.) Hybrids for Grain Yield and Yield Related Traits at Haro Sabu, West Oromia, Ethiopia
Dereje Abera · International Journal of Research in Agronomy · 2023
Heterosis is the groundwork for developing a good economically viable hybrid maize variety. Evaluation of Maize test crosses was carried out during the 2019 main cropping season at research field of Haro Sabu Agricultural Research Center West Oromia, Ethiopia. The main objective of the study was to identify direction and magnitude of standard heterosis in mid-land maize hybrids for grain yield and yield attributing agronomic traits. Seventy-two maize hybrids and three standard checks were tested using 5x15 alpha-lattice (0, 1) design with two replications. The analysis of variance exhibited a