
Research article · 2023 · Full text
International Journal of Research in AgronomyEstimating Magnitude of Standard Heterosis in Mid-altitude Maize (Zea mays L.) Hybrids for Grain Yield and Yield Related Traits at Haro Sabu, West Oromia, Ethiopia
Volume 6(1) · Pages 31–38 · DOI: 10.33545/2618060x.2023.v6.i1a.165 ↗
Research areasGenetics and Plant BreedingCrop Yield and Soil Fertility
Abstract
Author-writtenHeterosis is the groundwork for developing a good economically viable hybrid maize variety. Evaluation of Maize test crosses was carried out during the 2019 main cropping season at research field of Haro Sabu Agricultural Research Center West Oromia, Ethiopia. The main objective of the study was to identify direction and magnitude of standard heterosis in mid-land maize hybrids for grain yield and yield attributing agronomic traits. Seventy-two maize hybrids and three standard checks were tested using 5x15 alpha-lattice (0, 1) design with two replications. The analysis of variance exhibited a highly significant (p
Summary
Source-checkedPlain-language reading of the full paper, prepared with AI and checked against the text. Each point links to the authors' own words.
Why it matters
- Maize is a critical crop for Ethiopia, which is the leading producer in East Africa and the fourth largest in Africa. View evidence ↗
- Hybrid maize varieties are essential for increasing productivity because they generally have higher yield potential than synthetic or composite varieties. View evidence ↗
- Measuring the magnitude of heterosis helps breeders understand the genetic diversity of parents to better exploit hybrid vigor for variety improvement. View evidence ↗
The question
- The study aimed to determine the direction and magnitude of standard heterosis for grain yield and related agronomic traits in mid-altitude maize hybrids. View evidence ↗
What they did
- The experiment was conducted during the 2019 main cropping season at the Haro Sabu Agricultural Research Center in West Oromia, Ethiopia. View evidence ↗
- The hybrids were created by crossing 18 inbred lines with 4 single cross testers using a line x tester mating design. View evidence ↗
- The study measured grain yield, various ear and plant dimensions, phenological timing (anthesis, silking, maturity), harvest index, and reactions to gray leaf spot and tarcicum leaf blight. View evidence ↗
What they found
- Genotypes showed significant variation (P<0.01) for almost all traits, except for shelling percentage, stand count at harvest, and common leaf rust. View evidence ↗
- Mean grain yield ranged from 6.46 ton ha-1 (L17xT4) to 12.39 ton ha-1 (L3xT1), with an average of 8.22 ton ha-1. View evidence ↗
- For the number of ears per plant, 23 crosses showed significant positive standard heterosis over BH547, ranging from -31.82% (L2xT3) to 32.20% (L6xT4). View evidence ↗
- Most crosses exhibited significant negative standard heterosis for plant height compared to BH547, with values between -16.13% (L17xT3) and -7.72% (L13xT1). View evidence ↗
- Many cross combinations showed significant negative standard heterosis for maturity traits, indicating earlier maturity which is beneficial for multiple cropping systems. View evidence ↗
What it means
- The authors identified several specific cross combinations (including L3xL1, L5xT2, and L18xT1) that consistently showed desirable positive heterotic responses for grain yield. View evidence ↗
- The identified promising crosses should be further evaluated for stability across different years and locations before being developed into commercial varieties. View evidence ↗
- The results are based on a single season and location, requiring further confirmation of stability across multiple years and sites. View evidence ↗
Visual summary
3 visualsIllustrations explain the paper; charts are replotted from the paper's own table values.
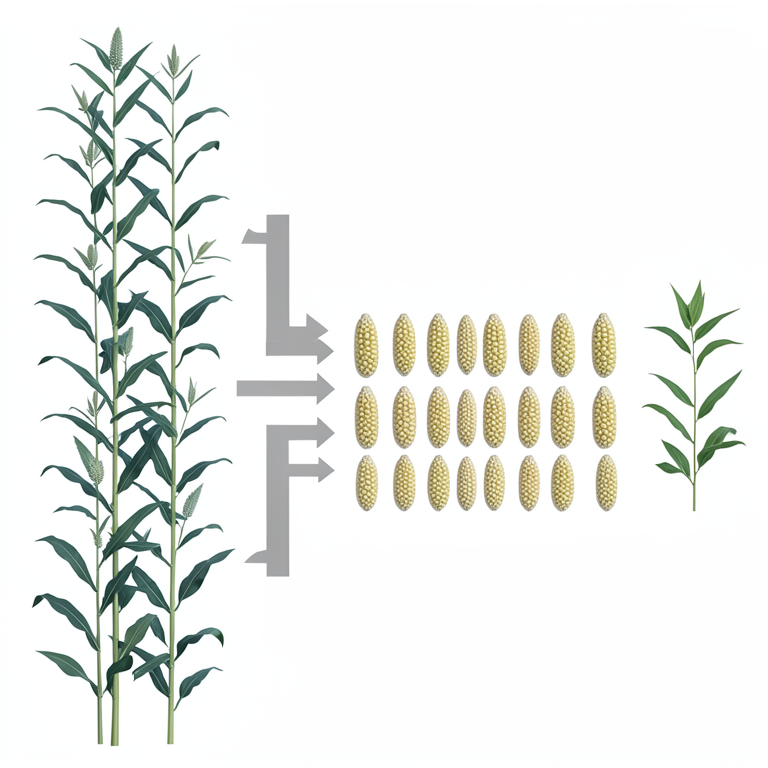
Line x Tester Mating Design
AI-generated conceptual illustration (Maize (Zea mays L.) plants). It explains the idea and does not show study data.
View source evidence ↗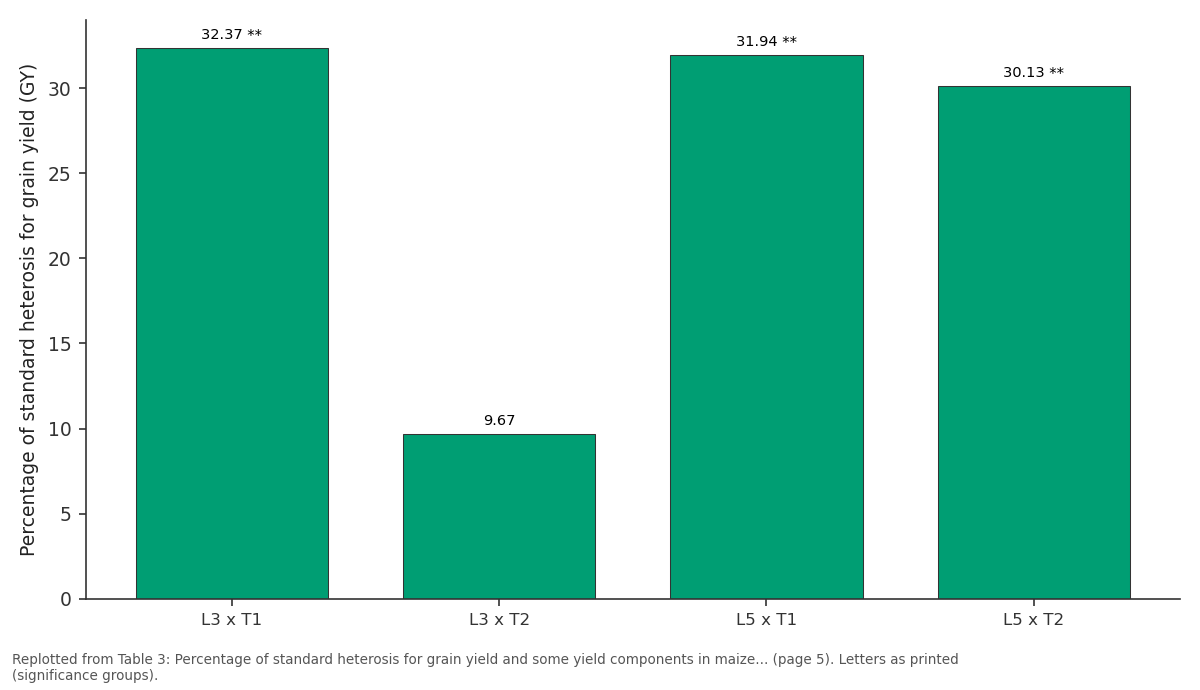
GY: L3 x T1 vs L3 x T2 vs L5 x T1 vs L5 x T2
Replotted from Table 3 (page 5) of the original paper. Every bar is the paper's own table value.
View source evidence ↗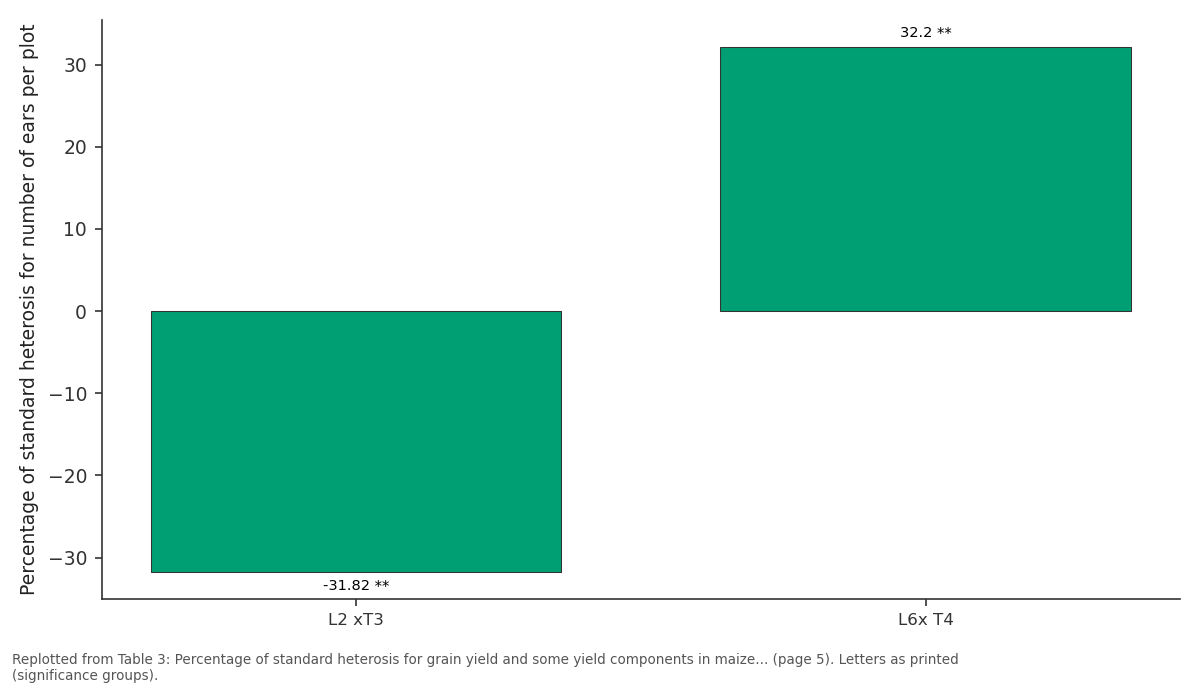
EPP: L2 xT3 vs L6x T4
Replotted from Table 3 (page 5) of the original paper. Every bar is the paper's own table value.
View source evidence ↗Figures & tables
From the original paper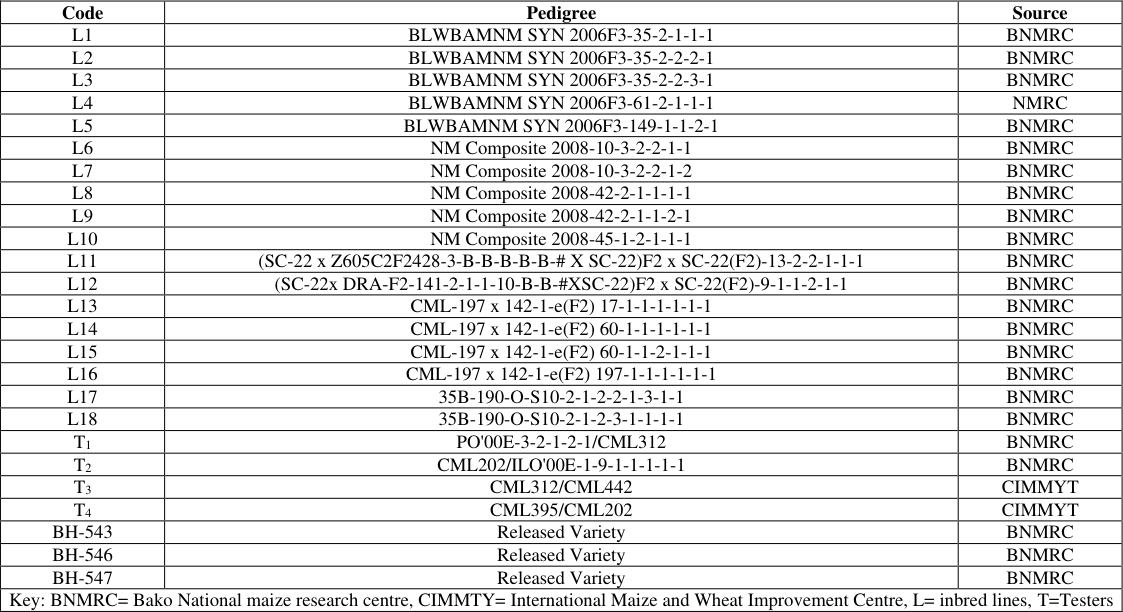 Table 1
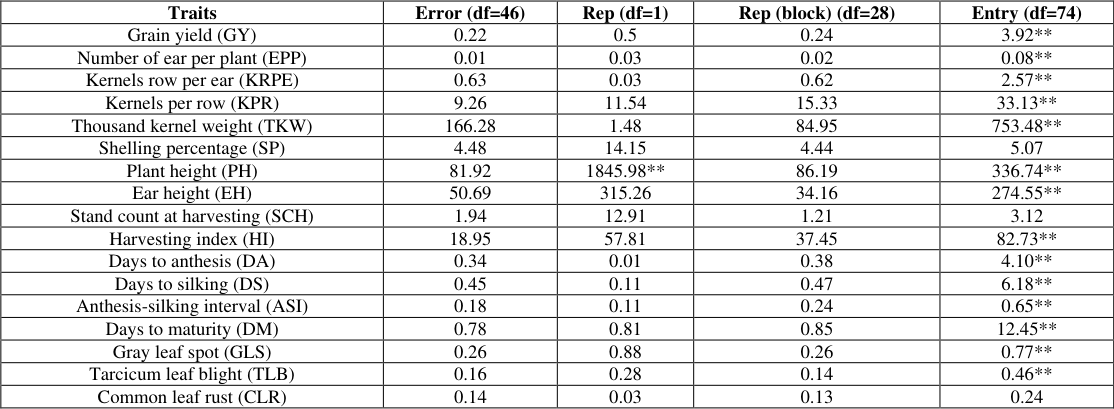 Table 2
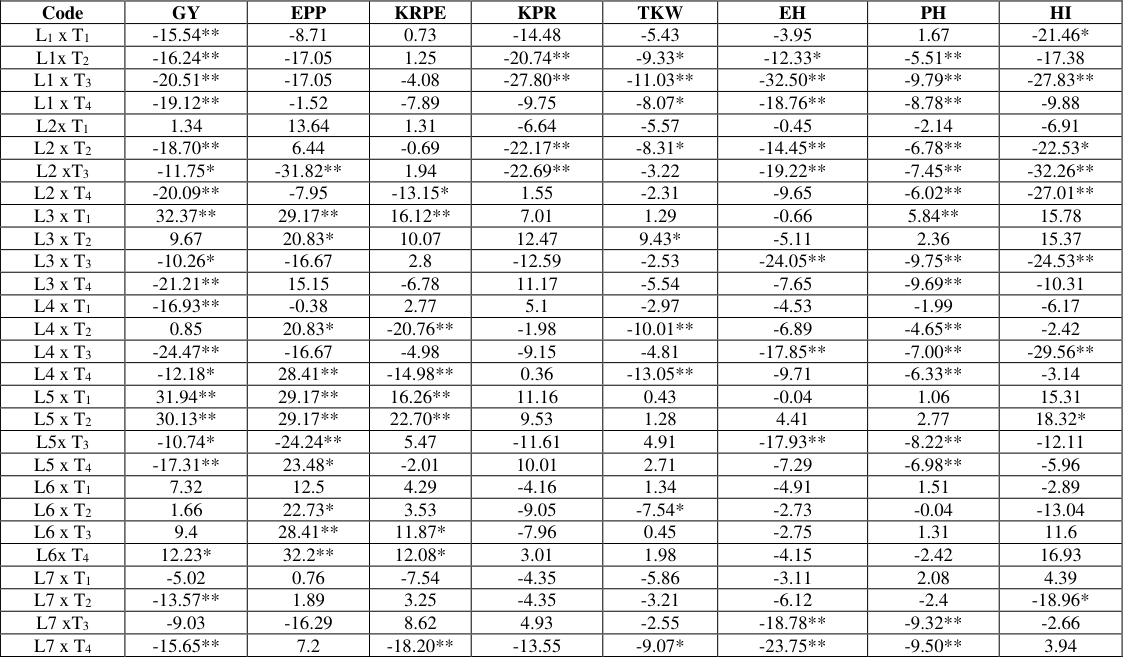 Table 3
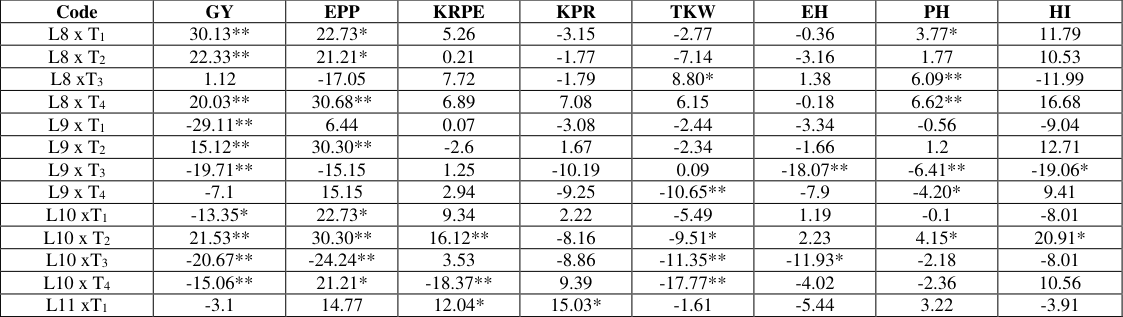 Table 3
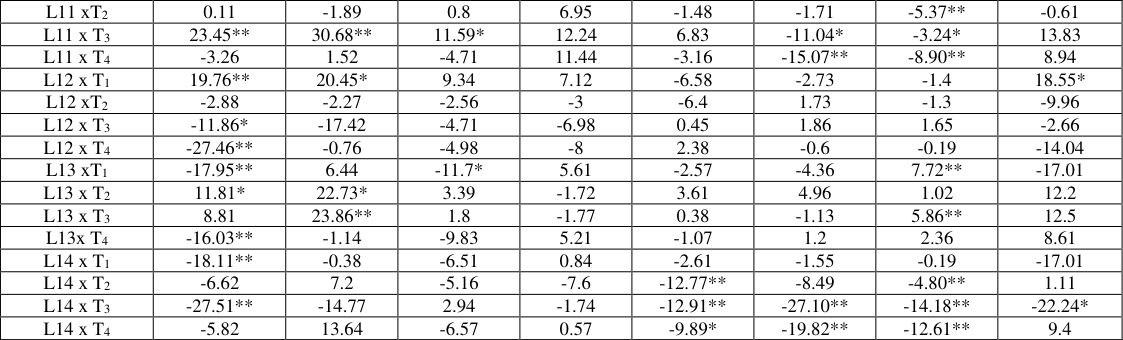 Table 3
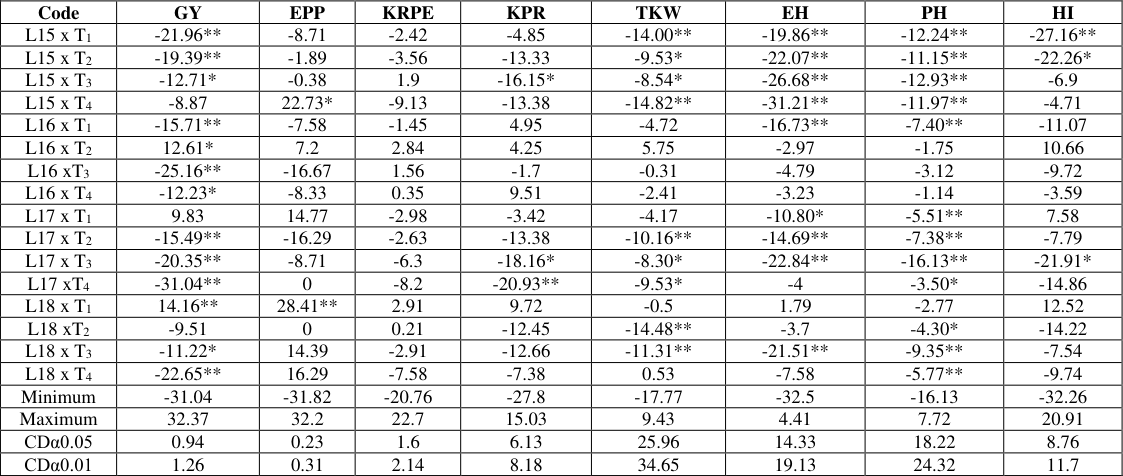 Table 3
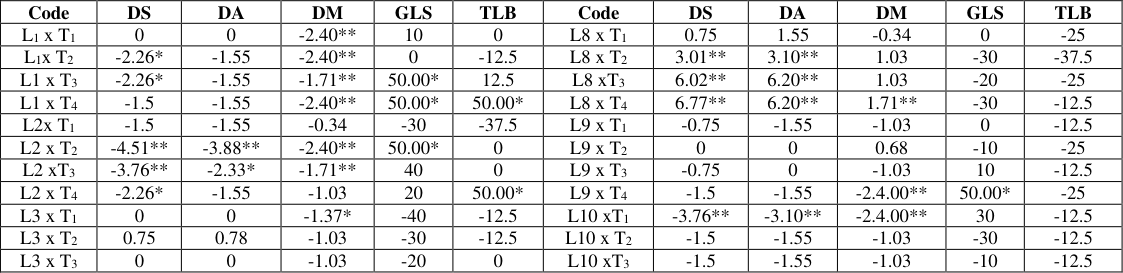 Table 4
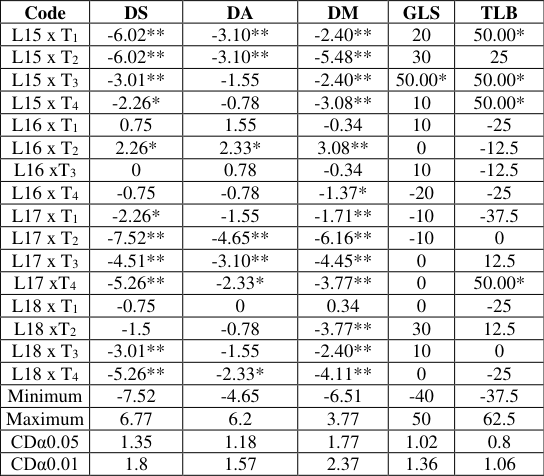 Table 4
Introduction
Maize (Zea mays L.) belongs to the tribe Maydeae of grass family Poaceae, which is diploid with a basic set of ten (n=10) chromosomes (Paliwal, 2000b) [11] . Maize has a wider environmental plasticity, and occupies the unique place as queen of cereals because of its immense potential. Nowadays, Maize has been recognized as industrial crops due to its diversified products (Pavan et al., 2011) [13] . Ethiopia is the fourth largest maize producing country in Africa, and first in the East African region (FAO, 2019) [22] . In Ethiopia, the research system has developed and released/recommended a number of improved Maize varieties with their agronomic practices and plant protection technologies for maize growing agro-ecologies; mid-altitude sub-humid, highland, low moisture stress and lowland sub-humid (Banti et al., 1993) [2] . Maize ranks first and is followed by teff, sorghum, wheat, barley and millet in production and productivity (Aman et al., 2022) [20] . From the total volume of maize production; 95% was produced by small holder and remainder 5% by commercial farms, most of which were used for seed. Maize has significant values for Ethiopia where rapidly increasing population has already outstripped the available food supplies. The increasing Maize production and alternative utilization in food channels can reduce the pressure on wheat, rice, and its import. Productivity of maize was estimated to 4.179 (Ethiopia), 4.292 (Oromia), 4.574 (West Wollega) and 4.571 (Kellem Wollega) tone per one hectare of land (CSA, 2020/21) [4] . The progress observed could be resulted from maize productivity improvement through utilization of appropriate inputs and crop management than area expansion (FAO, 2019) [22] . Hybrid Maize varieties have played a vital role in increasing production and productivity as it has much higher yield potentiality than those of synthetics and composites (Karim et al., 2018) [7] . Heterosis is as prerequisite as combining ability for developing a good economically viable hybrid maize variety. The magnitude of heterosis provides information on extent of genetic diversity of parents in developing superior F1 so as to exploit hybrid vigor and has direct bearing on breeding methodology to be adapted for varietal improvement (Radish et al., 2014) [15] . Therefore, current study was developed with the main objective of estimating direction and magnitude of standard heterosis for grain yield and yield attributing agronomic traits in mid-altitude maize at Haro Sabu Agricultural Research Center, West Oromia, Ethiopia.
Materials and Methods
Materials and Methods
Description of the study area
Field experiment was executed at Haro Sabu Agricultural Research Center main station in main cropping season of 2019. Experimental area is found at 550 kilometers from Addis Ababa; the capital city of Ethiopia. The research station is found between 8°52'51''N (latitude), 35°13'18''E (longitude) and 1515 meter above sea level with Nitosol having sandy loam soil textural class. The study area is characterized with unimodal rain fall distribution pattern from April to November. During the experimental execution the area received 1481 mm annual rain fall with 12.65 o C and 28.93 °C monthly minimum and maximum temperature, respectively.
Experimental materials
Test Materials: Field experiment was carried out on seventy-two test crosses and three standard checks (BH-543, BH-546 and BH-547) adapted to mid-altitudeagro-ecology of west Ethiopia. Test crosses were developed by crossing 18 inbred lines with 4 single cross testers in line x tester mating design developed by Kempthorne (1957) [8] . The inbred lines were developed at Bako National Maize Research Center (BNMRC) using pedigree method (Table 1).
| Code | Pedigree | Source |
|---|---|---|
| L1 | BLWBAMNM SYN 2006F3-35-2-1-1-1 | BNMRC |
| L2 | BLWBAMNM SYN 2006F3-35-2-2-2-1 | BNMRC |
| L3 | BLWBAMNM SYN 2006F3-35-2-2-3-1 | BNMRC |
| L4 | BLWBAMNM SYN 2006F3-61-2-1-1-1 | NMRC |
| L5 | BLWBAMNM SYN 2006F3-149-1-1-2-1 | BNMRC |
| L6 | NM Composite 2008-10-3-2-2-1-1 | BNMRC |
| L7 | NM Composite 2008-10-3-2-2-1-2 | BNMRC |
| L8 | NM Composite 2008-42-2-1-1-1-1 | BNMRC |
| L9 | NM Composite 2008-42-2-1-1-2-1 | BNMRC |
| L10 | NM Composite 2008-45-1-2-1-1-1 | BNMRC |
| L11 | (SC-22 x Z605C2F2428-3-B-B-B-B-B-# X SC-22)F2 x SC-22(F2)-13-2-2-1-1-1 | BNMRC |
| L12 | (SC-22x DRA-F2-141-2-1-1-10-B-B-#XSC-22)F2 x SC-22(F2)-9-1-1-2-1-1 | BNMRC |
| L13 | CML-197 x 142-1-e(F2) 17-1-1-1-1-1-1 | BNMRC |
| L14 | CML-197 x 142-1-e(F2) 60-1-1-1-1-1-1 | BNMRC |
| L15 | CML-197 x 142-1-e(F2) 60-1-1-2-1-1-1 | BNMRC |
| L16 | CML-197 x 142-1-e(F2) 197-1-1-1-1-1-1 | BNMRC |
| L17 | 35B-190-O-S10-2-1-2-2-1-3-1-1 | BNMRC |
| L18 | 35B-190-O-S10-2-1-2-3-1-1-1-1 | BNMRC |
| T1 | PO'00E-3-2-1-2-1/CML312 | BNMRC |
| T2 | CML202/ILO'00E-1-9-1-1-1-1-1 | BNMRC |
| T3 | CML312/CML442 | CIMMYT |
| T4 | CML395/CML202 | CIMMYT |
| BH-543 | Released Variety | BNMRC |
| BH-546 | Released Variety | BNMRC |
| BH-547 | Released Variety | BNMRC |
| Key: BNMRC= Bako National maize research centre, CIMMTY= International Maize and Wheat Improvement Centre, L= inbred lines, T=Testers |
Table text extracted from the original PDF; superscript letters are shown inline. The original table image is below.
View original table image
Experimental design and field management
Field experiment was conducted in 5x15 alpha-lattice (0,1) design with two replications, where one replication holds 15 blocks each consists of 5 plots following the procedure suggested by Patterson and Williams (1996) [14] . Two row plots with 5.1 m length were used at 75 cm and 30 cm row and plant spacing, respectively. Two seeds were planted per hill and followed by thinning to one plant per hill after seedling establishment to obtain a total plant population of 44,444 per hectare. In organic fertilizer; DAP (18% N and 46% P 2 O 5 ) was applied at the rate of 100 kgha -1 , whereas, Urea (46% N) used at the rate of 200 kg ha -1 in split form (each 50% at sowing and knee height). All management practices were commenced as uniformly as required (Nasir Abda Aman et al, 2022) [23] .
Code
Code
Data analysis
Field data were collected on grain yield and yield attributing agronomic traits including number of ear per plant, number of kernels row per ear, number of kernels per row, weight of thousand kernel (gram), ear height (cm), plant height (cm), harvesting index (ton ha -1), shelling percentage (%), number of days to anthesis, number of days to anthesis silking interval, number of days to silking, number of days to maturity, and disease reaction; gray leaf spot and tarcicum leaf blight on the base of 1-9 score using the procedures developed in Maize descriptor. The collected data were subjected to SAS statistical package (SAS, 2006 version 9.1.3) [16] for further analysis. Mean separation was carried out by deploying Duncan's New Multiple Range Test (DNMRT), the procedure suggested by Gomez and Gomez (1984) [6] .
Standard Heterosis
Estimation of standard heterosis (SH%) was commenced by following the method developed by Falconer and Mackay (1996) [5] .
Where, SH= standard heterosis, F 1 = mean value of the cross, STV=mean value of standard check.
The difference in the magnitude of heterosis was tested following the procedure of Panse Sukhatme (1961) [12] . Standard error and critical difference were computed as;
Where, SE (d) is standard error of the difference, MSe=error mean square from analysis of variance, r= number of replications, CD=critical difference and t=value of t at error degree of freedom. The test of significance of heterosis in relation to standard check was done by't' test suggested by Snedecor and Cochran (1967) as follows:
The computed t-value was compared with the t-value at error degree of freedom corresponding to 5 or 1% level of significance.
Results and Discussion
Results and Discussion
Analysis of variance (ANOVA)
Analysis of variance revealed significant (P<0.01) variation of genotypes for all observed traits except for shelling percentage (SP), stand count at harvesting (SCH) and common leaf rust (CLR) as shown in Table 2. The presence of significant genotypic difference indicates existence of inherent genetic variation which could be exploited and makes selection possible for further maize breeding program. The depicted genetic variation among the tested genotypes for character of interest pave the way for breeder to carryout careful selection of the most desirable crosses and these finding is in agreement with Kumar et al. (2021) [9] ; Yadesa (2022) [24] .
| Traits | Error (df=46) | Rep (df=1) | Rep (block) (df=28) | Entry (df=74) |
|---|---|---|---|---|
| Grain yield (GY) | 0.22 | 0.5 | 0.24 | 3.92** |
| Number of ear per plant (EPP) | 0.01 | 0.03 | 0.02 | 0.08** |
| Kernels row per ear (KRPE) | 0.63 | 0.03 | 0.62 | 2.57** |
| Kernels per row (KPR) | 9.26 | 11.54 | 15.33 | 33.13** |
| Thousand kernel weight (TKW) | 166.28 | 1.48 | 84.95 | 753.48** |
| Shelling percentage (SP) | 4.48 | 14.15 | 4.44 | 5.07 |
| Plant height (PH) | 81.92 | 1845.98** | 86.19 | 336.74** |
| Ear height (EH) | 50.69 | 315.26 | 34.16 | 274.55** |
| Stand count at harvesting (SCH) | 1.94 | 12.91 | 1.21 | 3.12 |
| Harvesting index (HI) | 18.95 | 57.81 | 37.45 | 82.73** |
| Days to anthesis (DA) | 0.34 | 0.01 | 0.38 | 4.10** |
| Days to silking (DS) | 0.45 | 0.11 | 0.47 | 6.18** |
| Anthesis-silking interval (ASI) | 0.18 | 0.11 | 0.24 | 0.65** |
| Days to maturity (DM) | 0.78 | 0.81 | 0.85 | 12.45** |
| Gray leaf spot (GLS) | 0.26 | 0.88 | 0.26 | 0.77** |
| Tarcicum leaf blight (TLB) | 0.16 | 0.28 | 0.14 | 0.46** |
| Common leaf rust (CLR) | 0.14 | 0.03 | 0.13 | 0.24 |
Table text extracted from the original PDF; superscript letters are shown inline. The original table image is below.
View original table image
Mean Performance of Maize Genotypes
The mean grain yield (GY) varied from 6.46 ton ha -1 for L17xT 4 to 12.39 ton ha -1 for L3xT 1 with an overall mean of 8.22 ton ha -1 . 24 crosses exhibited higher mean GY than BH547. L3xT 1 and L5xT 1 increased grain yield over BH547 by 24%. Most crosses involve L5, L8, T 1 and T 2 as parents and such performance most likely could be resulted from using inbred lines from diverse germplasm source or belonging to testers to different heterotic groups. The higher grain yield of crosses over BH547 shows the high possibility of selecting a better commercial variety. This finding is in correspondence with Woldu et al. (2020) [21] and Yadesa (2022) [23] who reported significant mean of grain yield and related traits than the best hybrid check. For EPP; the minimum and maximum value 0.90 and 1.75 was recorded from L2xT 3 and L6xT 4 crosses with an overall mean of 1.39, respectively. The mean of 18 crosses were significantly higher than the mean of BH547. Number of kernels row per ear (KRPE) ranged from 11.45 for L4xT 2 to 17.33 for L5xT 2 with the average 14.46. L5xT 1 , L5xT 2 , L3xT 1 and L10xT 2 showed significantly higher KRPE than BH547 (14.45), while L5xT 1 and L5xT 2 had significantly higher mean than BH543. Similarly, the mean for number of kernels per row (KPR) varied from 30.23 for L1xT 3 to 48.15 for L11xT 1 with average mean of 40.48. No cross had significantly higher mean than BH547 for KPR; however, numerically higher mean was recorded from twenty eight crosses (Results were not displayed). Mean of thousand kernel weight (TKW) ranged from 287.45 giram for L10xT 4 to 382.52 giram for L3xT 2 with average mean of 335.73 giram. Despite no crosses with higher and significant mean of TKW than BH543, significantly higher mean of TKW was retained from L11xT 3 over BH547. This result is in agreement with Woldu et al. (2020) [21] ; Yadesa (2022) [24] for GY and yield attributing traits; KRPE, KPR and TKW. For plant height (PH); the shortest (227.80 cm) and the tallest (292.60cm) mean was retained from L17xT 3 and L13xT 1 with an overall mean of 262.17 cm, respectively. Though no cross had significantly taller PH than BH547; L13xT 1 , L8xT 4 , L8xT 3 , L13xT 3 and L3xT 1 were significantly taller than BH543 and increased PH by 5-7% than BH547. 15 crosses explained significantly shorter PH than BH547. The shortest ear height (EH) was exhibited by L1xT 3 (98.54cm) while the tallest EH displayed by L13xT 2 (153.23cm) with average mean of 133.48cm (Results were not displayed). The significantly lower ear height (EH) was displayed by 22 crosses compared to BH547 and the existence of inherent genetic variability for plant statue reveals the opportunity to improve these genotypes for different farming system. With this, the cross identified for shorter plant statue are desirable to develop lodging resistant varieties and for easy field management. Extremely dwarf varieties have the problem of crowded canopy, aeration and transmission of sun light to the lower parts resulting in drastic reduction in yield. Unlikely, the cross with higher plant statue contribute a gene responsible for high biomass yield which might be used in animal feeding, fencing and fuel in rural areas are susceptible to lodging. Hence, attention should be given during inclusion of the selected cross in maize breeding. Woldu et al. (2020) [21] ; Kumar et al. (2021) [9] reported the increasing and decreasing plant statue over the standard checks in their separate study. For harvest index (HI), L2xT 3 displayed the lowest mean (33.05 t ha -1 ) while L10xT 2 showed the highest mean (58.99 t ha -1 ) with average mean of 46.86 t ha -1 . The mean of 52.57, 48.79 and 42.49 t ha -1 HI were recorded from BH543, BH547 and BH546 standard check, respectively. The mean of 22 and 26 crosses were higher than BH543 and BH547, respectively for HI. Conversely, some crosses attained significantly lower mean HI than BH543. This result can be justified through further evaluation of these genotypes across years and over locations. The minimum mean number of days to anthesis (61.5days) was exhibited by L14xT 1 while the maximum (68.5 days) was recorded from L6xT 3 , L8xT 4 and L8xT 3 with average mean of 64.17. L6xT 3 , L8xT 4 and L8xT 3 increased DA by 2.92% than the latest hybrid check, BH547 (65.5 days). The minimum and maximum value of 61.5 and 71 were recorded from L17xT 2 and L6xT 3 , respectively for days to silking (DS) with average mean of 65.79 days. L6xT 3 , L6xT 4 , L8xT 3 , L8xT 4 and L13xT 2 were significantly later in DA, DS and ASI compared to BH547. The shortest (0 day) anthesis silking was displayed by L15xT 1 , L15xT 2 , L18xT 4 , L17xT 2 and L17xT 4 while the longest ASI (2.5 days) was retained by L9xT 1 , L13xT 2 , L11xT 3 , L6xT 4 , L6xT 3 , L8xT 4 and L8xT 3 with average mean of 1.6. As ASI is the most desirable trait in determining drought tolerance, the cross identified for shorter mean indicates short gaps between days to DA and DS, which are desirable for good seed setting and drought tolerance. Away from this; the longer ASI, the variability of pollen would be reduced and abnormal fertilization might take place or not totally happen, which may in turn leads to yield lose and these finding was comparable with Kumar et al. (2021) [9] ; Xiao et al. (2021) [19] reports. For DA and DS, 20 and 19 crosses were significantly earlier than BH547, respectively. L2xT 2 and L14xT 4 retained significantly earlier DA while L17xT 4 , L18xT 4 , L15xT 2 and L15xT 1 displayed significantly longer DS than BH543. For days to maturity (DM), the earliest was 136.5 days (L4xT 3 ) and the latest was 151.5 days (L6xT 3 ) with an overall mean of 144.13 days. L6xT 3 , L6xT 4 , L16xT 2 , L13xT 2 and L8xT 4 were significantly later in maturity and increased DM by 1.68-3.63% over BH547. 31 crosses were significantly earlier maturing than BH547 while 7 crosses displayed significantly earlier DM than BH543, illustrating their importance to develop earlier varieties for moisture stress areas since earliness are desirable to increase water use efficiency (Results were not displayed). The cross attaining the higher mean for DA, ASI, DS and DM could be used as a source of gene governing late phonological traits. Conversely, those crosses attained shorter mean for these traits may contribute a gene responsible for earliness. The earlier maturing crosses are suitable in agro-ecologies receiving shorter rainy season thereby to escape moisture stress encountered during grain filling period. Woldu et al. (2020) [21] also reported the earliest and fastest maturing hybrid over the standard checks so far. Gray leaf spot (GLS) severity score ranged from 1.50 (L3xT 1 and L6xT 2 ) to 3.75 (L1xT 3 , L2xT 2 , L15xT 3 , L1xT 4 , L11xT 1 , L9xT 4 , L4xT 4 and L14xT 4 ) with average mean of 2.52. The desirable lower mean (1.25) severity score was displayed by L2x T 1 , L8 xT 2 , L11xT 1 , L13xT 2 , L13xT 4 and L17xT 1 for Turcicum leaf blight (TLB) where the higher and undesirable severity score 3.25 was retained from L7xT 4 and L14xT 4 with an overall mean of 1.92. 35 and 44 crosses attained the lower mean severity score than BH-547 for GLS and TLB, respectively (Results were not displayed). For TLB the result of present study was not consistent with Gudeta et al. (2015) who reported nonsignificant difference of maize genotypes in the study of heterosis and combining ability in QPM version of early generation high land maize inbred line in Ethiopia. None consistency of the result might be attributed by the use of inbred lines from diverse sources of germplasm in generation of the crosses, which was in correspondence with Woldu et al. (2020) [21] ; Annor et al. (2020) [1] ; Xiao et al. (2021) [19] .
Standard Heterosis
Among the 3 standard checks used in this study; BH543, BH546 and BH547, standard heterosis (SH) was considered for BH547 due to its better mean performance for grain yield and most of yield attributing traits considered in this study. Standard heterosis was further estimated for agronomic traits attaining significant (P<0.01 or P<0.5) difference in analysis of variance (Table 2). The magnitude and direction of standard heterosis varied for a trait from cross to cross or among different traits, indicating the existence of considerable amount of standard heterosis for improvement of grain yield and yield attributing traits including foliar disease reaction. These results are in correspondence with Annor et al. (2020) [1] ; Yadesa (2022) [24] . Desirable positive and significant standard heterosis (SH) was estimated for grain yield, ear per plant and kernels row per ear. Conversely, the desirable negative and significant SH was computed for days to anthesis and maturity (Table 3). The standard heterosis for grain yield (GY), varied from 31.04% for L17xT 4 to 32.37% for L3xT 1 over the high yielding hybrid check, BH547. 14 crosses exhibited positive and significant (p<0.01 or p<0.5) standard heterosis than BH547 for GY consistently. In line with this, Malkamu et al. (2018) [10] ; Yadesa (2022) [24] reported different magnitude of standard heterosis for grain yield. For ear per plant (EPP), 23 crosses revealed the desirable significant and positive standard heterosis (SH) which varied from -31.82% for L2xT 3 to 32.20% for L6xT 4 over BH547 (Table 3). These cross combination is highly prolific than the standard check and could be used to improve grain yield. Complimentary result was found by Anor et al. (2020); Kumar et al. (2021) [9] who reported the increasing SH effect for number of ear per plant. On the contrary, three crosses showed undesirable significant and negative SH for EPP (Table 3). The finding of this study was in contrary with Berhanu (2009) [3] who reported the undesirable negative SH over the best check for EPP, indicating presence of increasing and decreasing SH effect in maize crosses for EPP. For kernel row per ear (KRPE), 8 crosses including L3xT 1 , L5xT 1 , L5xT 2 , L6xT 4 , L10xT 2 , L11xT 1 and L11xT 3 exhibited the desirable significant (P<0.01 or P<0.5) and positive SH which was found in the range of -20.76 for L4xT 2 and 22.70 for L5xT 2 . Conversely, L4xT 2 , L4xT 4 , L7xT 4 , L10xT 4 and L13xT 1 showed undesirable negative and significant (P<0.01 or P<0.5) SH over BH547 for KRPE consistently (Table 3). This result was not comparable with the finding of Woldu et al. (2020) [21] ; Yadesa (2022) [24] who reported none of the hybrids exhibited positive and significant economic heterosis for kernel row per ear. For kernel per row (KPR), the lowest SH of -27.80% was detected from L1xT 3 while the highest value of 15.01% from L11xT 1 over BH547. Most of the crosses had non-significant (p>0.05) SH for KRPE and KPR compared to the check (Table 3). Karim et al. (2018) [7] ; Kumar et al. (2021) [9] reported significant heterosis for grain yield and yield attributing traits which was in accordance with this study. Standard heterosis for thousand seed weight (TKW) ranged from -17.77% for L10xT 4 to9.43%for L3xT 2 than BH547. Positive and significant SH of TKW was computed from L3xT 2 and L8xT 3 over BH-547. This finding was in agreement with Malkamu et al. (2018) [10] ; Yadesa (2022) [24] who reported the positive and significant SH for GY and yield related traits such as KRPE, KPR and TKW than BH547. Standard heterosis (SH) for harvesting index (HI) varied from -32.26% for L2xT 3 to 20.91% for L10xT 2 compared with BH547. L5xT 2 , L10xT 2 and L12xT 1 cross showed desirable positive and significant SH over the check consistently (Table 3). The minimum value of SH was estimated from L17xT 2 and L14xT 1 while the maximum value estimated from L6xT 3 , L8xT 3 and L8xT 4 compared to BH547 for DA. Standard heterosis of days to silking (DS) varied from -7.52% for L17xT 2 to 6.77% for L6xT 3 and L8xT 4 than BH547. For days to maturity (DM), L4xT 3 showed the lowest value of SH while L6xT 3 and L6xT 4 exhibited the highest values over the late matured check (BH547). Therefore, as maturity related traits viz; DA, DS and DM concerned; the desirable negative and significant SH was observed for many cross combinations over high yielding hybrid check BH547 (Table 4). Such genotypes identified for their earlier maturity could be used in multiple cropping systems and to increase efficient land and water use. Significant heterosis for phonological traits have been said by way of a variety of people including Kumar et al. (2021) [9] ; Yadesa (2022) [24] ; Xiao et al.
| Code | DS | DA | DM | GLS | TLB |
|---|---|---|---|---|---|
| L15 x T1 | -6.02** | -3.10** | -2.40** | 20 | 50.00* |
| L15 x T2 | -6.02** | -3.10** | -5.48** | 30 | 25 |
| L15 x T3 | -3.01** | -1.55 | -2.40** | 50.00* | 50.00* |
| L15 x T4 | -2.26* | -0.78 | -3.08** | 10 | 50.00* |
| L16 x T1 | 0.75 | 1.55 | -0.34 | 10 | -25 |
| L16 x T2 | 2.26* | 2.33* | 3.08** | 0 | -12.5 |
| L16 xT3 | 0 | 0.78 | -0.34 | 10 | -12.5 |
| L16 x T4 | -0.75 | -0.78 | -1.37* | -20 | -25 |
| L17 x T1 | -2.26* | -1.55 | -1.71** | -10 | -37.5 |
| L17 x T2 | -7.52** | -4.65** | -6.16** | -10 | 0 |
| L17 x T3 | -4.51** | -3.10** | -4.45** | 0 | 12.5 |
| L17 xT4 | -5.26** | -2.33* | -3.77** | 0 | 50.00* |
| L18 x T1 | -0.75 | 0 | 0.34 | 0 | -25 |
| L18 xT2 | -1.5 | -0.78 | -3.77** | 30 | 12.5 |
| L18 x T3 | -3.01** | -1.55 | -2.40** | 10 | 0 |
| L18 x T4 | -5.26** | -2.33* | -4.11** | 0 | -25 |
| Minimum | -7.52 | -4.65 | -6.51 | -40 | -37.5 |
| Maximum | 6.77 | 6.2 | 3.77 | 50 | 62.5 |
| CDα0.05 | 1.35 | 1.18 | 1.77 | 1.02 | 0.8 |
| CDα0.01 | 1.8 | 1.57 | 2.37 | 1.36 | 1.06 |
Table text extracted from the original PDF; superscript letters are shown inline. The original table image is below.
View original table image
| Code | DS | DA | DM | GLS | TLB | Code | DS | DA | DM | GLS | TLB |
|---|---|---|---|---|---|---|---|---|---|---|---|
| L1 x T1 | 0 | 0 | -2.40** | 10 | 0 | L8 x T1 | 0.75 | 1.55 | -0.34 | 0 | -25 |
| L1x T2 | -2.26* | -1.55 | -2.40** | 0 | -12.5 | L8 x T2 | 3.01** | 3.10** | 1.03 | -30 | -37.5 |
| L1 x T3 | -2.26* | -1.55 | -1.71** | 50.00* | 12.5 | L8 xT3 | 6.02** | 6.20** | 1.03 | -20 | -25 |
| L1 x T4 | -1.5 | -1.55 | -2.40** | 50.00* | 50.00* | L8 x T4 | 6.77** | 6.20** | 1.71** | -30 | -12.5 |
| L2x T1 | -1.5 | -1.55 | -0.34 | -30 | -37.5 | L9 x T1 | -0.75 | -1.55 | -1.03 | 0 | -12.5 |
| L2 x T2 | -4.51** | -3.88** | -2.40** | 50.00* | 0 | L9 x T2 | 0 | 0 | 0.68 | -10 | -25 |
| L2 xT3 | -3.76** | -2.33* | -1.71** | 40 | 0 | L9 x T3 | -0.75 | 0 | -1.03 | 10 | -12.5 |
| L2 x T4 | -2.26* | -1.55 | -1.03 | 20 | 50.00* | L9 x T4 | -1.5 | -1.55 | -2.4.00** | 50.00* | -25 |
| L3 x T1 | 0 | 0 | -1.37* | -40 | -12.5 | L10 xT1 | -3.76** | -3.10** | -2.4.00** | 30 | -12.5 |
| L3 x T2 | 0.75 | 0.78 | -1.03 | -30 | -12.5 | L10 x T2 | -1.5 | -1.55 | -1.03 | -30 | -12.5 |
| L3 x T3 | 0 | 0 | -1.03 | -20 | 0 | L10 xT3 | -1.5 | -1.55 | -1.03 | -10 | -12.5 |
Table text extracted from the original PDF; superscript letters are shown inline. The original table image is below.
View original table image
| Code | GY | EPP | KRPE | KPR | TKW | EH | PH | HI |
|---|---|---|---|---|---|---|---|---|
| L15 x T1 | -21.96** | -8.71 | -2.42 | -4.85 | -14.00** | -19.86** | -12.24** | -27.16** |
| L15 x T2 | -19.39** | -1.89 | -3.56 | -13.33 | -9.53* | -22.07** | -11.15** | -22.26* |
| L15 x T3 | -12.71* | -0.38 | 1.9 | -16.15* | -8.54* | -26.68** | -12.93** | -6.9 |
| L15 x T4 | -8.87 | 22.73* | -9.13 | -13.38 | -14.82** | -31.21** | -11.97** | -4.71 |
| L16 x T1 | -15.71** | -7.58 | -1.45 | 4.95 | -4.72 | -16.73** | -7.40** | -11.07 |
| L16 x T2 | 12.61* | 7.2 | 2.84 | 4.25 | 5.75 | -2.97 | -1.75 | 10.66 |
| L16 xT3 | -25.16** | -16.67 | 1.56 | -1.7 | -0.31 | -4.79 | -3.12 | -9.72 |
| L16 x T4 | -12.23* | -8.33 | 0.35 | 9.51 | -2.41 | -3.23 | -1.14 | -3.59 |
| L17 x T1 | 9.83 | 14.77 | -2.98 | -3.42 | -4.17 | -10.80* | -5.51** | 7.58 |
| L17 x T2 | -15.49** | -16.29 | -2.63 | -13.38 | -10.16** | -14.69** | -7.38** | -7.79 |
| L17 x T3 | -20.35** | -8.71 | -6.3 | -18.16* | -8.30* | -22.84** | -16.13** | -21.91* |
| L17 xT4 | -31.04** | 0 | -8.2 | -20.93** | -9.53* | -4 | -3.50* | -14.86 |
| L18 x T1 | 14.16** | 28.41** | 2.91 | 9.72 | -0.5 | 1.79 | -2.77 | 12.52 |
| L18 xT2 | -9.51 | 0 | 0.21 | -12.45 | -14.48** | -3.7 | -4.30* | -14.22 |
| L18 x T3 | -11.22* | 14.39 | -2.91 | -12.66 | -11.31** | -21.51** | -9.35** | -7.54 |
| L18 x T4 | -22.65** | 16.29 | -7.58 | -7.38 | 0.53 | -7.58 | -5.77** | -9.74 |
| Minimum | -31.04 | -31.82 | -20.76 | -27.8 | -17.77 | -32.5 | -16.13 | -32.26 |
| Maximum | 32.37 | 32.2 | 22.7 | 15.03 | 9.43 | 4.41 | 7.72 | 20.91 |
| CDα0.05 | 0.94 | 0.23 | 1.6 | 6.13 | 25.96 | 14.33 | 18.22 | 8.76 |
| CDα0.01 | 1.26 | 0.31 | 2.14 | 8.18 | 34.65 | 19.13 | 24.32 | 11.7 |
Table text extracted from the original PDF; superscript letters are shown inline. The original table image is below.
View original table image
| L11 xT2 | 0.11 | -1.89 | 0.8 | 6.95 | -1.48 | -1.71 | -5.37** | -0.61 |
|---|---|---|---|---|---|---|---|---|
| L11 x T3 | 23.45** | 30.68** | 11.59* | 12.24 | 6.83 | -11.04* | -3.24* | 13.83 |
| L11 x T4 | -3.26 | 1.52 | -4.71 | 11.44 | -3.16 | -15.07** | -8.90** | 8.94 |
| L12 x T1 | 19.76** | 20.45* | 9.34 | 7.12 | -6.58 | -2.73 | -1.4 | 18.55* |
| L12 xT2 | -2.88 | -2.27 | -2.56 | -3 | -6.4 | 1.73 | -1.3 | -9.96 |
| L12 x T3 | -11.86* | -17.42 | -4.71 | -6.98 | 0.45 | 1.86 | 1.65 | -2.66 |
| L12 x T4 | -27.46** | -0.76 | -4.98 | -8 | 2.38 | -0.6 | -0.19 | -14.04 |
| L13 xT1 | -17.95** | 6.44 | -11.7* | 5.61 | -2.57 | -4.36 | 7.72** | -17.01 |
| L13 x T2 | 11.81* | 22.73* | 3.39 | -1.72 | 3.61 | 4.96 | 1.02 | 12.2 |
| L13 x T3 | 8.81 | 23.86** | 1.8 | -1.77 | 0.38 | -1.13 | 5.86** | 12.5 |
| L13x T4 | -16.03** | -1.14 | -9.83 | 5.21 | -1.07 | 1.2 | 2.36 | 8.61 |
| L14 x T1 | -18.11** | -0.38 | -6.51 | 0.84 | -2.61 | -1.55 | -0.19 | -17.01 |
| L14 x T2 | -6.62 | 7.2 | -5.16 | -7.6 | -12.77** | -8.49 | -4.80** | 1.11 |
| L14 x T3 | -27.51** | -14.77 | 2.94 | -1.74 | -12.91** | -27.10** | -14.18** | -22.24* |
| L14 x T4 | -5.82 | 13.64 | -6.57 | 0.57 | -9.89* | -19.82** | -12.61** | 9.4 |
Table text extracted from the original PDF; superscript letters are shown inline. The original table image is below.
View original table image
| Code | GY | EPP | KRPE | KPR | TKW | EH | PH | HI |
|---|---|---|---|---|---|---|---|---|
| L8 x T1 | 30.13** | 22.73* | 5.26 | -3.15 | -2.77 | -0.36 | 3.77* | 11.79 |
| L8 x T2 | 22.33** | 21.21* | 0.21 | -1.77 | -7.14 | -3.16 | 1.77 | 10.53 |
| L8 xT3 | 1.12 | -17.05 | 7.72 | -1.79 | 8.80* | 1.38 | 6.09** | -11.99 |
| L8 x T4 | 20.03** | 30.68** | 6.89 | 7.08 | 6.15 | -0.18 | 6.62** | 16.68 |
| L9 x T1 | -29.11** | 6.44 | 0.07 | -3.08 | -2.44 | -3.34 | -0.56 | -9.04 |
| L9 x T2 | 15.12** | 30.30** | -2.6 | 1.67 | -2.34 | -1.66 | 1.2 | 12.71 |
| L9 x T3 | -19.71** | -15.15 | 1.25 | -10.19 | 0.09 | -18.07** | -6.41** | -19.06* |
| L9 x T4 | -7.1 | 15.15 | 2.94 | -9.25 | -10.65** | -7.9 | -4.20* | 9.41 |
| L10 xT1 | -13.35* | 22.73* | 9.34 | 2.22 | -5.49 | 1.19 | -0.1 | -8.01 |
| L10 x T2 | 21.53** | 30.30** | 16.12** | -8.16 | -9.51* | 2.23 | 4.15* | 20.91* |
| L10 xT3 | -20.67** | -24.24** | 3.53 | -8.86 | -11.35** | -11.93* | -2.18 | -8.01 |
| L10 x T4 | -15.06** | 21.21* | -18.37** | 9.39 | -17.77** | -4.02 | -2.36 | 10.56 |
| L11 xT1 | -3.1 | 14.77 | 12.04* | 15.03* | -1.61 | -5.44 | 3.22 | -3.91 |
Table text extracted from the original PDF; superscript letters are shown inline. The original table image is below.
View original table image
| Code | GY | EPP | KRPE | KPR | TKW | EH | PH | HI |
|---|---|---|---|---|---|---|---|---|
| L1 x T1 | -15.54** | -8.71 | 0.73 | -14.48 | -5.43 | -3.95 | 1.67 | -21.46* |
| L1x T2 | -16.24** | -17.05 | 1.25 | -20.74** | -9.33* | -12.33* | -5.51** | -17.38 |
| L1 x T3 | -20.51** | -17.05 | -4.08 | -27.80** | -11.03** | -32.50** | -9.79** | -27.83** |
| L1 x T4 | -19.12** | -1.52 | -7.89 | -9.75 | -8.07* | -18.76** | -8.78** | -9.88 |
| L2x T1 | 1.34 | 13.64 | 1.31 | -6.64 | -5.57 | -0.45 | -2.14 | -6.91 |
| L2 x T2 | -18.70** | 6.44 | -0.69 | -22.17** | -8.31* | -14.45** | -6.78** | -22.53* |
| L2 xT3 | -11.75* | -31.82** | 1.94 | -22.69** | -3.22 | -19.22** | -7.45** | -32.26** |
| L2 x T4 | -20.09** | -7.95 | -13.15* | 1.55 | -2.31 | -9.65 | -6.02** | -27.01** |
| L3 x T1 | 32.37** | 29.17** | 16.12** | 7.01 | 1.29 | -0.66 | 5.84** | 15.78 |
| L3 x T2 | 9.67 | 20.83* | 10.07 | 12.47 | 9.43* | -5.11 | 2.36 | 15.37 |
| L3 x T3 | -10.26* | -16.67 | 2.8 | -12.59 | -2.53 | -24.05** | -9.75** | -24.53** |
| L3 x T4 | -21.21** | 15.15 | -6.78 | 11.17 | -5.54 | -7.65 | -9.69** | -10.31 |
| L4 x T1 | -16.93** | -0.38 | 2.77 | 5.1 | -2.97 | -4.53 | -1.99 | -6.17 |
| L4 x T2 | 0.85 | 20.83* | -20.76** | -1.98 | -10.01** | -6.89 | -4.65** | -2.42 |
| L4 x T3 | -24.47** | -16.67 | -4.98 | -9.15 | -4.81 | -17.85** | -7.00** | -29.56** |
| L4 x T4 | -12.18* | 28.41** | -14.98** | 0.36 | -13.05** | -9.71 | -6.33** | -3.14 |
| L5 x T1 | 31.94** | 29.17** | 16.26** | 11.16 | 0.43 | -0.04 | 1.06 | 15.31 |
| L5 x T2 | 30.13** | 29.17** | 22.70** | 9.53 | 1.28 | 4.41 | 2.77 | 18.32* |
| L5x T3 | -10.74* | -24.24** | 5.47 | -11.61 | 4.91 | -17.93** | -8.22** | -12.11 |
| L5 x T4 | -17.31** | 23.48* | -2.01 | 10.01 | 2.71 | -7.29 | -6.98** | -5.96 |
| L6 x T1 | 7.32 | 12.5 | 4.29 | -4.16 | 1.34 | -4.91 | 1.51 | -2.89 |
| L6 x T2 | 1.66 | 22.73* | 3.53 | -9.05 | -7.54* | -2.73 | -0.04 | -13.04 |
| L6 x T3 | 9.4 | 28.41** | 11.87* | -7.96 | 0.45 | -2.75 | 1.31 | 11.6 |
| L6x T4 | 12.23* | 32.2** | 12.08* | 3.01 | 1.98 | -4.15 | -2.42 | 16.93 |
| L7 x T1 | -5.02 | 0.76 | -7.54 | -4.35 | -5.86 | -3.11 | 2.08 | 4.39 |
| L7 x T2 | -13.57** | 1.89 | 3.25 | -4.35 | -3.21 | -6.12 | -2.4 | -18.96* |
| L7 xT3 | -9.03 | -16.29 | 8.62 | 4.93 | -2.55 | -18.78** | -9.32** | -2.66 |
| L7 x T4 | -15.65** | 7.2 | -18.20** | -13.55 | -9.07* | -23.75** | -9.50** | 3.94 |
Table text extracted from the original PDF; superscript letters are shown inline. The original table image is below.
View original table image
(2021) [19] . Minimum value of -50.00% for L3XT 1 and L6XT 2 , and the maximum value of 50.00% standard heterosis were estimated from 8 crosses for GLS compared to BH547. The lowest magnitude of -37.50% standard heterosis was estimated from 7 crosses whereas the highest magnitude 62.50% computed from L7xT 4 and L14xT 4 cross combination over BH547 for TLB. Most of the crosses revealed non-significant SH for GLS and TLB compared to the check (Table 4). In general, the difference in percentages of SH can be attributed to the stage of inbreeding of used materials, the environmental conditions in which the materials were evaluated and the performance of the parental inbred lines. Hence, the identified crosses could be promising for commercial variety development after evaluating its performance and stability across years and locations. The result of present study was in accordance with (Yadesa, 2022; Xiao et al. (2021) [24,19] .
Conclusions
Cross combination displayed the desirable higher mean, positive and significant standard heterosis for grain yield, number of ear per plant, number of kernel row per ear, number of kernel per row, thousand kernel weight and harvesting index were identified in this study. Correspondently, some other F1 hybrids attained the desirable lower mean, negative and significant standard heterosis for days to anthesis, days to silking, anthesis silking interval, days to maturity, plant height, ear height, and gray leaf spot and tarcicium leaf blight. This indicates, predominance of non-fixable inter allelic interaction for respective traits. The desirable significant and positive heterotic response of grain yield was retained in particularly selected cross combinations like L3xL1, L5xL1, L5xT 2 , L6xT 4 , L8xT 1 , L8xT 2 , L8xT 4 , L9xT 2 , L10xT 2 , L11xT 3 , L12xT 1 , L13xT 2 , L16xT 2 and L18xT 1 consistently. These cross combination could be promising for commercial variety development after evaluating their performance and stability across years and locations.
Conflict of interests
The authors have not declared any conflict of interests.
Acknowledgements
The author acknowledges the contribution of the Haramaya University, Oromia Agricultural Research Institute, Haro Sabu Agricultural Research Center for their financial and technical support.
References
11 in the original paper- Karim ANMS, Ahmed Akhi AH, Taliukder MZA, Derm MZA, Mujahidi TA. Combining ability and heterosis study in Maize (Zea mays L.) hybrids at different environments in Bangladesh. Bangladesh Journal of Agricultural Research. 2018;43(1):125-134.
- Kumar S, Fayaz A, Ali G, Hamid A, Lone BA, Qureshi AMI. Standard Heterosis for Grain Yield and its Attributing Traits in Early Maturing Maize Hybrids. International Journal of Plant & Soil Science: 2021. p. 418-421.
- Melkamu Elmyhun, Chale Liyew, Abyneh Shita, Mekuanint Andualem. Combining ability performance and heterotic grouping of maize (Zea mays) inbred lines in testcross formation in Western Amhara, North West Ethiopia. Cogent Food and Agriculture. 2018;6(1):2020.
- Pavan Prakash PG, Karjin NM. General and specific combining ability studies in single cross hybrids of maize (Zea mays L.). Current Biotica. 2011;5(2):196-208.
- Patterson HD, Williams ER. A new class of resolvable incomplete block designs. Biometrika. 1976;63:83-90.
- Rashid M, Cheema AA, Ashraf M. Line x tester analysis in Basmati rice. Pakistan Journal of Botany. 2014;39:20352042.
- Narang KK, Jha SK. Effect of weed management on weed dynamics, crop growth, fodder yield and economics of fodder maize (Zea mays L.) African tall under Chhattisgarh condition. Int. J Adv. Chem. Res. 2022;4(2):235-241. DOI: 10.33545/26646781.2022.v4.i2d.104
- Yingjie Xiao, Shuqin Jiang, Qian Cheng, Xiaqing Wang, Jun Yan, Ruyang Zhang. The genetic mechanism of heterosis utilization in maize improvement. Genome Biology. 2021;22(1):1-29.
- Aman NA, Okoyo EN. Adoption of improved wheat varieties by smallholder farmers in Bale Zone, Ethiopia. Int J Agric Extension Social Dev. 2022;5(2):3-7. DOI: 10.33545/26180723.2022.v5.i2a.137
- Woldu M, Habtamu Z, Mandefro N. Standard heterosis for grain yield and yield related traits in maize (Zea mays L.) in bred lines in Haramaya District, Eastern Ethiopia. East Africa Journal of Science. 2020;14(1):51-64.
- Yadesa Lemi. Heterotic groupings, perse performance and standard heterosis of quality protein maize (Zea mays L.) for yield and yield contributor traits adapted at mid altitude of Ethiopia. International Journal of Research in Agronomy. 2022;5(2):42-52.
Cited by 6
From OpenAlex, OpenCitations and reference lists read by Scinovex
- Use of growth regulators & foliar spray of nutrients in black gram (Vigna mungo L.)
S. S. Thakare, YM Waghmare, SD Maindale · International Journal of Biology Sciences · 2025
A field experiment was conducted at Agronomy Section,College of Agriculture, Latur duringkharif season of 2022 to study the effect of foliar spray of nutrients and growth regulators in black gram (Vigna mungo L.).The soil of experimental plot was clayey loam. The experiment was laid out in a Randomized Block Design, with eight treatments and was replicated thrice. The treatments consistofT1- Control, T2- Foliar application of 22% seaweed extract at flower initiation, T3- Foliar application of 0.2% micronutrient grade 2 at flower initiation, T4- Foliar spray of 30 ppm GA3 at flower initiation,T
- Combining ability analysis and estimation of heterosis for grain yield and its component traits in maize (Zea mays L.)
Heet M Lunagariya, J. J. Savaliya, Harshul M Vora, Tejaskumar Borkhatariya, C. M. Godhani, Ravi Jambukiya · International Journal of Advanced Biochemistry Research · 2025
The analysis of variance revealed highly significant differences among the genotypes for all studied traits, indicating that the experimental materials exhibited sufficient genetic variability for all characteristics assessed. The estimates of heterosis over the better parent ranged from-9.66% to 62.42% concerning grain yield per plant. The cross CM 212-2 × GYL 1 (62.42%) showed the greatest positive heterosis compared to the better parent, followed by GYL 1 × GYL 10 (46.65%) and CM 111 × GYL 1 (36.95%). Economic heterosis varied between-43.63% and 38.30%. The combination GYL 4 × GYL 10 (38.30
- Biochemical changes in enset (Ensete ventricosum) during post-harvest handling ↗
Jiwook Choi · International Journal of Foreign Trade and International Business · 2025
Enset (Ensete ventricosum), a staple crop in Ethiopia, holds significant cultural, economic, and nutritional importance in the highland regions of the country. Traditionally, enset is consumed as a local food source through various products such as kocho (fermented corm), bulla (starch extract), and amicho (boiled corm). However, despite its crucial role in local food security, enset has not yet realized…
- Performance of Provitamin a Maize Hybrids for Yield and Desirable Agronomic Traits ↗
Lemi Yadesa, Belay Garoma, Gemechu Asefa · Innovation · 2024
To find improved F1 hybrids for breeding procedures, the heterosis of maize hybrids must be determined. Therefore, to identify prospective hybrids for use in future provitamin A maize breeding systems, this study was carried out to evaluate the amount of standard heterosis for grain yield and related attributes. Fifteen provitamin A maize inbred lines were crossed through the diallel-II design.…
❝ 0PDF - Evaluating the impact of climate change and agronomic inputs on sorghum yield a case study from Ethiopia ↗
Sisay Belete · International Journal of Pharmacognosy and Life Science · 2024
This study evaluates the dual impacts of climate change and agronomic inputs on sorghum yield in Ethiopia, a country where agriculture forms the backbone of the economy, particularly for rural populations. Sorghum (Sorghum bicolor), a drought-tolerant cereal, is widely cultivated in Ethiopia, offering crucial food security in arid and semi-arid regions. However, climate change poses a severe threat to its
- Biochemical changes in enset (Ensete ventricosum) during post-harvest handling ↗
Jae Young Choi · International Journal of Bioscience and Biochemistry · 2024
Enset (Ensete ventricosum) is a crucial staple crop in Ethiopia, known for its role in food security. The plant undergoes various biochemical changes during post-harvest handling that affect its nutritional quality, shelf life, and sensory properties. This paper explores the enzymatic, metabolic, and microbial transformations occurring during the post-harvest processing of enset. The focus is on fermentation, storage, spoilage mechanisms,