
Research article · 2023 · Full text
International Journal of Advanced Chemistry ResearchStudy of the factors affecting the adsorption efficiency of some chemical pesticides activated carbon at the nanoscale
Volume 5(1) · Pages 89–98 · DOI: 10.33545/26646781.2023.v5.i1b.147 ↗
Research areasWater Quality Monitoring and Analysis
Abstract
Author-writtenThe research included the use of nano-activated carbon commercial carbon and the diagnosis of nano activated carbon using different, techniques such as infrared spectroscopy (FT-IR), X-ray diffraction (XRD), scanning electron microscope (SEM), dispersion energy x-rays sine (EDX) Besides surface area analysis (BET), as it showed the results of a spectrum (FT-IR)the activated carbon does not contain, any active group, that is, it is chemically inert, and this is a good characteristic of nano activated carbon, as shown by the results of (XRD) the average crystal size of, the prepared activated carbon was found to be equal to (16.973) nm, which confirms that the prepared carbon contains nanoparticles, as shown by the results (SEM) and the (EDX) the sizes of the prepared carbon particles are approximately between (25.98-111.83 nm) and that the shape of the stomata (pores) on the surface bear the characteristics of nano materials with their properties, and that the highest percentage of carbon was (87.46%), and this result supports the efficiency of nano activated carbon and its use in the adsorption process, in addition to that, activated carbon has a surface area obtained according to the theory (BET) How much (712.81) m2/g, It is very suitable for use as an adsorbent, and the adsorption of some chemical pesticides from their aqueous solutions was studied using commercial activated carbon. the study included the effect of each of the amount of adsorbent, the effect of contact time, the effect of the initial concentration, the effect of the pH function and the effect of temperature on the adsorption system, the study showed that the adsorption efficiency follows the following order for the pesticides under study (GOL ˃ TFR) on the surface of, activated carbon, and that the adsorption system reaches equilibrium at a time of (50-60) min, and the highest percentage of adsorption on the surface of, activated carbon, is at the (pH=4) and the best amount was (0.1) gm of adsorbed substance to the system, and from studying the effect of temperature, it is clear that the percentage of pesticide adsorption on the surface of activated carbon decreases with increasing temperature, as well as studying the effect of the initial concentration. the adsorption efficiency decreases with increasing concentration, but the adsorption capacity (qe) increases with Increase focus when the temperature is constant.
Summary
Source-checkedPlain-language reading of the full paper, prepared with AI and checked against the text. Each point links to the authors' own words.
Why it matters
- The increase in pesticide use has led to significant environmental pollution, specifically the contamination of natural water sources, which harms living organisms. View evidence ↗
- Pesticide pollution is dangerous to human health, potentially causing cancer, genetic mutations, and the inhibition of enzyme activities. View evidence ↗
- Adsorption is considered one of the most effective and safe techniques for removing water pollutants that are otherwise difficult to treat. View evidence ↗
The question
- The study aimed to evaluate the adsorption efficiency of commercial nano-activated carbon for removing chemical pesticides from aqueous solutions, focusing on the effects of adsorbent dose, contact time, initial concentration, pH, and temperature. View evidence ↗
What they did
- The nano-activated carbon was characterized using FT-IR, XRD, SEM, EDX, and BET surface area analysis. View evidence ↗
- The study tested the adsorption of two specific pesticides: TRF and GOL. View evidence ↗
- To test the effect of adsorbent dose, five weights (0.1 to 0.5 g/L) were used at 298 K and natural pH. View evidence ↗
What they found
- The prepared activated carbon was confirmed to contain nanoparticles, with an average crystal size of 16.973 nm. View evidence ↗
- Elemental analysis showed that the activated carbon had a high carbon content of 87.46%. View evidence ↗
- The BET analysis determined the surface area of the activated carbon to be 712.81 m²/g. View evidence ↗
- The adsorption efficiency was higher for the pesticide GOL compared to TRF. View evidence ↗
- The adsorption system reached equilibrium within 50 to 60 minutes. View evidence ↗
- The maximum adsorption percentage was achieved at pH 4. View evidence ↗
- Pesticide adsorption efficiency decreased as the temperature increased. View evidence ↗
- Increasing the initial concentration decreased the overall adsorption efficiency but increased the adsorption capacity (qe) at a constant temperature. View evidence ↗
What it means
- The authors conclude that the optimal conditions for pesticide adsorption are an acidic medium and normal temperatures (approximately 25 °C). View evidence ↗
- The study concludes that nano-activated carbon is a highly efficient and cost-effective material for removing harmful pesticide pollutants. View evidence ↗
Visual summary
3 visualsIllustrations explain the paper; charts are replotted from the paper's own table values.
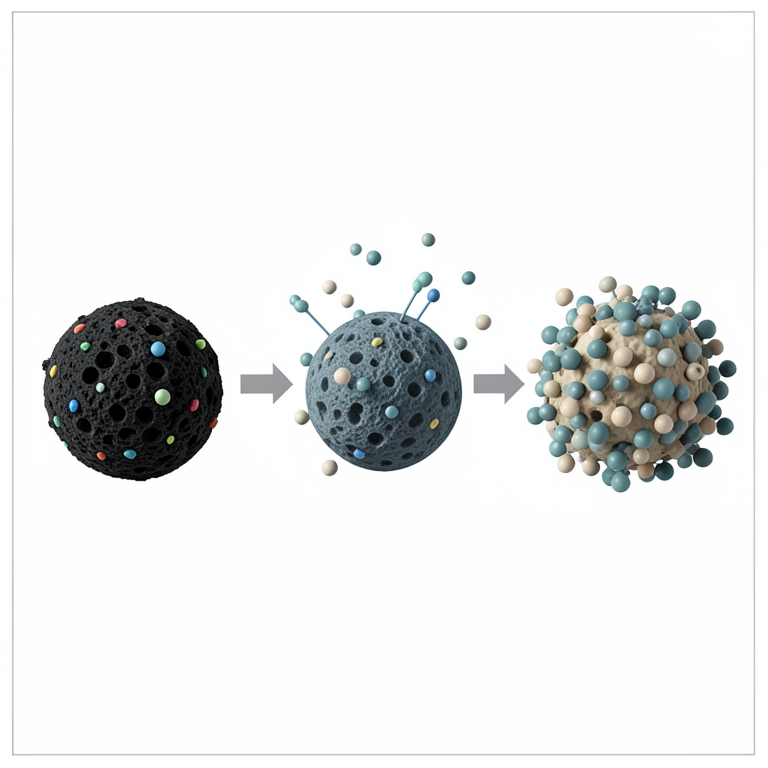
Factors Affecting Adsorption Efficiency
AI-generated conceptual illustration (nanoscale activated carbon particles and pesticide molecules). It explains the idea and does not show study data.
View source evidence ↗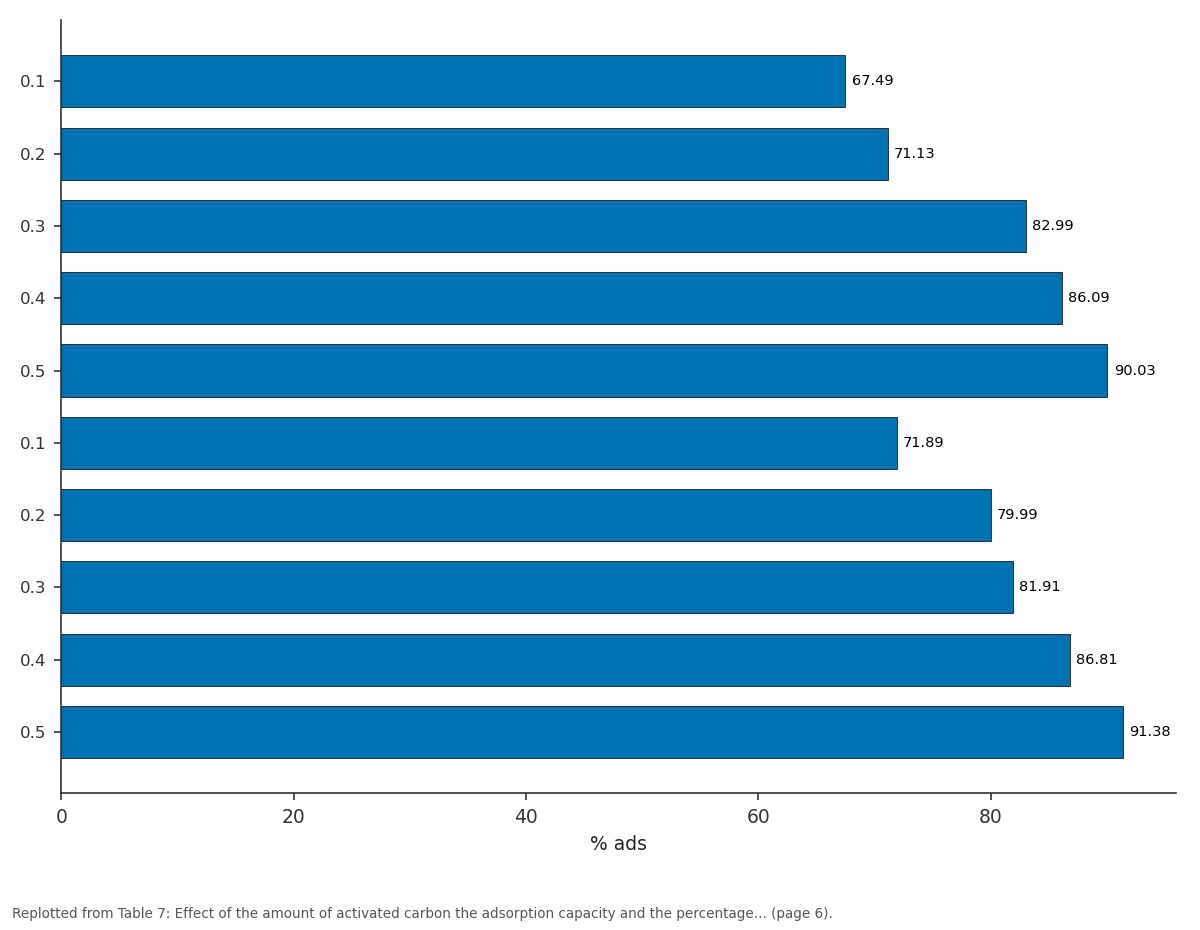
% ads: 0.1 vs 0.2 vs 0.3 vs 0.4 vs 0.5
Replotted from Table 7 (page 6) of the original paper. Every bar is the paper's own table value.
View source evidence ↗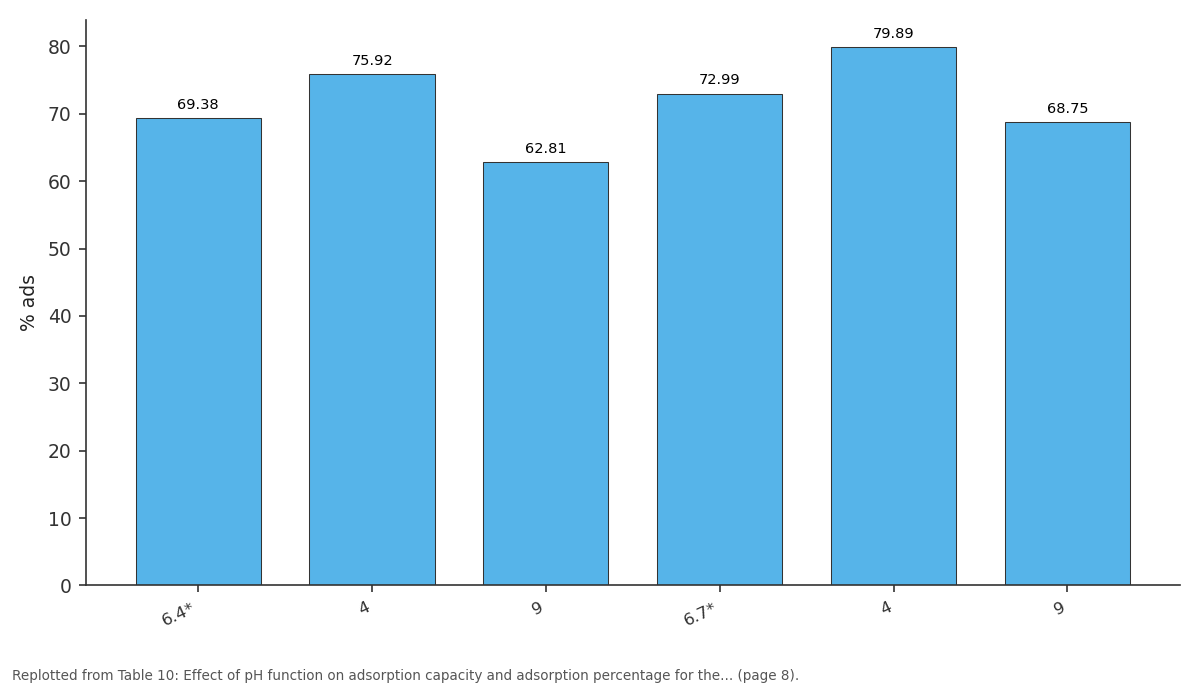
% ads: 6.4* vs 4 vs 9 vs 6.7* vs 4
Replotted from Table 10 (page 8) of the original paper. Every bar is the paper's own table value.
View source evidence ↗Figures & tables
From the original paper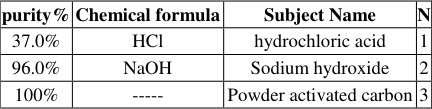 Table 1
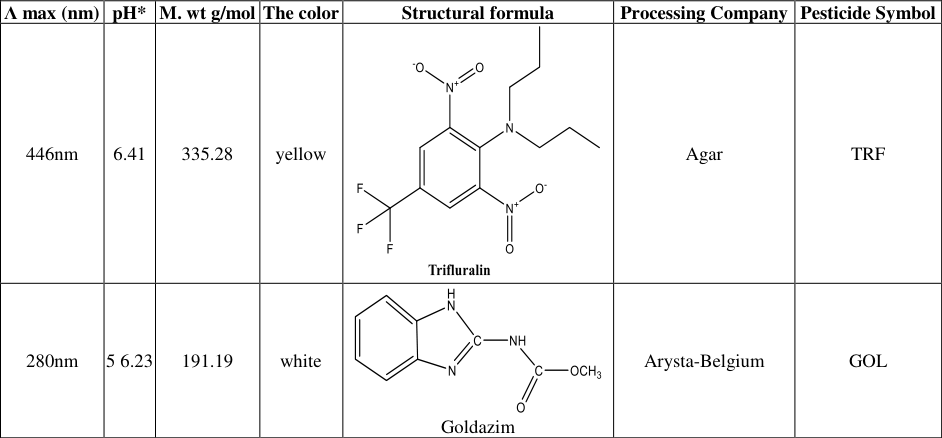 Table 2
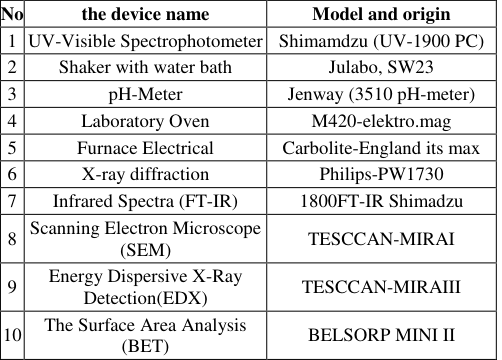 Table 3
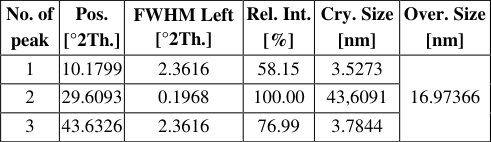 Table 4
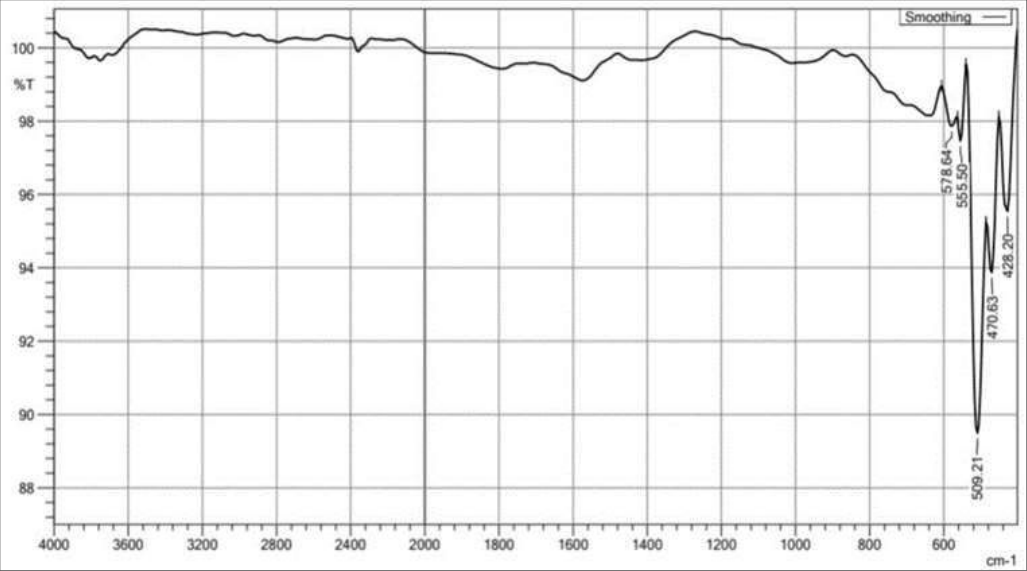 Figure 1
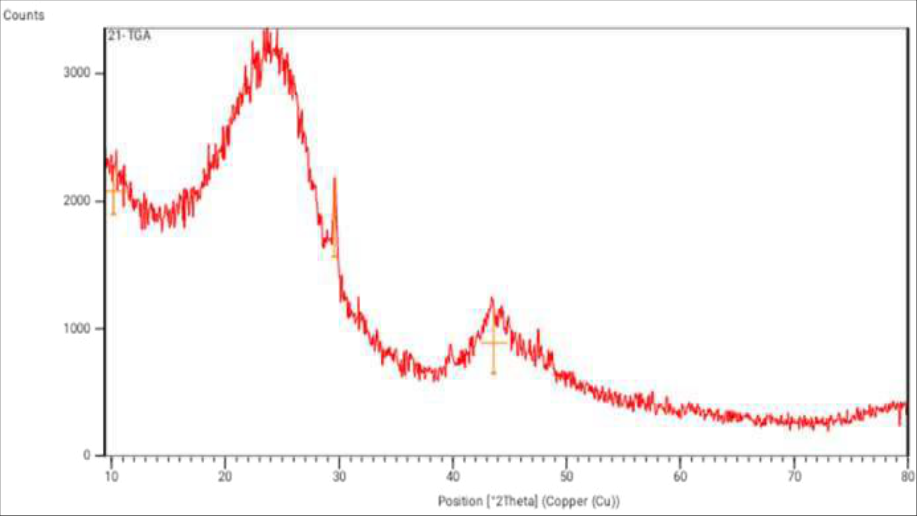 Figure 2
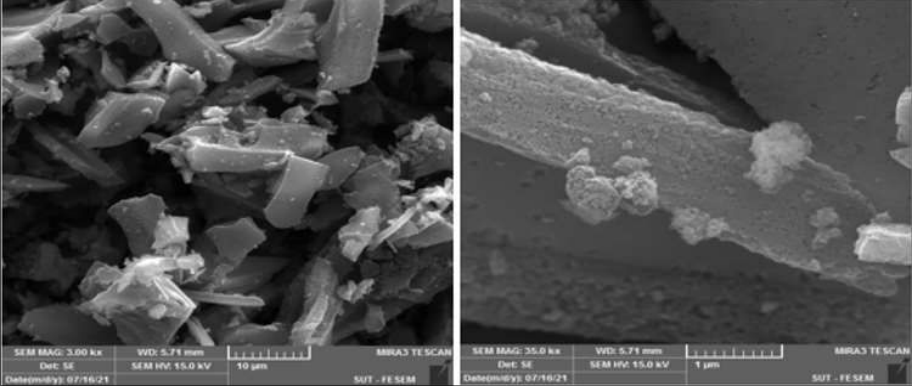 Figure 2
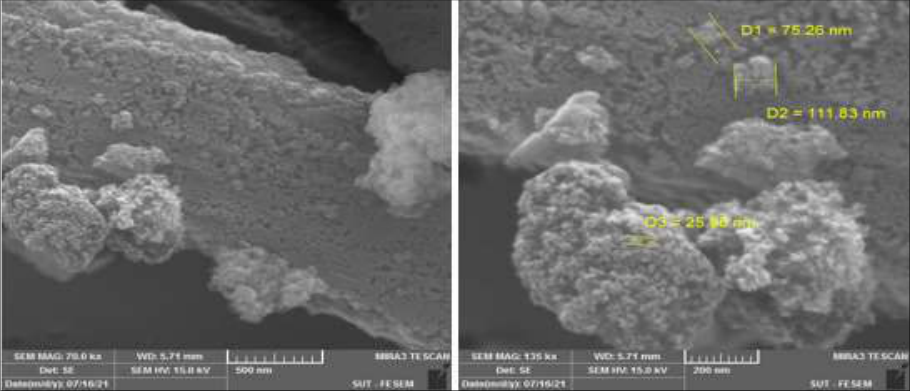 Figure 3
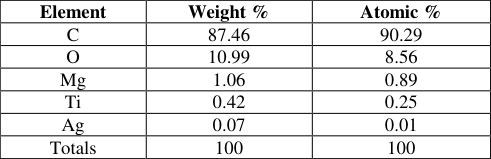 Table 5
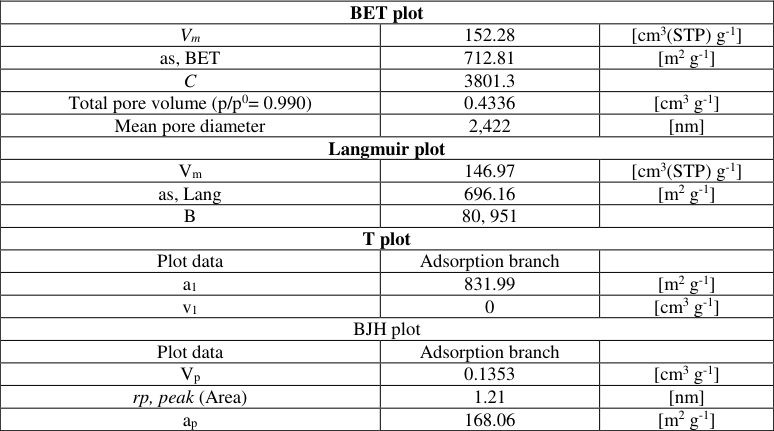 Table 6
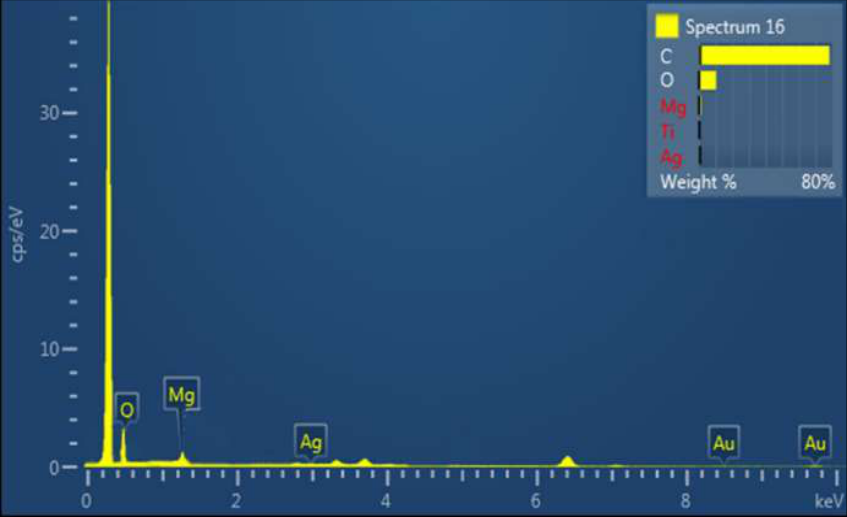 Figure 4
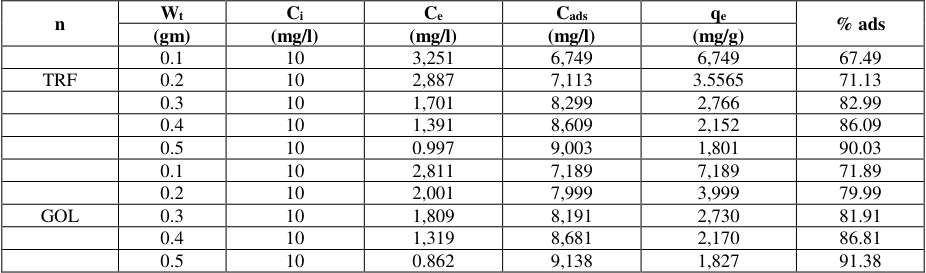 Table 7
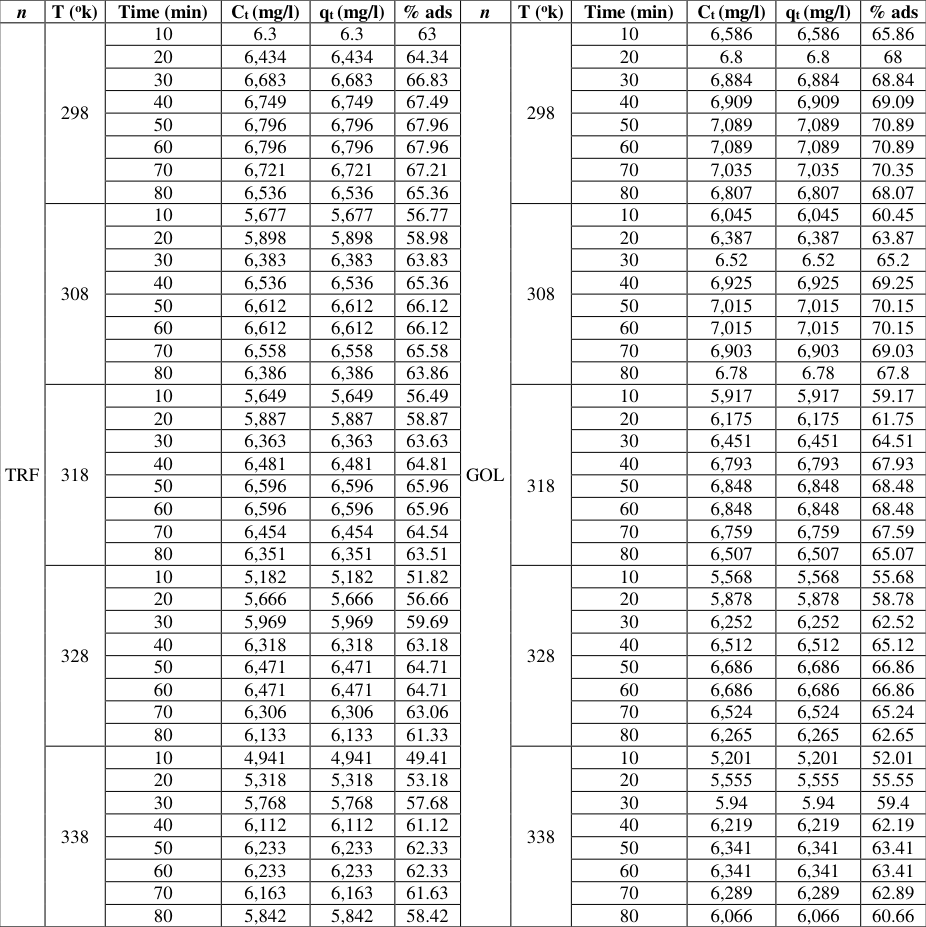 Table 8
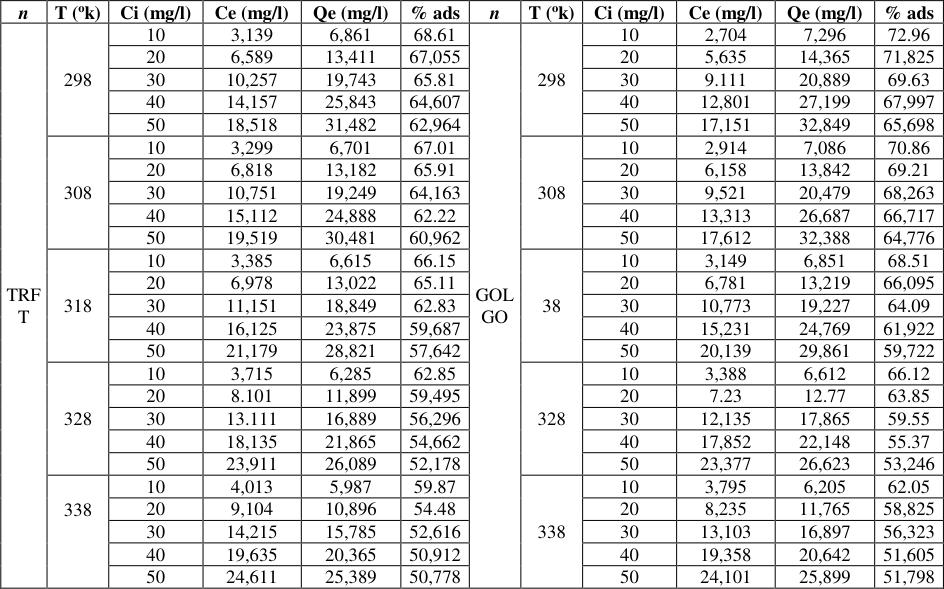 Table 9
 Table 10
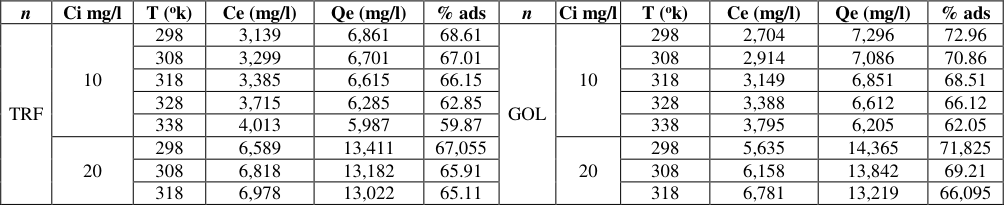 Table 11
Introduction
That pain pollution Chemical pesticides are a serious problem in the environment, as the use of pesticides has increased in recent decades, resulting in the flow of chemical pesticides into natural water sources, which negatively affects the life of living organisms [1] , and the impact of environmental pollution is not limited to humans only, but also to include animals and plants, as it leads, directly or indirectly, to happening Harm to humans, living organisms, or the environment in which living organisms exist [2] , and count pesticides It is one of the most dangerous chemical compounds that cause water pollution due to its wide use, which maintains its presence in aquatic environments for a long time, which helps its transmission and accumulation in the bodies of aquatic organisms to the extent that it poses a serious threat to human life [3,4] , and you know Pesticides are among the important chemical pollutants that have a direct impact on the environment, as they increase the production of agricultural crop, but at the same time have a side effect on human health, and the effect of pesticides on Human health is represented by genetic mutation and cancer, and it has a significant effect on inhibiting the activities of enzymes [5,6] , Despite its benefits, only they can be dangerous compounds. It has collateral damage to the ecosystem, the misuse of pesticides in terms of the recommended dose or the appropriateness of the pesticide.
For the purpose of control, or mishandling of pesticides leads to many risks, if any there are more than (220,000) deaths in the world annually due to improper handling of pesticides [7] , and for this reason there was a need for existence and development there are many ways to treat water pollutants whether membership of it or inorganic It is within this technique adsorption, is the adsorption of the most prominent and important Effective and safe techniques used in the removal and treatment of these pollutants, which are difficult to remove by other methods [8] , In addition, that adsorption is a simple technology with low economic costs compared to other treatment methods. For this reason, many researchers in this field resorted to developing different adsorbents and from between adsorbents common and used is the (activated carbon), and has the great development in the applications of the adsorption process prompted the need to provide new adsorbent materials to be used in the treatment of environmental pollution. On these materials should be efficient and have a low economic cost retrieve it then Reuse it again.
Practical part 2.1 The Chemicals
The following chemicals were used, which were prepared by the companies indicated opposite each one of them, without purification, because they have a high degree of purity, as shown in the 10) ml of hydrochloric acid concentration of (0.1) M to remove the remaining ions Al-basic. Repeat process the wash with water Free of ions several times to purify it of residue Effects our. 5. Use the device (pH-Meter) to ensure the neutrality of the acidity of the carbon. 6. Dry activated charcoal record for a duration4degree hours (120 ºC). 7. Grinding the activated charcoal resulting from the previous step by means of a mechanical mill to obtain fine particles, then it was sifted by molecular sieves with a size of (35 micron) It was kept inside a sealed package and in a desiccator, isolated from air and moisture [9] .
Results and Discussions 3.1 Topography Characterization:
For the purpose of topographic diagnosis (Topography) of the surface of activated charcoal using infrared spectroscopy (FT-IR), X-ray diffraction (XRD) and scanning electron microscopy (SEM) as well as surface area analysis (BET) as follows.
FT-IR spectroscopy:
Infrared spectrum (FT-IR) for activated charcoal-commercial, in order to see if activated charcoal contains, effective aggregates (Effective groups) or not, and Figure 1 represents the infrared spectra of commercial activated charcoal, Evidenced by the shape of the infrared spectrum (FT-IR) of commercial activated carbon indicates that activated carbon does not contain any active group effective groups may affect the adsorption process of the materials under study, and thus we conclude that activated carbon is (chemically inert)and this is a good characteristic.
Fig 1:
(FT-IR) for nan-activated carbon.
X-ray diffraction (XRD):
The surface of the adsorbent material under study was identified using an X-ray diffraction machine (XRD) to find out the crystal form of the prepared Nanoparticles through Miller coefficients, as the purity of the prepared coal is identified. Active As well as calculating the size of Nanoparticles using the Debye-Scherrer equation (Debye Scherer Equation) (10).
As if, D = Particle size in Nanometers. K = Debye constant and equal to (0.94). λ = The wavelength of the x-ray and is within limits (1.5406) angstrom for the element copper, and it is converted into a unit of nm, as each (1 angstrom = 10 -1 nm), so the wavelength is equal to (0.15406) nm.
𝛽= total width at the largest half of the apex (Full Width at Half Maximum) (FWHM), measured in degrees (Deg) and converted to radian units, as the (FWHM) value is multiplied by the amount 4 shows the data values obtained from the X-ray diffraction spectra of the three strongest beams, which were used to calculate the average crystal size of the activated charcoal sample record commercial which was found to be equal (16.973) nm, which confirms that the prepared charcoal contains Nanoparticles. (SEM) Noticeable variation in the size of adsorbent particles, as well as variation in pore size and craters appearing on the surface of the adsorbent, which is a feature of the prepared Nanocarbon. The size of these pores and craters and their density on the surface plays a major role in providing surface area. Possible contact with the substance to be adsorbed, as the scanning electron microscope measurements showed the shape and size of the prepared Nanoparticles of charcoal with different Nano and micro magnifications (10, 1, 500, 200) that they are in the form of sticky Nanoparticles or semi-square in shape and with It is an analytical technique used, to (Element analysis) to know the Chemical Composition, of the materials under study, studying the interference between, the source of excitation of (X-ray) and the sample, based on the basic principle, that each element has, a distinctive or unique atomic composition that gives (X-ray), which describes, the atomic composition of the elements to be uniquely identified from, each other [11] . These were used Figure 4 and Table 5 show that the highest percentage of activated charcoal is carbon (87.46%), followed by oxygen (10.99%), and this result confirms the efficiency of charcoal. The activator, especially because it contains a high percentage of carbon.
| Element | Weight % | Atomic % |
|---|---|---|
| C | 87.46 | 90.29 |
| O | 10.99 | 8.56 |
| Mg | 1.06 | 0.89 |
| Ti | 0.42 | 0.25 |
| Ag | 0.07 | 0.01 |
| Totals | 100 | 100 |
Table text extracted from the original PDF; superscript letters are shown inline. The original table image is below.
View original table image
Determination of Surface Area (BET):
The measurements were made and the required functions or factors were extracted using several methods, namely [12] : (BET method, Langmuir method, t-method, BHJ method) The aim of this study is to know the surface area of the charcoal prepared by activating it with plant materials, and after selecting the experimental activation of the system, Activated charcoal was obtained with a surface area according to (BET) theory of (712.81 m 2 /g) and as shown in the Table 6, which is very suitable for use as an adsorbent, as well as calculating the surface area of the prepared charcoal according to the theory (Langmuir), and it was found to be equal to (696.16 m 2 /g), and as we notice in Table 6 below. This result can be explained by the increase of the amount of the adsorbent material, the number of eligible sites for adsorption increases, and this increase increases the adsorption efficiency for the ease of adsorption between the particles of the adsorbent and the active sites on the surface of activated carbon, but this causes a decrease in the adsorption capacity, as this An increase in the amount of adsorbent will leave empty active adsorption sites when a fixed concentration of material is used [13] It was found that the weight of (0.1) gm of prepared activated carbon per (100)ml of the solution suffices to conduct subsequent studies, and that because it is an appropriate amount that achieves an acceptable rate of removal of the pesticides and elements under study while maintaining the color and achieving a state of equilibrium for the adsorption system. This amount of activated carbon has been adopted in subsequent studies.
| BET plot | — | — |
|---|---|---|
| Vm | 152.28 | [cm3(STP) g-1] |
| as, BET | 712.81 | [m2 g-1] |
| C | 3801.3 | |
| Total pore volume (p/p0= 0.990) | 0.4336 | [cm3 g-1] |
| Mean pore diameter | 2,422 | [nm] |
| Langmuir plot | ||
| Vm | 146.97 | [cm3(STP) g-1] |
| as, Lang | 696.16 | [m2 g-1] |
| B | 80, 951 | |
| T plot | ||
| Plot data | Adsorption branch | |
| a1 | 831.99 | [m2 g-1] |
| v1 | 0 | [cm3 g-1] |
| BJH plot | ||
| Plot data | Adsorption branch | |
| Vp | 0.1353 | [cm3 g-1] |
| rp, peak (Area) | 1.21 | [nm] |
| ap | 168.06 | [m2 g-1] |
Table text extracted from the original PDF; superscript letters are shown inline. The original table image is below.
View original table image
Effect of Contact Time:
The effect of contact time is one of the important tests in the study, of the adsorption process, through which the nature of the studied system is determined in any adsorption process, as well as determining the extent of the affinity of the materials to be removed from the contaminated solutions to the adsorbent surface, which is used in the completion of kinetic studies of the adsorption process In addition, the change of adsorption velocity with time and until reaching the equilibrium state is considered essential for the study of adsorption kinetics. The effect of time was calculated at a fixed concentration (10ppm) and at the normal (pHNatural) and by using a fixed amount of activated carbon (0.1) g/l and a shaking speed of (90) revolutions/minute and during periods of time (10-80)min. The obtained results are included in Table 8. The obtained results are shown in Table 8 that the adsorption process is very fast in the first minutes and then begins to slow down gradually until the adsorption reaches equilibrium, The adsorption process after the occurrence of equilibrium remains almost constant [14] and the adsorption process reaches a speed in which the particles of the adsorbent are attached to the adsorbent surface equal. The rate of emission of other molecules from the adsorbent surface into the solution is the so-called-(condition equanimity), and it was found pesticides under study It reach equilibrium over time between (50-60) min, the time has been selected (60) accurate for the completion of subsequent studies after the state of equilibrium, decrease in the efficiency and capacity of adsorption was observed, due to the occurrence of the adsorption process [1,15] .
| n | T (ok) | Time (min) | Ct (mg/l) | qt (mg/l) | % ads | n | T (ok) | Time (min) | Ct (mg/l) | qt (mg/l) | % ads |
|---|---|---|---|---|---|---|---|---|---|---|---|
| TRF | 298 | 10 | 6.3 | 6.3 | 63 | GOL | 298 | 10 | 6,586 | 6,586 | 65.86 |
| 20 | 6,434 | 6,434 | 64.34 | 20 | 6.8 | 6.8 | 68 | ||||
| 30 | 6,683 | 6,683 | 66.83 | 30 | 6,884 | 6,884 | 68.84 | ||||
| 40 | 6,749 | 6,749 | 67.49 | 40 | 6,909 | 6,909 | 69.09 | ||||
| 50 | 6,796 | 6,796 | 67.96 | 50 | 7,089 | 7,089 | 70.89 | ||||
| 60 | 6,796 | 6,796 | 67.96 | 60 | 7,089 | 7,089 | 70.89 | ||||
| 70 | 6,721 | 6,721 | 67.21 | 70 | 7,035 | 7,035 | 70.35 | ||||
| 80 | 6,536 | 6,536 | 65.36 | 80 | 6,807 | 6,807 | 68.07 | ||||
| 308 | 10 | 5,677 | 5,677 | 56.77 | 308 | 10 | 6,045 | 6,045 | 60.45 | ||
| 20 | 5,898 | 5,898 | 58.98 | 20 | 6,387 | 6,387 | 63.87 | ||||
| 30 | 6,383 | 6,383 | 63.83 | 30 | 6.52 | 6.52 | 65.2 | ||||
| 40 | 6,536 | 6,536 | 65.36 | 40 | 6,925 | 6,925 | 69.25 | ||||
| 50 | 6,612 | 6,612 | 66.12 | 50 | 7,015 | 7,015 | 70.15 | ||||
| 60 | 6,612 | 6,612 | 66.12 | 60 | 7,015 | 7,015 | 70.15 | ||||
| 70 | 6,558 | 6,558 | 65.58 | 70 | 6,903 | 6,903 | 69.03 | ||||
| 80 | 6,386 | 6,386 | 63.86 | 80 | 6.78 | 6.78 | 67.8 | ||||
| 318 | 10 | 5,649 | 5,649 | 56.49 | 318 | 10 | 5,917 | 5,917 | 59.17 | ||
| 20 | 5,887 | 5,887 | 58.87 | 20 | 6,175 | 6,175 | 61.75 | ||||
| 30 | 6,363 | 6,363 | 63.63 | 30 | 6,451 | 6,451 | 64.51 | ||||
| 40 | 6,481 | 6,481 | 64.81 | 40 | 6,793 | 6,793 | 67.93 | ||||
| 50 | 6,596 | 6,596 | 65.96 | 50 | 6,848 | 6,848 | 68.48 | ||||
| 60 | 6,596 | 6,596 | 65.96 | 60 | 6,848 | 6,848 | 68.48 | ||||
| 70 | 6,454 | 6,454 | 64.54 | 70 | 6,759 | 6,759 | 67.59 | ||||
| 80 | 6,351 | 6,351 | 63.51 | 80 | 6,507 | 6,507 | 65.07 | ||||
| 328 | 10 | 5,182 | 5,182 | 51.82 | 328 | 10 | 5,568 | 5,568 | 55.68 | ||
| 20 | 5,666 | 5,666 | 56.66 | 20 | 5,878 | 5,878 | 58.78 | ||||
| 30 | 5,969 | 5,969 | 59.69 | 30 | 6,252 | 6,252 | 62.52 | ||||
| 40 | 6,318 | 6,318 | 63.18 | 40 | 6,512 | 6,512 | 65.12 | ||||
| 50 | 6,471 | 6,471 | 64.71 | 50 | 6,686 | 6,686 | 66.86 | ||||
| 60 | 6,471 | 6,471 | 64.71 | 60 | 6,686 | 6,686 | 66.86 | ||||
| 70 | 6,306 | 6,306 | 63.06 | 70 | 6,524 | 6,524 | 65.24 | ||||
| 80 | 6,133 | 6,133 | 61.33 | 80 | 6,265 | 6,265 | 62.65 | ||||
| 338 | 10 | 4,941 | 4,941 | 49.41 | 338 | 10 | 5,201 | 5,201 | 52.01 | ||
| 20 | 5,318 | 5,318 | 53.18 | 20 | 5,555 | 5,555 | 55.55 | ||||
| 30 | 5,768 | 5,768 | 57.68 | 30 | 5.94 | 5.94 | 59.4 | ||||
| 40 | 6,112 | 6,112 | 61.12 | 40 | 6,219 | 6,219 | 62.19 | ||||
| 50 | 6,233 | 6,233 | 62.33 | 50 | 6,341 | 6,341 | 63.41 | ||||
| 60 | 6,233 | 6,233 | 62.33 | 60 | 6,341 | 6,341 | 63.41 | ||||
| 70 | 6,163 | 6,163 | 61.63 | 70 | 6,289 | 6,289 | 62.89 | ||||
| 80 | 5,842 | 5,842 | 58.42 | 80 | 6,066 | 6,066 | 60.66 |
Table text extracted from the original PDF; superscript letters are shown inline. The original table image is below.
View original table image
Effect of Initial Concentration:
The effect of concentration, has been studied Bidet In a range of 10-50 ppm, and at different temperatures ranging from 298-338 K, after fixing all other variables affecting the adsorption process, at a constant speed (90 rpm) and using 0.1 g/l of prepared activated carbon for a period of 60 min, and at the natural pH function (pHNatural). The results obtained from this study are included in Table 9.
| n | T (ok) | Ci (mg/l) | Ce (mg/l) | Qe (mg/l) | % ads | n | T (ok) | Ci (mg/l) | Ce (mg/l) | Qe (mg/l) | % ads |
|---|---|---|---|---|---|---|---|---|---|---|---|
| TRF T | 298 | 10 | 3,139 | 6,861 | 68.61 | GOL GO | 298 | 10 | 2,704 | 7,296 | 72.96 |
| 20 | 6,589 | 13,411 | 67,055 | 20 | 5,635 | 14,365 | 71,825 | ||||
| 30 | 10,257 | 19,743 | 65.81 | 30 | 9.111 | 20,889 | 69.63 | ||||
| 40 | 14,157 | 25,843 | 64,607 | 40 | 12,801 | 27,199 | 67,997 | ||||
| 50 | 18,518 | 31,482 | 62,964 | 50 | 17,151 | 32,849 | 65,698 | ||||
| 308 | 10 | 3,299 | 6,701 | 67.01 | 308 | 10 | 2,914 | 7,086 | 70.86 | ||
| 20 | 6,818 | 13,182 | 65.91 | 20 | 6,158 | 13,842 | 69.21 | ||||
| 30 | 10,751 | 19,249 | 64,163 | 30 | 9,521 | 20,479 | 68,263 | ||||
| 40 | 15,112 | 24,888 | 62.22 | 40 | 13,313 | 26,687 | 66,717 | ||||
| 50 | 19,519 | 30,481 | 60,962 | 50 | 17,612 | 32,388 | 64,776 | ||||
| 318 | 10 | 3,385 | 6,615 | 66.15 | 38 | 10 | 3,149 | 6,851 | 68.51 | ||
| 20 | 6,978 | 13,022 | 65.11 | 20 | 6,781 | 13,219 | 66,095 | ||||
| 30 | 11,151 | 18,849 | 62.83 | 30 | 10,773 | 19,227 | 64.09 | ||||
| 40 | 16,125 | 23,875 | 59,687 | 40 | 15,231 | 24,769 | 61,922 | ||||
| 50 | 21,179 | 28,821 | 57,642 | 50 | 20,139 | 29,861 | 59,722 | ||||
| 328 | 10 | 3,715 | 6,285 | 62.85 | 328 | 10 | 3,388 | 6,612 | 66.12 | ||
| 20 | 8.101 | 11,899 | 59,495 | 20 | 7.23 | 12.77 | 63.85 | ||||
| 30 | 13.111 | 16,889 | 56,296 | 30 | 12,135 | 17,865 | 59.55 | ||||
| 40 | 18,135 | 21,865 | 54,662 | 40 | 17,852 | 22,148 | 55.37 | ||||
| 50 | 23,911 | 26,089 | 52,178 | 50 | 23,377 | 26,623 | 53,246 | ||||
| 338 | 10 | 4,013 | 5,987 | 59.87 | 338 | 10 | 3,795 | 6,205 | 62.05 | ||
| 20 | 9,104 | 10,896 | 54.48 | 20 | 8,235 | 11,765 | 58,825 | ||||
| 30 | 14,215 | 15,785 | 52,616 | 30 | 13,103 | 16,897 | 56,323 | ||||
| 40 | 19,635 | 20,365 | 50,912 | 40 | 19,358 | 20,642 | 51,605 | ||||
| 50 | 24,611 | 25,389 | 50,778 | 50 | 24,101 | 25,899 | 51,798 |
Table text extracted from the original PDF; superscript letters are shown inline. The original table image is below.
View original table image
The results obtained from this study indicate the following: The adsorption efficiency decreases with increasing concentration, but the adsorption capacity (qe) increases with increasing concentration and the reason for this can be attributed to that increasing the concentration facilitates the mass transfer process to the surface of the adsorbent material, thus increasing the adsorption capacity, and on the other hand, increasing the concentration increases the number of molecules available for adsorption when the effective sites on the surface of activated carbon are limited, This increase in the number of molecules caused by the increase in concentration leads to increased competition among them to bind to a fixed number of effective sites on a fixed amount of the adsorbent, and thus leads to a larger amount of the adsorbent being left behind in the solution, and thus the amount of the remaining substance in the solution is greater with As the concentration increases, the adsorption efficiency decreases [16] . 1. At a fixed concentration, the adsorption efficiency and capacity decrease with increasing temperature, and through our observations, in general, of high adsorption efficiency and capacity values at low concentrations and temperatures, we deduce that the study of the adsorption process is more efficient and sensitive at low temperatures, which represent normal environmental conditions, which gives us economic support for not having to provide industrial units for its completion, as well as its efficiency. Low concentrations make it more important, as most of the risks of pesticide contamination lie in low concentrations due to nondiscrimination and avoidance by the consumer. 2. If we want to compare the same adsorbent materials from where. The effect of concentration at different concentrations and at a temperature ranging between (298-338) absolute. We note that the capacity and adsorption efficiency increase as in the order following (GOL ˃ TRF)When trying to explain all of the above, we resort to the difference in the values of the pH function, as well as the difference in the molar mass of adsorbents and the structural difference of pesticides, especially the presence of effective aggregates in their composition, which affect through the inductive factor or interference with the adsorbent surface aggregates, despite the presence of fluorine and chlorine aggregates. (F -1 , CL -1 ) the large size of them and the presence of nitrogen atoms made them affect the adsorption capacities of the studied pesticides, and this is consistent with previous studies [1] .
Effect of pH:
The effect of the (pH-function) has been studied, especially that the capacity and efficiency of adsorption is greatly affected by the nature of the medium in which it is adsorbed, and for the purpose of determining the best acid function in which the materials under study are adsorbed, adsorption has been studied in three different media, the acidity function, including the natural acidity function (*pH) for each adsorbent, as well as at the acidity function (4 & 9), with all other conditions constant, including concentration and temperature (298) absolute, and the weight of the adsorbent (0.1) g. The obtained results are included in the Table below. When looking carefully at the results shown in Table 10, we notice that the adsorption process Chemical pesticides The surface adsorption of activated carbon in acidic media is higher than its adsorption in neutral media(normal function)This, in turn, is higher than adsorption in alkaline media. the effect of the acidity function on the adsorption efficiency, can be explained by the fact that the net charge on the surface of activated carbon in aqueous solutions is negative [17] , as well as the fact that pesticides contain aggregates that make them susceptible to being affected by the nature of the medium in which they are present (OH). and as a result lead to the formation of the peroxide ion that pushes the charge towards the aromatic ring, and leads to its spread over the entire molecule and thus the resulting negatively charged molecule will repel and move away from the surface of the prepared, activated carbon charged with the negative charge, based on the rule of similar charges repel and result in a decrease in the efficiency And adsorption capacity, on the other hand, the transformation of the hydroxyl group into the peroxide ion, generating a negative charge on the oxygen atom, increases the solubility of the molecule in the solvent and makes it more inclined towards molecular interactions and the formation of hydrogen bonds in the adsorption medium, thus weakening its adsorption efficiency, In the acidic medium, there will be an abundance of protons (the positive charge), so the phenol groups will turn into the positively charged phenoxonium ion based on the base of the different charges attracting, thus increasing the bond between the adsorbent and the adsorbent surface, thus increasing the adsorption and reducing the interference of the adsorbent with the solvent molecules [18,19] , the adsorption capacity and efficiency of pesticides is as high as possible in an acidic medium.
| N. | pH | Wt (gm) | Ci (mg/l) | Ce (mg/l) | Cads (mg/l) | Qe (mg/g) | % ads |
|---|---|---|---|---|---|---|---|
| TRF | 6.4* | 0.1 | 10 | 3,062 | 6,938 | 6,938 | 69.38 |
| 4 | 0.1 | 2,408 | 7,592 | 7,592 | 75.92 | ||
| 9 | 0.1 | 3,719 | 6,281 | 6,281 | 62.81 | ||
| GOL | 6.7* | 0.1 | 10 | 2,701 | 7,299 | 7,299 | 72.99 |
| 4 | 0.1 | 2,011 | 7,989 | 7,989 | 79.89 | ||
| 9 | 0.1 | 3,125 | 6,875 | 6,875 | 68.75 |
Table text extracted from the original PDF; superscript letters are shown inline. The original table image is below.
View original table image
Effect of temperature on adsorption:
A study of the effect of temperature, was conducted for the adsorption of the adsorbents under study on the surface of activated carbon, the obtained results were included in tables (11) and at the (pH Natural), shaking time (60) min, weight of activated carbon samples (0.1) gm, constant speed (90) cycle/min. The results contained in Table 11 can be discussed according to the following points In general, at a fixed concentration, we notice that increasing the temperature of the adsorption medium from (298-338) K leads to a decrease in the adsorption efficiency and adsorption capacity (qe) and regardless of the nature the material the adsorbent, as the increase in temperature leads to an increase in the process of returning particles of the adsorbed substance from the adsorbent surface to the solution (Desorption) [20] ; Because of the breaking of the forces that link the adsorbent and the adsorbent surface, and this indicates that the adsorption process is a heat-emitting process (Exothermic) [21] , which indicates the physical nature of adsorption in the studied system, and this statement applies exactly to Le Chalet's rule [14] , It has been observed that the temperature (298) Kelvin is the best temperature for adsorption, and this is confirmed by previous studies [1,22] . At a constant concentration and a constant temperature, we notice a difference in the efficiency and adsorption capacity of the materials under study. The reason for this may be due to the presence of some functional groups, their attachment sites and their number, as well as the nature of the steric form that pesticides take, the equanimity of the molecule, the nature of the succession of double bonds in it, the difference in their molecular weights, and the nature of the acid function [15] . Based on the foregoing, the conclusion that can be drawn from the study of the effect of concentration, pH function, and water temperature. Bidat it is that the adsorption of materials weakens with increasing temperature and the optimal conditions for the adsorption of pesticides require an acidic medium, which is the natural medium for the materials, and the temperature required to achieve a high rate of adsorption is within the limits of normal temperatures (25 °C), which gives great importance and economic support.
| n | Ci mg/l | T (ok) | Ce (mg/l) | Qe (mg/l) | % ads | n | Ci mg/l | T (ok) | Ce (mg/l) | Qe (mg/l) | % ads |
|---|---|---|---|---|---|---|---|---|---|---|---|
| TRF | 10 | 298 | 3,139 | 6,861 | 68.61 | GOL | 10 | 298 | 2,704 | 7,296 | 72.96 |
| 308 | 3,299 | 6,701 | 67.01 | 308 | 2,914 | 7,086 | 70.86 | ||||
| 318 | 3,385 | 6,615 | 66.15 | 318 | 3,149 | 6,851 | 68.51 | ||||
| 328 | 3,715 | 6,285 | 62.85 | 328 | 3,388 | 6,612 | 66.12 | ||||
| 338 | 4,013 | 5,987 | 59.87 | 338 | 3,795 | 6,205 | 62.05 | ||||
| 20 | 298 | 6,589 | 13,411 | 67,055 | 20 | 298 | 5,635 | 14,365 | 71,825 | ||
| 308 | 6,818 | 13,182 | 65.91 | 308 | 6,158 | 13,842 | 69.21 | ||||
| 318 | 6,978 | 13,022 | 65.11 | 318 | 6,781 | 13,219 | 66,095 |
Table text extracted from the original PDF; superscript letters are shown inline. The original table image is below.
View original table image
Conclusion
Chemical pesticides pose a significant environmental threat due to their persistence in natural water sources and adverse effects on living organisms. This study highlights the dangers of pesticide misuse, including water pollution and health hazards such as genetic mutations and cancer. To mitigate these risks, effective treatment methods like adsorption have been developed, with activated carbon proving to be a highly efficient and cost-effective adsorbent.
The findings emphasize the importance of optimizing adsorption conditions, including appropriate pH levels and temperatures, to maximize the removal of harmful pollutants, thereby safeguarding environmental and public health.
Figures and tables from the paper
| purity% | Chemical formula | Subject Name | N |
|---|---|---|---|
| 37.0% | HCl | hydrochloric acid | 1 |
| 96.0% | NaOH | Sodium hydroxide | 2 |
| 100% | ----- | Powder activated carbon | 3 |
Table text extracted from the original PDF; superscript letters are shown inline. The original table image is below.
View original table image
| Λ max (nm) | pH* | M. wt g/mol | The color | Structural formula | Processing Company | Pesticide Symbol |
|---|---|---|---|---|---|---|
| 446nm | 6.41 | 335.28 | yellow | Agar | TRF | |
| 280nm | 5 6.23 | 191.19 | white | Goldazim | Arysta-Belgium | GOL |
Table text extracted from the original PDF; superscript letters are shown inline. The original table image is below.
View original table image
| No | the device name | Model and origin |
|---|---|---|
| 1 | UV-Visible Spectrophotometer | Shimamdzu (UV-1900 PC) |
| 2 | Shaker with water bath | Julabo, SW23 |
| 3 | pH-Meter | Jenway (3510 pH-meter) |
| 4 | Laboratory Oven | M420-elektro.mag |
| 5 | Furnace Electrical | Carbolite-England its max |
| 6 | X-ray diffraction | Philips-PW1730 |
| 7 | Infrared Spectra (FT-IR) | 1800FT-IR Shimadzu |
| 8 | Scanning Electron Microscope (SEM) | TESCCAN-MIRAI |
| 9 | Energy Dispersive X-Ray Detection(EDX) | TESCCAN-MIRAIII |
| 10 | The Surface Area Analysis (BET) | BELSORP MINI II |
Table text extracted from the original PDF; superscript letters are shown inline. The original table image is below.
View original table image
| n | Wt | Ci | Ce | Cads | qe | % ads |
|---|---|---|---|---|---|---|
| (gm) | (mg/l) | (mg/l) | (mg/l) | (mg/g) | ||
| 0.1 | 10 | 3,251 | 6,749 | 6,749 | 67.49 | |
| TRF | 0.2 | 10 | 2,887 | 7,113 | 3.5565 | 71.13 |
| 0.3 | 10 | 1,701 | 8,299 | 2,766 | 82.99 | |
| 0.4 | 10 | 1,391 | 8,609 | 2,152 | 86.09 | |
| 0.5 | 10 | 0.997 | 9,003 | 1,801 | 90.03 | |
| 0.1 | 10 | 2,811 | 7,189 | 7,189 | 71.89 | |
| 0.2 | 10 | 2,001 | 7,999 | 3,999 | 79.99 | |
| GOL | 0.3 | 10 | 1,809 | 8,191 | 2,730 | 81.91 |
| 0.4 | 10 | 1,319 | 8,681 | 2,170 | 86.81 | |
| 0.5 | 10 | 0.862 | 9,138 | 1,827 | 91.38 |
Table text extracted from the original PDF; superscript letters are shown inline. The original table image is below.
View original table image
References
10 in the original paper- AL-Ani RR, Hussein FM. Degradation of chlorobenzadehyde on Bentonite, Kaolin, and Attapulgite surfaces. Iraqi National Journal of Chemistry. 2012;12(45):54-66.
- Cooper J, Dobson H. The benefits of pesticides to mankind and the environment. Crop Protection. 2007;26(9):1337-1348.
- Ustuner T, Sakran A, Almhemed K. Effect of herbicides on living organisms in the ecosystem and available alternative control methods. The International Journal of Scientific and Research Publication. 2020;10(8):622-632.
- Al-Dulaimy ZAH. Adsorption of bromo phenol red dye from aqueous solution by Iraqi bentonite clay. Ibn ALHaitham Journal for Pure and Applied Sciences. 2017 Jun 11;30(1):118-130.
- Mohammadyani D, Hosseini SA, Sadrnezhaad SK. Characterization of nickel oxide Nanoparticles synthesized via rapid microwave-assisted route. In International Journal of Modern Physics: Conference Series. 2012;5:270-276.
- Bulut Y, Gözübenli N, Aydın H. Equilibrium and kinetics studies for adsorption of direct blue 71 from aqueous solution by wheat shells. Journal of hazardous materials. 2007;144(1-2):300-306.
- Hesas RH, Niya AA, Daud WMAW, Sahu JN. Preparation and characterization of activated carbon from apple waste by microwave-assisted phosphoric acid activation: application in methylene blue adsorption. BioResources. 2013;8(2):2950-2966.
- AL-Memary KA, Al-Hyali EA, Toohi HT. Adsorption of new Azo dyes derived from 4-Aminoantipyrine from aqueous solution by a new type of activated carbon: equilibrium and kinetic studies. Research Journal of Pharmacy and Technology. 2019;12(3):1206-1218.
- Wu CH. Adsorption of reactive dye onto carbon Nanotubes: Equilibrium kinetics and thermodynamics. Journal of hazardous materials. 2007;144 (1-2):93-100.
- Losso JN, Ng C, Marshall WE, Rao RM. Freundlich adsorption isotherms of agricultural by-product-based powdered activated carbons in a geosmin-water system. Bio Resource Technology. 2002;85(2):131-135.
Cited by 7
From OpenAlex, OpenCitations and reference lists read by Scinovex
- Emerging techniques of soil remediation: Nanotechnology and bioremediation approaches: A review
Santosh Kumar Sah, Akash Gajanan Mhetre, Surabhi Kumari, Yabi Gadi, Mukesh Prajapat, Mohit Kashyap · International Journal of Advanced Biochemistry Research · 2025
Soil pollution is one of the critical issues that affects environmental health, agricultural productivity, and overall balance of an ecosystem. The contamination of soil with heavy metals, organic pollutants, and hazardous substances is a result of industrial discharge, agricultural practices, and urbanization. Traditional remediation techniques, such as excavation and chemical treatments, are effective but expensive and often cause secondary pollution. Emerging technologies include nanotechnology and bioremediation. These are very novel and promising, sustainable remediation alternatives that
- Activated carbon synthesis from palmyra seed shell via physical and chemical activation methods ↗
P Vijayakumary, Gitanjali Jothiprakash, R Parimala Devi, SA Ramjani, K. R. S. Chandrakumar, Desikan Ramesh · The Pharma Innovation · 2023
Activated carbon is generally used as absorbing and purifying agent due to its porous nature. Recently, agro-residues are considered as precursor for activated carbon production. Palmyra seed shell is one of the unexploited lignocellulosic feedstock and resource to produce multiple bioproducts for energy and environmental applications. Present study focused with the specific objective on activated carbon synthesis from palmyra seed
- Nano-pesticides: Emerging Opportunities for Sustainable Agriculture and Food Security
Kadambini Das, Arpana Katiyar, Ritika Kumari, Niti Kirai, Deepak Kumar, Poonam Kumari · International Journal of Agriculture and Nutrition · 2025
The excessive application of conventional pesticides has detrimental effects on soil health and the environment. Chemical remnants of these pesticides damage the soil environment by impacting nontargeted organisms and, with time, decreasing soil fertility. Thus, to effectively manage insect pests in agricultural fields without deterioration of the surrounding biota, nanotechnology has proven to be a significant substitute for conventional chemical pesticides. Compared with conventional pesticides, nanopesticides reduce and control excess agricultural inputs and maintain environmental balance i
- Nanotechnology in soil remediation: A new horizon
Ganesh MC, SK Nadaf · International Journal of Research in Agronomy · 2025
Soil contamination poses a critical threat to environmental quality, agricultural productivity, and human health worldwide. Traditional soil remediation techniques, while effective in some cases, often suffer from limitations such as high cost, time consumption, and incomplete pollutant removal. In recent years, nanotechnology has emerged as a transformative solution in environmental engineering, offering innovative strategies to address complex soil pollution challenges. This review explores the application of nanotechnology in soil remediation, highlighting the diverse range of nanomaterials
- Thermochemical pathways in the conversion of coconut shell charcoal to high-surface-area activated carbon ↗
Juma M Ochieng · International Journal of Research in Engineering · 2025
The conversion of coconut shell charcoal into high-surface-area activated carbon (AC) is a significant thermochemical process that enhances its adsorptive properties. The high carbon content of coconut shells makes them an ideal precursor for activated carbon production, which is widely used in environmental applications, including water purification, air filtration, and energy storage. This paper explores the thermochemical pathways involved in
- Green processing of natural products using steam-activated adsorbents derived from coconut shells ↗
Emily Harrison, S.D. Montgomery · Journal of Entomology and Zoology Studies · 2025
The increasing demand for sustainable and eco-friendly methods of natural product extraction has prompted research into green processing techniques that minimize environmental impact. One such method involves using steam-activated adsorbents derived from coconut shells for the extraction of bioactive compounds from natural products. This study explores the potential of steam activation to enhance the adsorption capacity of coconut shell-based adsorbents
- Advance in nitrobacteria attachment of GAC for water treatment by surface-modified GAC using transition metal and air
Seung-Jin Han, Cholmun Kim, Chang‐Yong Kim, Choljin Jang · International Journal of Geography Geology and Environment · 2025
When activated carbon (AC) is used in water treatment, it takes tens or even hundreds of days to have a biological function, which consumes a lot of power. To solve this problem, we used surface modified AC(SMAC) instead of AC is prepared by treating the surface with transition metal oxides in the precursor of AC, followed by vapor activation and oxidation with air. The experimental results showed that the microbial biomass attached to SMAC at 25 °C and 7 days of the nitrifying microbial culture was 3.53 times higher than AC (0.17× 10⁷ CFU/g).