
Research article · 2020 · Full text
International Journal of Agriculture and NutritionGenotype x environment interaction and stability in promising elite clones of yield potentiality in respect to cane and sugar yield
Volume 2(1) · Pages 57–60 · DOI: 10.33545/26646064.2020.v2.i1a.92 ↗
Research areasGenetics and Plant BreedingSugarcane Cultivation and ProcessingNatural Products and Biological Research
Abstract
Author-writtenThe present investigation was carried out to determine the relative performance of yield potential, stability and adaptability of promising sugarcane (Saccharum officinarum L.) varieties and identify promising once. Seven varieties were evaluated in randomized complete block design with three replications during spring season of 2015-16, 2016-17, 2017-18, 2018-19 & 2019-20 at Agricultural Research station, Ummedganj, Kota. The pooled analysis of variance showed highly significant (p < 0.01) differences for genotypes (G), environments (E) and G x E interaction. The mean cane & sugar yield (t/ha.), regression coefficient (bi) and deviation from regression (S2d) used to identify the stability and adaptability of popular varieties. Based on stability parameters and over all mean performance of cane & sugar yield, variety Co 0238 has high mean for both cane yield and sugar yield (83.05, 10.17) with bi =1.0 and non-significant s2d = 0, indicated that this varieties found better responsive to all the environments and were considered as stable varieties. Whereas the genotype Co 05009 produced high mean yield (79.64, 9.72), bi >1 with non significant s2d, indicated below average stability, such genotypes tend to respond favorably to better environments but give poor yield in unfavourable environments. Hence, these genotypes were suitable for favorable environments. Variety CoS 8436 having low mean ((73.83, 8.70) for cane & sugar yield, bi < 1 with non significant s2d value, indicated that genotype suitable for poor environment.
Summary
Source-checkedPlain-language reading of the full paper, prepared with AI and checked against the text. Each point links to the authors' own words.
Why it matters
- Sugarcane is a globally significant cash crop cultivated across tropical and subtropical regions. View evidence ↗
- In subtropical India, sugarcane growth is affected by wide climatic variations, including temperatures from 0 to 48 °C and humidity from 8 to 100%. View evidence ↗
- The performance of sugarcane varieties varies across different environments due to genotype x environment (G x E) interactions. View evidence ↗
The question
- The study aimed to evaluate the yield potential, stability, and adaptability of promising sugarcane varieties to identify superior ones. View evidence ↗
What they did
- The researchers tested seven released sugarcane varieties: CoJ 64, Co 0238, Co 05009, CoS 767, CoS 8436, Co Pant 97222, and Co 05011. View evidence ↗
- Genotype stability was analyzed using the Eberhart & Russell model, focusing on the mean, regression coefficient (bi), and deviation from regression (S2d). View evidence ↗
What they found
- Analysis of variance showed that genotype, environment, and their interaction (G x E) significantly affected both cane and sugar yields. View evidence ↗
- Variety Co 0238 achieved the highest average yields, with 83.05 t/ha for cane and 10.17 t/ha for sugar. View evidence ↗
- Variety CoS 8436 recorded the lowest average yields, with 73.83 t/ha for cane and 8.70 t/ha for sugar. View evidence ↗
- Co 0238 was identified as a stable variety because it had high mean yields, a regression coefficient (bi) of 1.0, and a non-significant deviation from regression (s2d = 0). View evidence ↗
- Co 05009 showed below-average stability (bi > 1), meaning it performs well in favorable environments but poorly in unfavorable ones. View evidence ↗
- CoS 8436 was found suitable for poor environments due to its low mean yields and a regression coefficient (bi) less than 1. View evidence ↗
What it means
- The authors conclude that identifying stable genotypes for cane and sugar yield is valuable for breeding high-yielding varieties adapted to this specific zone. View evidence ↗
Visual summary
3 visualsIllustrations explain the paper; charts are replotted from the paper's own table values.
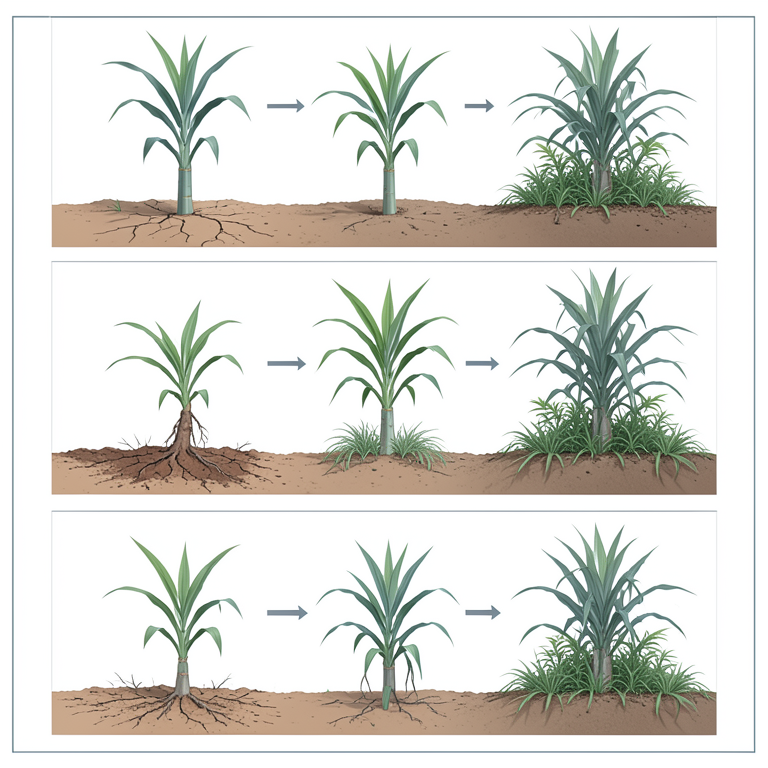
Stability Classification
AI-generated conceptual illustration (sugarcane plants). It explains the idea and does not show study data.
View source evidence ↗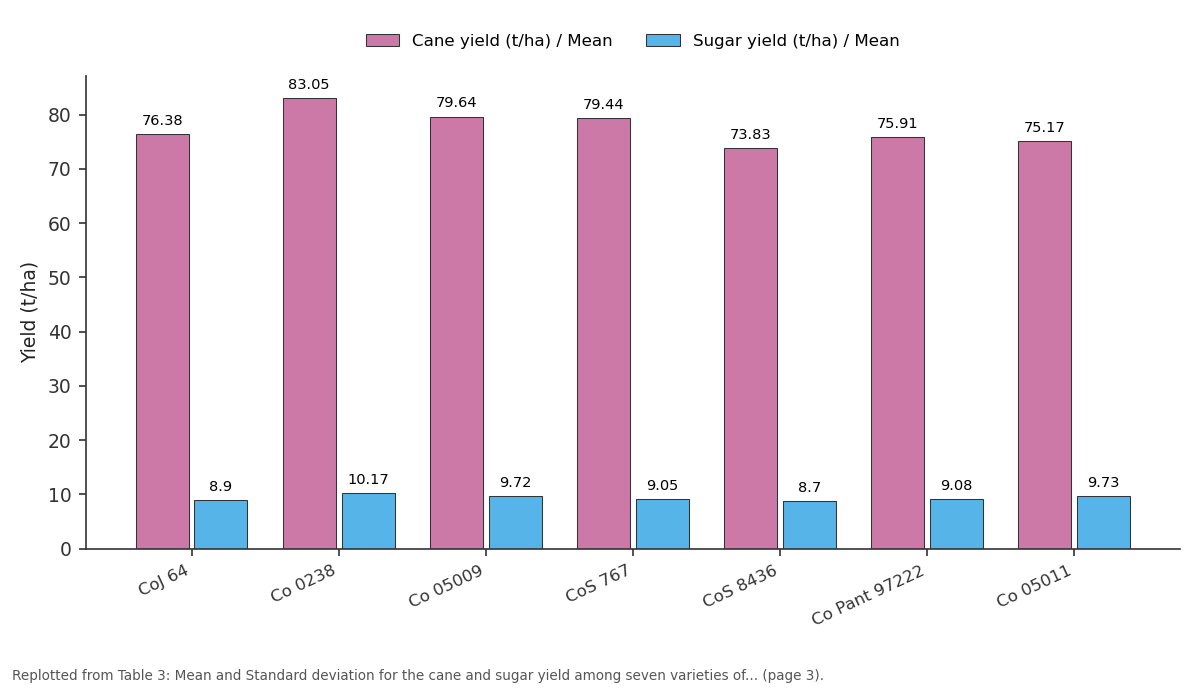
Cane yield (t/ha) / Mean and Sugar yield (t/ha) / Mean: CoJ 64 vs Co 0238 vs Co 05009 vs CoS 767 vs CoS 8436
Replotted from Table 3 (page 3) of the original paper. Every bar is the paper's own table value.
View source evidence ↗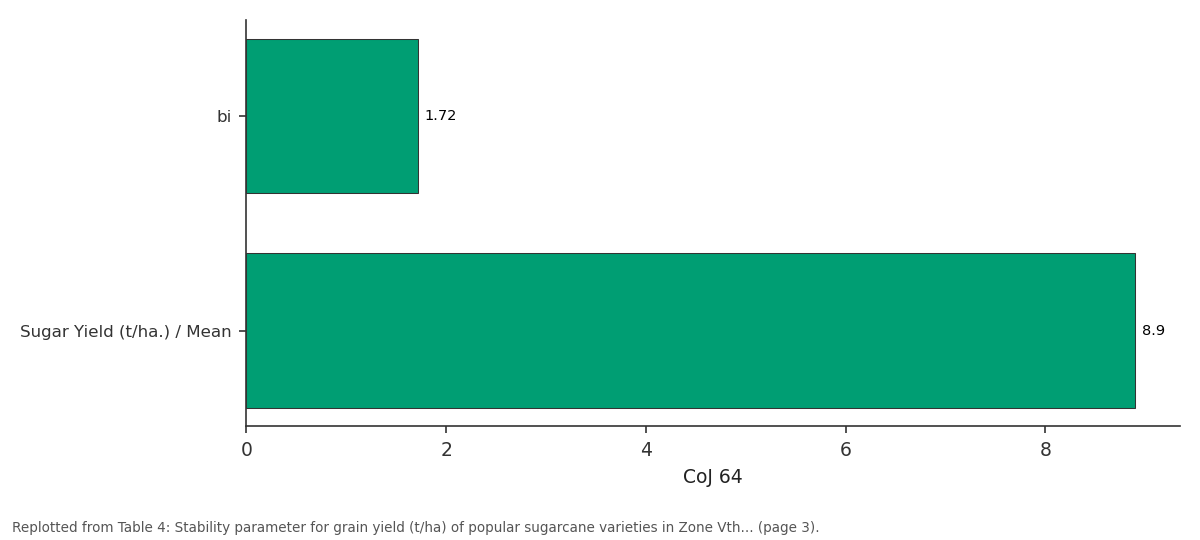
CoJ 64: bi vs Sugar Yield (t/ha.) /...
Replotted from Table 4 (page 3) of the original paper. Every bar is the paper's own table value.
View source evidence ↗Figures & tables
From the original paper Table 1
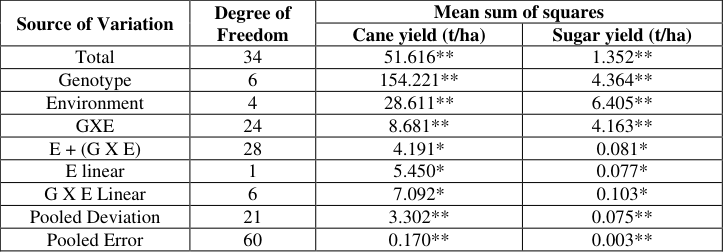 Table 2
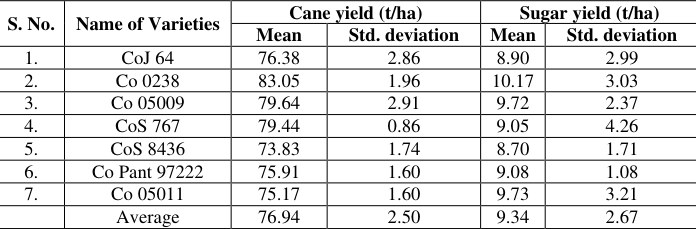 Table 3
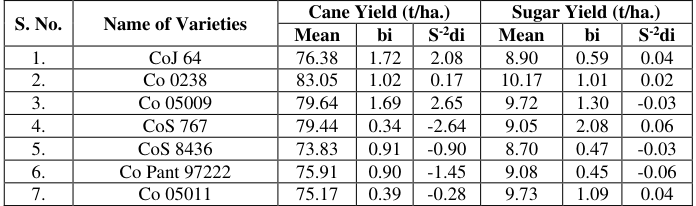 Table 4
Introduction
Sugarcane is one of the major cash crops grown extensively in all over the world from tropical to subtropical region. India is the second largest producer in the sugarcane next to Brazil (FAO Data base 2004). In subtropical India variation in climatic conditions are wide in the period of its growth and maturity, here temperature ranges from 0 to 48 o C, photoperiod ranges from 4 -8 hr and humidity 8 -100%. Climatic coefficient shifts a are variable factors during the crop growth period which affect the yield and other characters. Hence, the yield of sugarcane is generally low in the part of India. Sugarcane breeding is highly complex because of its highly heterozygous nature, combined with higher polyploidy (2n= 80 to 120) level. A commercial cane variety is selected on its stability to produce sucrose, its resistance to pest and diseases and its rationing ability. While other characteristics may not influence the selection procedure to any great extent, they may influence a grower's choice of variety. It is desirable to grow better varieties that produce more cane and higher sugar yield so that proper and effective varietal scheduling can be practiced to provide quality cane to factories during the crushing period. In any plant breeding programme, the genotypes x environment interactions are of major importance when testing of newly developed varieties. The relative performance of a variety differs due to the differences in genotype x environment interaction in different environments. Genotype by environment interactions is important source of variation in any crop and the term stability can be used to characterize a genotype, which show a relatively constant yield, independent of changing environmental conditions. On the basis of this idea, genotype with a minimal variance for yield across different environments is considered stable (Sabaghnia et al. 2006) [8] . The analysis of adaptability and stability are therefore extremely important and necessary for the identification and recommendation of superior genotypes in different environments. Therefore, it is necessary to evaluate any genotype for G x E interaction for yield & its attributes and identify stability for these traits in sugarcane. Cane yield and its component traits are highly affected by the environments. Techniques for G x E analysis based on linear regression can be informative when G x E interaction has high linear association with the environmental index but when the non linear component is also significant. (Finley and Wilkinson 1963 [2] , Eberhart and Russell (1966) [1] . The analysis based on Eberhart and Russell model being relatively simple and has been widely used for stability analysis. Regarding in stability parameters, sufficient information is not available in sugarcane which could be used in further breeding programme. Keeping above facts in view, the present investigation was under taken to focused on selection of high yielding varieties which are stable for cane and sugar yield.
Material and Methods
The present investigation was carried out with seven release varieties of sugarcane ( Rajasthan and recommended agronomic practices were followed during the entire cropping season to raise good crop. The stability of genotypes was estimated by using the method of Eberhart & Russell (1966) [1] . In this analysis sum of square due to G x E were portioned into individual genotype mean, regression of environmental mean (bi) and deviation from regression (S 2 d). The regression coefficient (bi) and mean square deviation from regression (S 2 d) were used to define genotype stability. The pooled error was used to test the hypothesis that the mean square deviation did not differ significantly from 0.05 and 0.01% probability levels. The t-test employing the standard error of regression coefficient against the hypothesis that it did not differ from 1.0. It was assumed that genotype effects were fixed and the year effects were random. The data on cane and sugar yield were recorded on plot basis and estimated in t/ha. The stability parameters were calculated by Eberhart & Russell's (1966) [1] joint regression model
Where Yij = is the mean of the i th variety at the j th environment, µ I = is the mean of the j th variety over all environments, β i = is the regression coefficient that measures the response of the j th variety to varying environments, I j = is the environmental index obtained as the mean of all varieties at the j th environment minus the grand mean and δ ij = is the deviation from regression of the i th variety at the j th environment.
The stability parameters, regression coefficient and mean square deviation were estimated as described below.
The regression coefficient (β i ): bi = Where, ∑ jYij Ij = is the sum of the product. ∑ j I 2 j = is the sum of squares
The mean square deviation (δ 2 d i ):
Where, = is the deviation from regression of the i th genotype at the j th environments s = number of location, t = number of varieties & e = estimate of pooled error and r = is the number of replications.
Environment Index (I j ) = Where ∑ jYij = is the total of all the varieties at j th locations.
Eberhart & Russell defined a stable genotype as the one which produced high mean yield with regression coefficient (bi) around unity and deviation from regression residual variance (S 2 d i ) near to zero. The estimate of deviations from regression suggests the degree of reliance that should be put to linear regression in interpretation of the data. If these values are significantly deviation from zero, the expected genotype cannot be predicted confidently or reliably. When deviations are not significant, the conclusion may be drawn by jointly considering the mean yield and regression values proposed by Finlay and Wilkinson (1963) [2] and Eberhart and Russell (1966) [1] that are summarized in table 1.
| Regression | Stability | Mean yield | Remarks |
|---|---|---|---|
| β i = 1 | Average | High | Well adapted to all environments or Desirable |
| β i = 1 | Average | Low | Poorly adapted to all environments |
| β i > 1 | Below average | High | Specifically adapted to favourable environments |
| β i < 1 | Above average | High | Specifically adapted to unfavourable environments |
Table text extracted from the original PDF; superscript letters are shown inline. The original table image is below.
View original table image
Results and Discussion
Pooled analysis of variance (Table -2) revealed that genotype, environment and genotype x environment interaction (G x E) were highly significant for both cane yield (t/ha) and sugar yield (t/ha). Significant mean squares due to genotype x environment interactions indicated differential response of genotypes in different environments. It means a particular variety may not exhibit the same phenotypic performance under different environments or different varieties may respond differently to a specific environment. Similar findings were earlier reported by Koli et al. 2016 [6] and Naidu et al. 2017 [7] in sugarcane. Both linear and non-linear components of G x E interactions were also found significant for cane and sugar yield showing the importance of both linear (predictable) and non-linear (unpredictable) components in the expression of the traits. The linear component was significant as against the nonlinear components (Pooled deviation), which revealed that a large portion of G x E interaction was accounted for by linear regression although pooled deviation was significant. These results were in confirmation to those reported by Kimbeng et al.
2009 [5] , Tiwari et al. 2011 [9] and Koli et al. 2016 [6] in sugarcane. [4] , Naidu et al. (2017) [7] and Guddadamath et al. (2014) [3] in sugarcane. The estimates of mean performance (x), regression coefficient (bi) and deviation from regression ((S 2 di) are presented in Table -4. Considering the stability of a genotype, the three parameters viz, grand mean over the environments (x), unit regression coefficient (bi=1) and squared deviation from the regression (S 2 di = 0) were considered stable in performance.
Eberhart and Russell (1966) [1] defined a stable genotype which showed high mean yield, regression coefficient (bi) around unity and deviation from regression near to zero. Accordingly, the mean and deviation from regression of each variety were considered for stability and linear regression was used for testing the varietal response. a. Genotypes with high mean, bi = 1 with non-significant s 2 d are suitable for general adaption, i.e. suitable over all environmental conditions and they are considered as stable genotype. b. Genotypes with high mean, bi >1 with non-significant s 2 d are considered as below average in stability. Such genotypes tend to respond favorably to better environments but give poor yield in unfavourable environments. Hence, they are suitable for favorable environments. c. Genotypes with low mean, bi<1 with non-significant s 2 d do not respond favorably to improved environmental conditions and hence, it could be regarded as specifically adapted to poor environments.
d. Genotypes with any bi value with significant s 2 d are unstable.
In the present study, promising variety Co 0238 has high mean for both cane yield and sugar yield (83.05, 10.17) with bi =1.0 and non-significant s 2 d = 0 (Table 4), indicated that this varieties found better responsive to all the environments and were considered as stable varieties.
| S. No. | Name of Varieties | Cane Yield (t/ha.) | — | — | Sugar Yield (t/ha.) | — | — |
|---|---|---|---|---|---|---|---|
| Mean | bi | S-2di | Mean | bi | S-2di | ||
| 1. | CoJ 64 | 76.38 | 1.72 | 2.08 | 8.90 | 0.59 | 0.04 |
| 2. | Co 0238 | 83.05 | 1.02 | 0.17 | 10.17 | 1.01 | 0.02 |
| 3. | Co 05009 | 79.64 | 1.69 | 2.65 | 9.72 | 1.30 | -0.03 |
| 4. | CoS 767 | 79.44 | 0.34 | -2.64 | 9.05 | 2.08 | 0.06 |
| 5. | CoS 8436 | 73.83 | 0.91 | -0.90 | 8.70 | 0.47 | -0.03 |
| 6. | Co Pant 97222 | 75.91 | 0.90 | -1.45 | 9.08 | 0.45 | -0.06 |
| 7. | Co 05011 | 75.17 | 0.39 | -0.28 | 9.73 | 1.09 | 0.04 |
Table text extracted from the original PDF; superscript letters are shown inline. The original table image is below.
View original table image
Acknowledgement
AcknowledgementThe first author is grateful thank to Director Research, Agriculture University, Kota, Zonal Director Research, ARS, Kota, and also grateful thanks to Project Coordinator, IISR, Lucknow, for providing necessary facilities and financial support to conduct the research work.
Figures and tables from the paper
| Source of Variation | Degree of Freedom | Mean sum of squares | — |
|---|---|---|---|
| Cane yield (t/ha) | Sugar yield (t/ha) | ||
| Total | 34 | 51.616** | 1.352** |
| Genotype | 6 | 154.221** | 4.364** |
| Environment | 4 | 28.611** | 6.405** |
| GXE | 24 | 8.681** | 4.163** |
| E + (G X E) | 28 | 4.191* | 0.081* |
| E linear | 1 | 5.450* | 0.077* |
| G X E Linear | 6 | 7.092* | 0.103* |
| Pooled Deviation | 21 | 3.302** | 0.075** |
| Pooled Error | 60 | 0.170** | 0.003** |
Table text extracted from the original PDF; superscript letters are shown inline. The original table image is below.
View original table image
| S. No. | Name of Varieties | Cane yield (t/ha) | — | Sugar yield (t/ha) | — |
|---|---|---|---|---|---|
| Mean | Std. deviation | Mean | Std. deviation | ||
| 1. | CoJ 64 | 76.38 | 2.86 | 8.90 | 2.99 |
| 2. | Co 0238 | 83.05 | 1.96 | 10.17 | 3.03 |
| 3. | Co 05009 | 79.64 | 2.91 | 9.72 | 2.37 |
| 4. | CoS 767 | 79.44 | 0.86 | 9.05 | 4.26 |
| 5. | CoS 8436 | 73.83 | 1.74 | 8.70 | 1.71 |
| 6. | Co Pant 97222 | 75.91 | 1.60 | 9.08 | 1.08 |
| 7. | Co 05011 | 75.17 | 1.60 | 9.73 | 3.21 |
| Average | 76.94 | 2.50 | 9.34 | 2.67 |
Table text extracted from the original PDF; superscript letters are shown inline. The original table image is below.
View original table image
References
9 in the original paper- Eberhart SA, Russell WL. Stability parameters for comparing varieties. Crop Sci. 1966;6:36-40.
- Finley KW, Wilkinson GE. The analysis of adaptation in a plant breeding programme. Australian journal of Agricultural Research. 1963;14:742-54.
- Guddaamath SG, Patel SB, Khadi BM. Stability and regression analysis in elite genotypes of sugarcane (S.spp. hybrid complex). African journal of Agriculture Research. 2014;9(37):2846-2853.
- Imtiaz AK, Nighat S, Raza S, Yasmine S, Sajida B. Environmental interaction of sugarcane genotype and yield stability analysis of sugarcane. Pak. Journal of Bot. 2013;45(5):1617-1622.
- Kimbeng CA, Zhoul MM, Silva JA. Genotype X environment interaction and resources allocation in sugarcane yield traits in the Rio-Grande valley region of Texas. Journal of American Society of Sugarcane technologist. 2009;29:11-24.
- Koli NR, Bagri RK, Meena BS, Kumhar BL. Studies on stability parameter and sustainability index for selecting stable genotypes of sugarcane (Saccharum officinarum L.). Electronic journal of Plant Breeding. 2016;18(1):137-139.
- Naidu PN, Khan MGM, Jokhan AD. Assessment of sugarcane varieties for their stability and yield potential in Fiji. The South Pacific Journal of Natural and Applied Sciences. 2017;35(2):20-32.
- Sabaghnia N, Dehghani H, Sabaghpour SH. Non parametric methods for interpreting genotype x environment interaction of lentil genotypes. Crop sci. 2006;46:1100-1106.
- Tiwari DK, Panday P, Singh RK, Singh SP, Singh SB. Genotype x environment interaction and stability analysis in elite clones of sugancane (S. officinarum L.). International Journal of Plant Breeding & Genetics. 2011;5(1):93-98.
Cited by 7
From OpenAlex, OpenCitations and reference lists read by Scinovex
- Avifaunal diversity of sugarcane research station, Sirugamani, Tiruchirappalli, Tamil Nadu ↗
M Mathialagan, M Ajithkumar Rajan, R Meena, V Manimozhi Selvi, Selvam Mohan, N Tamilselvan · Journal of Entomology and Zoology Studies · 2022
A total of 34 species of birds belonging to 26 families and 12 orders has been recorded in the survey carried out from January 2021 to March 2021. The maximum number of birds was observed of the Passeriformes order (13 species) followed by Coraciiformes, Charadriiformes, Cuculiformes (3 species) and Piciformes, Galliformes, Ciconiiformes, Strigiformes (2 species). All the birds recorded in
- Development and evaluation of energy bar incorporated with different varieties of watermelon seeds ↗
V. Bushaira · International Journal of Home Science · 2023
The present study entitled ‘Development and evaluation of energy bar incorporated with different varieties of watermelon seeds’ was undertaken with the aim to develop an energy bar using selected cereals, and its variation with the incorporation of different varieties of watermelon seeds. Seeds of two varieties of watermelons (Sugar Lady Watermelon and Crimson Sweet Watermelon) were used to incorporate into…
❝ 1PDF - Chemical composition of different accessions of jackfruit ↗
Md. Inshad Ibne Amin, Rony Ahamad, Abdur Rahim · Journal of Research in Chemistry · 2022
An analysis into the chemical characteristics of eleven jackfruit accessions at harvesting time was conducted. The chemical composition of eleven accessions were explored. It was held at the Bangladesh Agricultural University's Graduate Program Center (BAU-GPC) in Mymensingh from March to December. Moisture, dry matter, TSS, pH, titrable acidity, Ascorbic acid, reducing sugar, non-reducing sugar and total sugar contents differed significantly…
❝ 1PDF - Performance evaluation of tractor operated two row forward reverse rotavator for sugarcane crop
Khurdal JK, Bastewad TB, Phalphale KB, Pawase PP, Nalawade SM, Bhangare SC · International Journal of Research in Agronomy · 2024
India is the world's second - largest producer of sugarcane after Brazil, contributing 19.98% to global production, making sugarcane an important cash crop in the country. Although machinery for the sugarcane crop has been produced, it has not been widely used as it could have been. There is a large mechanization deficit as a result, particularly in the areas of sugarcane intercultural, planting, harvesting, and ratooning. Numerous intercultural procedures are necessary for sugarcane to control weeds, earth up, save moisture, and create a better environment for plant growth in general. In ligh
- A kinetic review of catalytic oxidation of sugar and sugar alcohols ↗
Swarn Lata Bansal · International Journal of Chemical and Biological Sciences · 2023
Catalytic oxidation kinetics of sugar and sugar alcohols with different oxidants has been given a great deal of attention in past years. In continuation of our earlier work, we report here in the Catalytic oxidation kinetics of sugar and sugar alcohols with different oxidants in acidic medium. It has been utilized as effective oxidant for the oxidation of various functional
- Problems and remedial measures in context of partial adoption of sugarcane technology
Vijay Ambast, PK Jaiswal · International Journal of Agriculture Extension and Social Development · 2022
The present study was carried out in the Surguja district of Chhattisgarh state. Data were collected from 120 respondents as 60 beneficiary respondents and 60 non-beneficiary respondents of six selected villages. The results of the study indicate that the major problem of the beneficiary respondents was ‘high charges of transportation and poor facilities’ and ‘misconception about the application of manures’ was a very serious problem in non-beneficiary respondents. Whereas sugarcane damaged by non-insect pests viz. rats, beer, elephants, and domestic cattle was the joint problem of both benefi
- Study of pre released sugarcane genotypes for agronomic traits and sugar yield ↗
Firdoz Shahana, Y Bharathi, T. Prabhakar Reddy, B. Joseph · Journal of Pharmacognosy and Phytochemistry · 2021
Study pertaining to agronomic evaluation of ten pre released sugarcane genotypes was conducted at RS&RRS, Rudrur, PJTSAU, Telangana state during rabi 2016-17.Genotypes 2009 R 74, 2010 R 854, 2011 R 274, 2011 R 24, 97 R 401, 2011 R 1, 2011 R 305, 2011 R 327, 2011 R 47, and 2010 R 175 were studied for yield attributes, cane yield