
Research article · 2022 · Full text
International Journal of Biology SciencesIsolate of lactic acid bacteria in shrimp Bacteriocin producing Bacteriocin from Karimun Jawa “candidate of the probiotic Consortion”
Volume 4(1) · Pages 192–204 · DOI: 10.33545/26649926.2022.v4.i1c.106 ↗
Research areasAquatic life and conservationFood and Agricultural SciencesProtein Hydrolysis and Bioactive Peptides
Abstract
Author-writtenShrimp is one of Indonesia's fishery export commodities, which has provided a large enough foreign exchange income for the country. Shrimp cultivation has decreased production due to several problems. The problems of shrimp farming include slow growth, damage to the pond environment, and the presence of infectious diseases. The solution to the problem currently being carried out is through the application of probiotics. This study aims to isolate and screen lactic acid bacteria that produce bacteriocins that have potential as probiotics. The study conducted a sampling of shrimp in Karium Java. Subsequently, shrimp gut LAB was isolated and bacteriocin activity was tested. research has succeeded in isolating lactic acid bacteria with bacteriocin-producing isolates k15 and k28 which were identified as Lactobacillus plantarum and Lactococcus garviae. isolates k15 and k28 had optimal growth in culture conditions using C source glucose 0.01%, ammonium nitrate 0.05%, media pH 8 and salinity 30 ppt.
Summary
Source-checkedPlain-language reading of the full paper, prepared with AI and checked against the text. Each point links to the authors' own words.
Why it matters
- Shrimp is a significant fishery export commodity for Indonesia, contributing substantially to the country's foreign exchange income. View evidence ↗
- Shrimp cultivation faces several challenges, including slow growth rates, environmental degradation of ponds, and infectious diseases. View evidence ↗
- The application of probiotics is currently used as a solution to address the problems associated with shrimp farming. View evidence ↗
The question
- The study aimed to isolate and screen bacteriocin-producing lactic acid bacteria (LAB) with potential for use as probiotics. View evidence ↗
What they did
- Lactic acid bacteria were isolated from the digestive tracts of shrimp using a dilution series-pourplate technique on MRS medium. View evidence ↗
- Bacteriocin activity was evaluated using the agar well diffusion method. View evidence ↗
- The pathogenicity of selected isolates was tested against shrimp larvae using a bathing method. View evidence ↗
What they found
- Of the LAB isolates tested, 56% exhibited bacteriocin activity, while 44% did not. View evidence ↗
- Isolate K.15 showed the highest bacteriocin activity against Vibrio harveyi, V. parahemolyticus, and V. vulnificus, while isolate K.28 was most effective against Vibrio alginolyticus. View evidence ↗
- Isolates K.15 and K.28 were found to be non-pathogenic, as they resulted in a 100% survival rate (SR) for shrimp larvae. View evidence ↗
- In fermenter cultures, isolate K.15 demonstrated higher bacteriocin activity compared to isolate K.28. View evidence ↗
- Molecular identification identified isolate K.15 as Lactobacillus plantarum and isolate K.28 as Lactococcus garviae. View evidence ↗
What it means
- The authors conclude that they successfully isolated bacteriocin-producing LAB (Lactobacillus plantarum and Lactococcus garviae) from shrimp. View evidence ↗
Visual summary
1 visualsIllustrations explain the paper; they do not show study data.
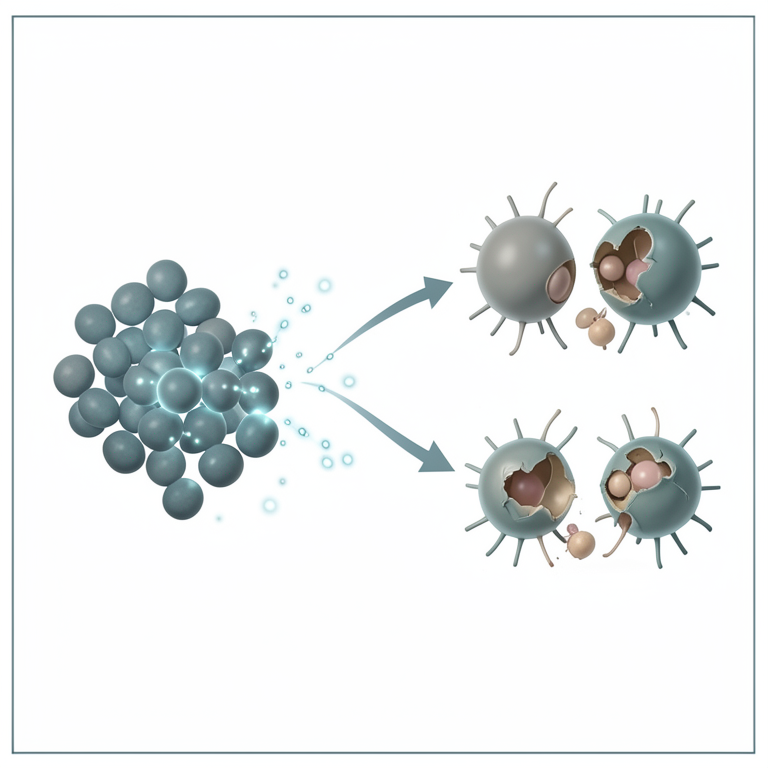
Bacteriocin Activity Spectrum
AI-generated conceptual illustration (Lactic acid bacteria and Vibrio bacteria). It explains the idea and does not show study data.
View source evidence ↗Figures & tables
From the original paper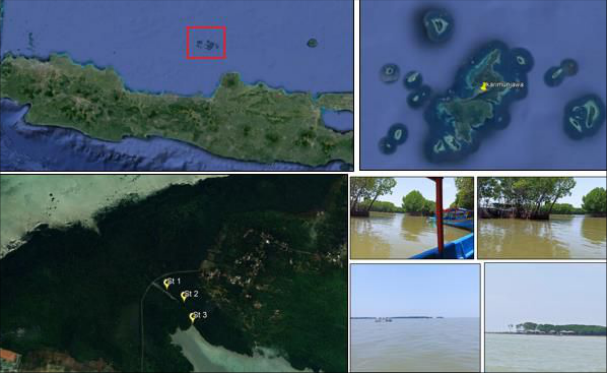 Figure 1Page 2
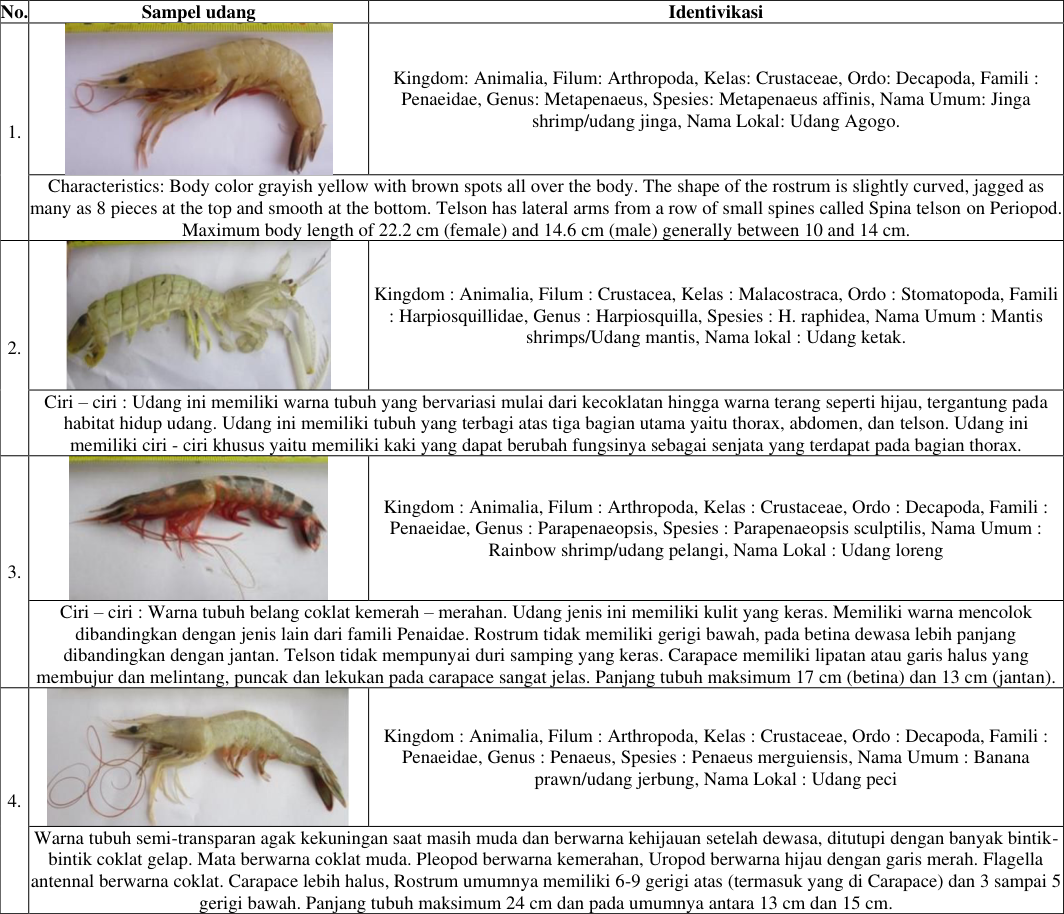 Table 1Page 4
 Figure 2Page 4
 Figure 2Page 4
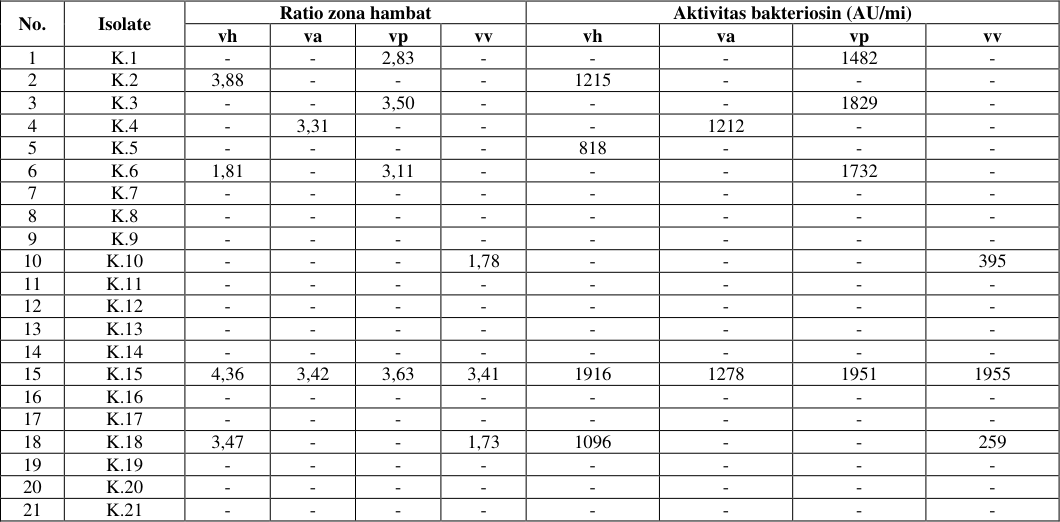 Table 2Page 5
 Figure 3Page 5
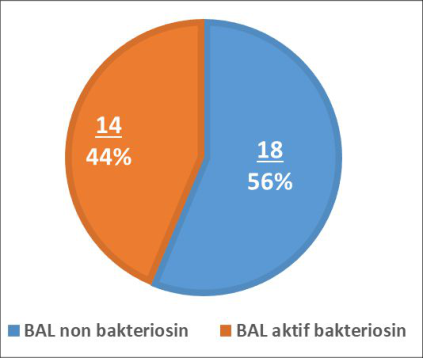 Figure 4Page 5
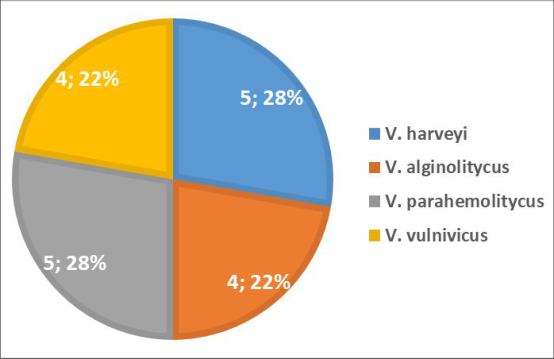 Figure 4Page 5
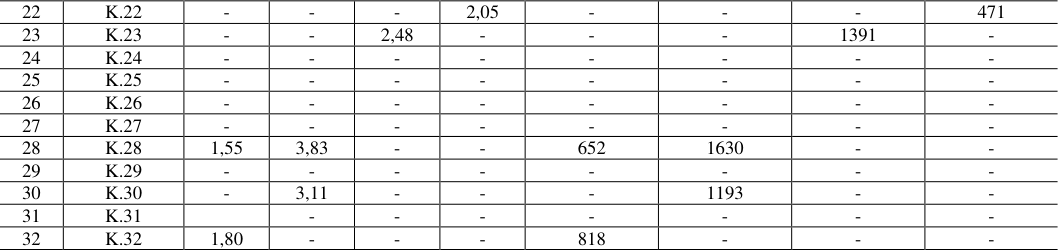 Table 3Page 6
 Table 3Page 6
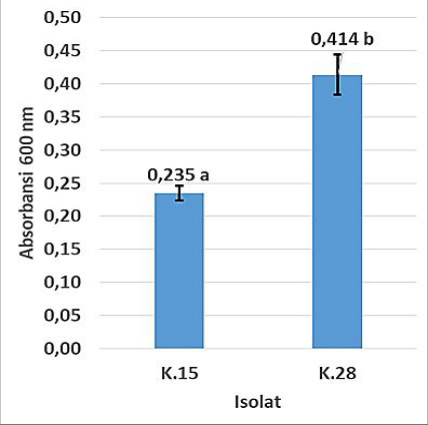 Figure 5Page 6
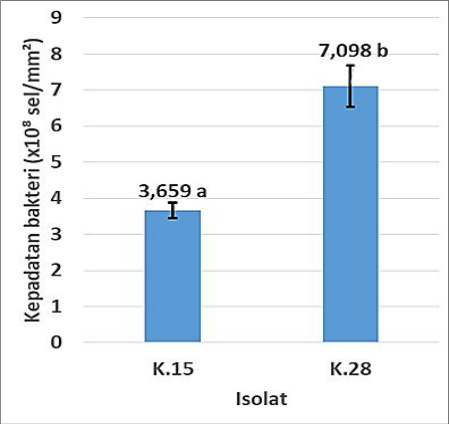 Figure 5Page 6
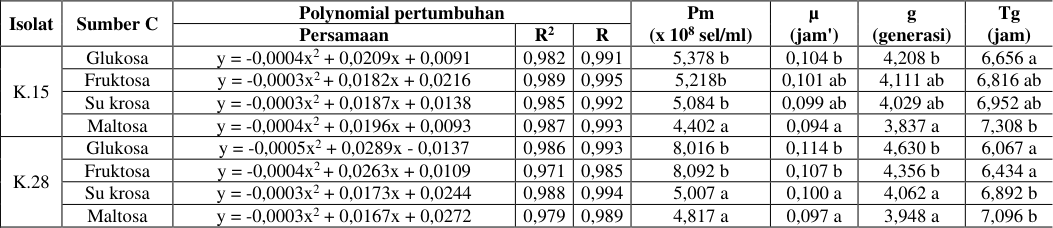 Table 4Page 7
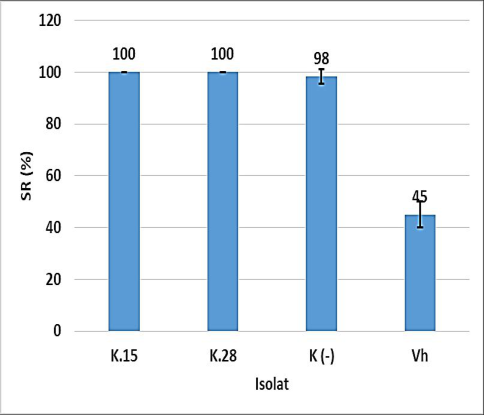 Figure 6Page 7
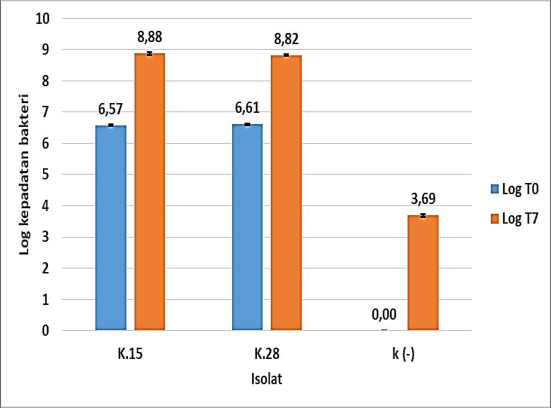 Figure 6Page 7
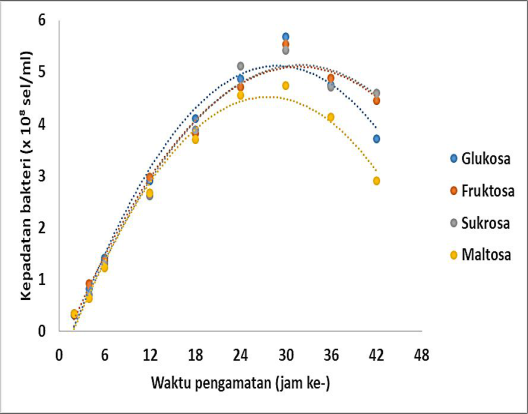 Figure 7Page 7
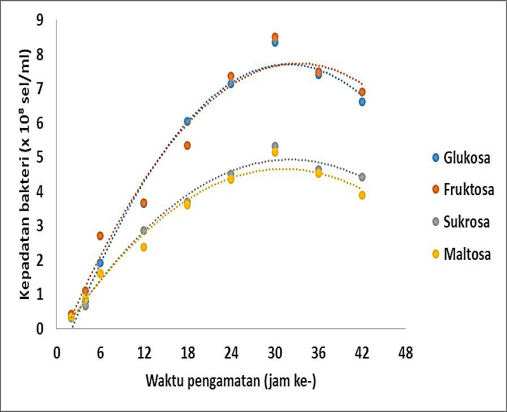 Figure 7Page 7
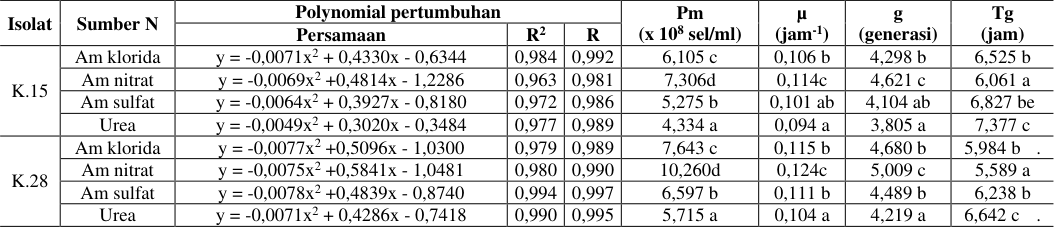 Table 5Page 8
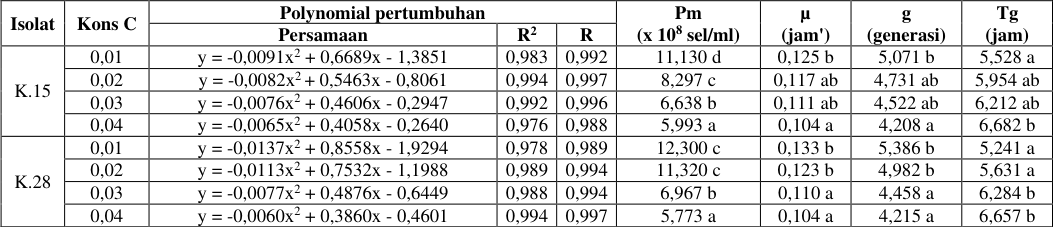 Table 6Page 8
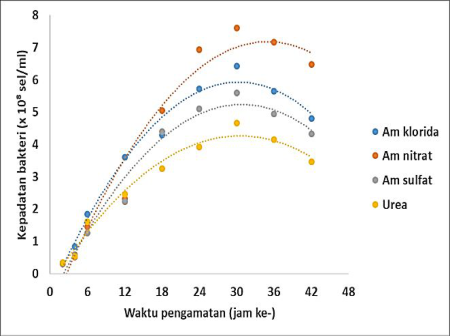 Figure 8Page 8
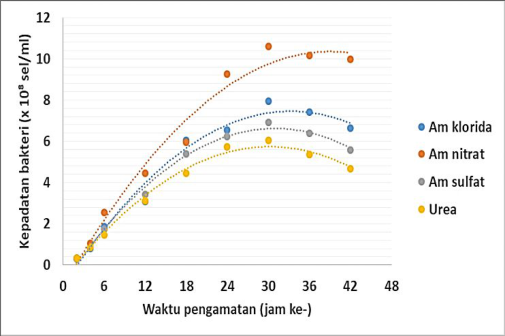 Figure 8Page 8
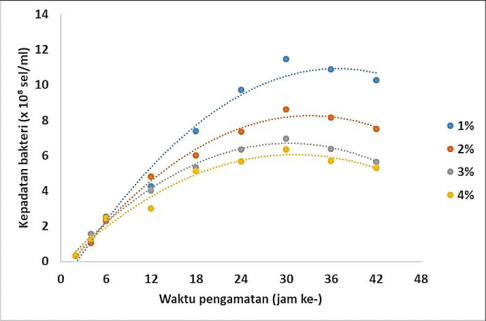 Figure 9Page 8
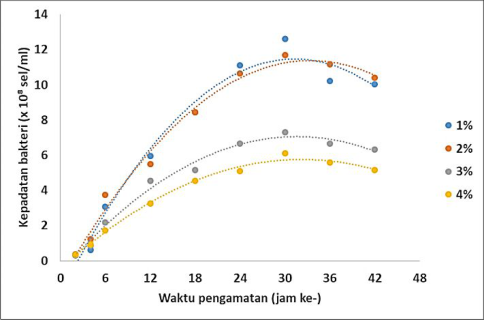 Figure 9Page 8
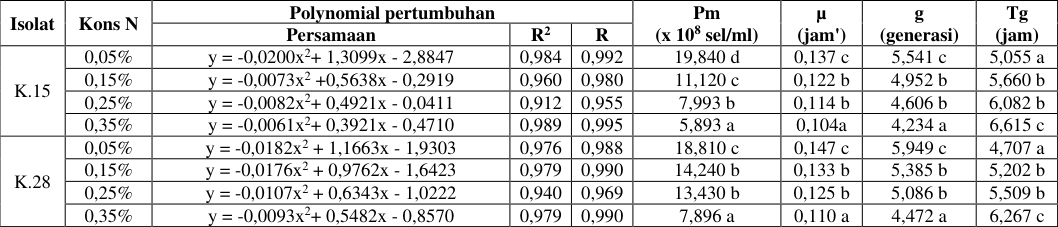 Table 7Page 9
 Table 8Page 9
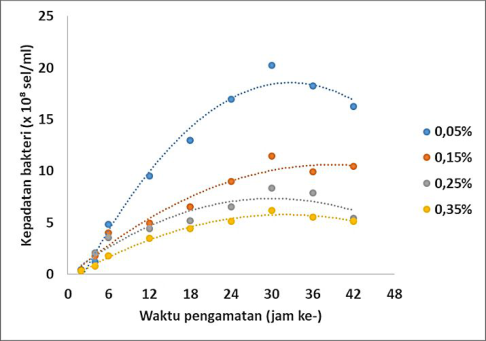 Figure 10Page 9
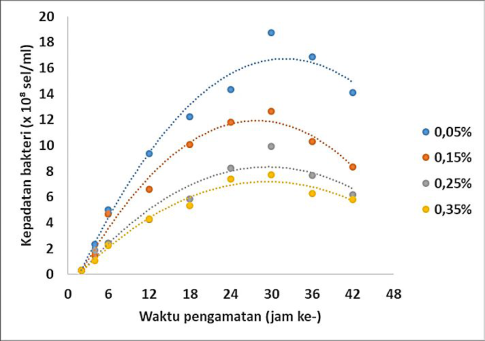 Figure 10Page 9
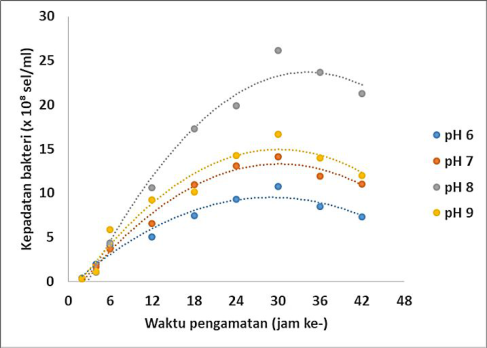 Figure 11Page 9
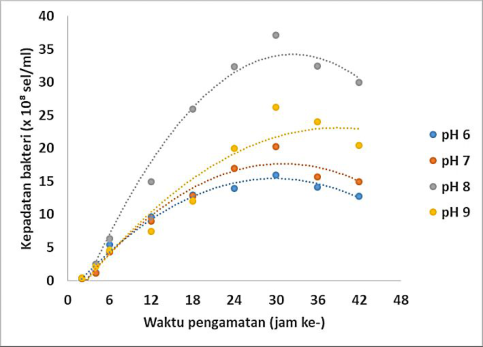 Figure 11Page 9
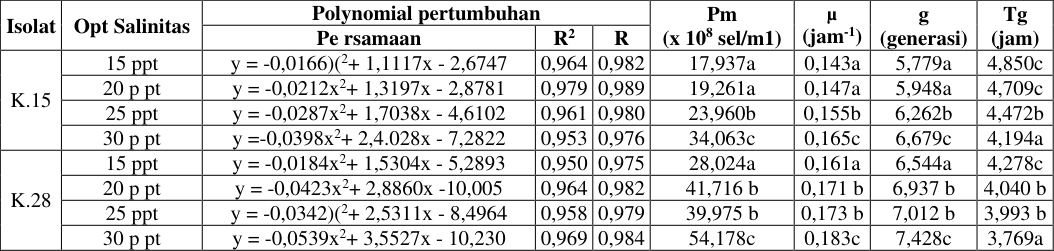 Table 9Page 10
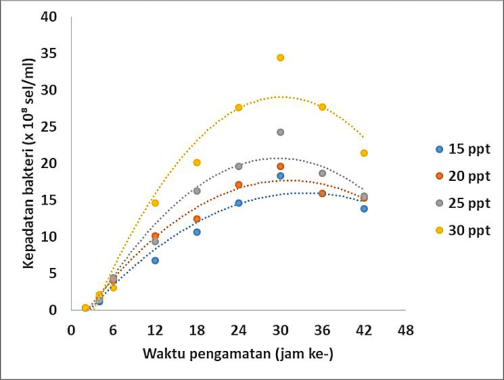 Figure 12Page 10
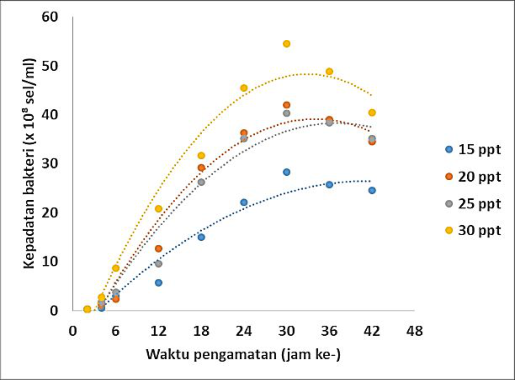 Figure 12Page 10
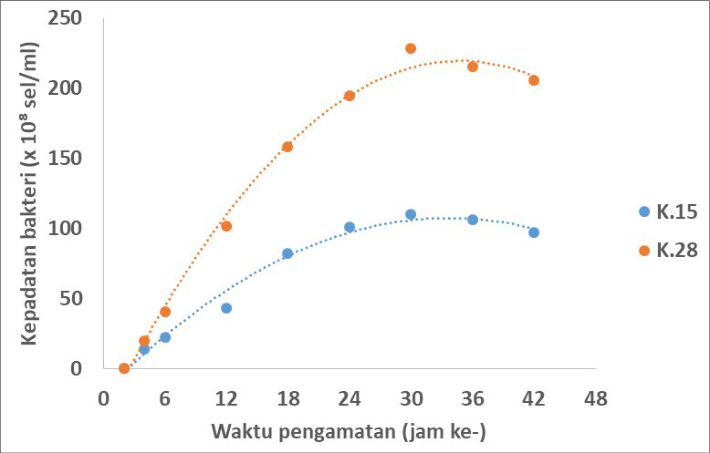 Figure 13Page 10
 Table 10Page 11
 Table 11Page 11
 Table 12Page 11
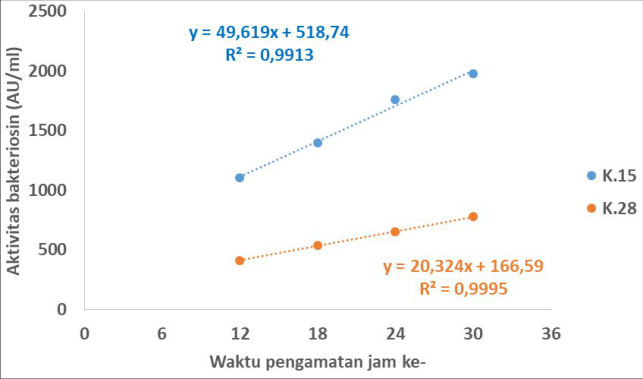 Figure 14Page 11
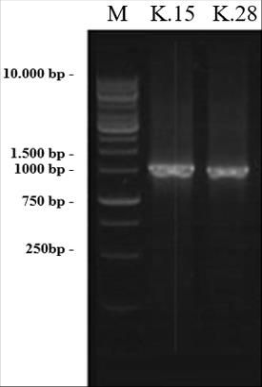 Figure 15Page 11
 Table 13Page 12
Introduction
Ilactic acid bacteria are bacteria capable of fermenting sugar or carbohydrates to produce large amounts of lactic acid. The characteristics of lactic acid bacteria in general are the cells react positively to Gram staining, react negatively to catalase and do not form spores. And glucose fermentation will produce lactic acid. Types of fermentation of lactic acid bacteria are homofermentative, namely those whose fermentation products are only lactic acid and heterofermentative ones whose fermentation results in addition to lactic acid there are other organic acids such as acetate, CO2 gas, and ethanol. Several genera of lactic acid bacteria are Lactobacillus, Streptococcus, Enterococcus, Pediococcus, Tetragenococcus, Leuconostoc, and Lactococcus. (Mitsuoka 1989; Widyastuti, 1999) Lactic acid bacteria (LAB) are commonly found in fermented products and have been reported to function as probiotics. The definition of probiotics according to FAO/WHO is live microorganisms which when administered in sufficient quantities confer health benefits on the host (Araya et al. 2002). According to Fuller (1989), probiotics are dietary supplements containing live microbes that can benefit the host. Some of the benefits of probiotics are maintaining beneficial microflora in the digestive tract, inhibiting the growth of pathogenic bacteria, increasing digestive enzyme activity, decreasing bacterial enzyme activity and ammonia production, neutralizing enterotoxins and stimulating the immune system (Jin et al. 1998). Shrimp is one of Indonesia's fishery export commodities, which has provided a large enough foreign exchange income for the country. Shrimp cultivation has decreased production due to several problems. The problems of shrimp farming include slow growth, damage to the pond environment, and the presence of infectious diseases. The solution to the problem currently being carried out is through the application of probiotics. However, the application of probiotics still has weaknesses. The existing problems of probiotics are (1). Low survival, colonization, and nutrient competition ability. (2). Isolate from one source location. (3).
The urgency of the research is the formation of new probiotics with growth promoting activity, shrimp immunity (immunostimulant), and suppression of vibriosis (biocontrol). The purpose of this study was to isolate bacteriocin-producing lactic acid bacteria in the intestines of karimunjawa which are potential probiotic consortium candidates.
Materi dan Metode Materi penelitian
Materi penelitian yang digunakan dalam penelitian ini adalah sampel udang yang hidup secara alami dan endemik di perairan karimun jawa. udang tersebut di lakukan sampling pada tiga titik lokasi sampling yang disampaiakan pada gambar 1.
Isolation of Lactic Acid Bacteria from Shrimp
Intestines: Lactic acid bacteria were isolated from the digestive tract of shrimp (catch) using the dilution seriespourplate technique on MRS medium. Shrimp sample preparation was carried out by first sterilizing the body surface using 0.1% benzylkonium chloride to remove any bacteria present. Then the shrimp is sliced from the dorsal to the anus with a sterile knife, then to take the intestine is done with sterile tweezers. The shrimp intestines were then placed in a petri dish and washed with sterile distilled water. Intestines that have been weighed 1 gram are crushed and suspended in sterile dilution water. Water for dilution uses seawater and sterile distilled water in a ratio of 70% and 30%. Subsequently, 10-1, 10-2, 10-3 and 10-4 dilutions were carried out. In dilutions 10-1 to 10-4, it was grown using the pour plate technique in 20 mL MRS agar added with 1% CaCO3 and 0.01% Na azide. Incubation was carried out aerobically for 24-48 hours at 37 oC. isolates that produced clear zones were then grown in MRSB and then transferred to slanted media for preparation for the next stage. (Todorov and Dicks, 2004)
Acid Resistance Test and Effect of Changes in pH:
The potential test as a probiotic candidate carried out in this study was to test the adaptability (survival to gastric acid and changes in digestive tract pH) in vitro. The potency test includes the LAB resistance test against gastric acid resistance with the LAB isolate method inoculated on MRS borth media then added 0.01 N HCL with (pH 2) adjusted to gastric pH, then the inoculation results are incubated microaerophilic at 37 °C for 3 o'clock. After incubation, the surviving cells were counted by re-growing in MRS agar using the pour agar method which was micro aerophilically incubated for 48 hours at 37 °C. The number of LAB colonies that grew in each treatment was compared with the number of colonies at 0 hours without treatment. The reading is positive if growth is seen in the incubated MRSA media isolate. The number of LAB colonies that grew in each treatment was compared with the number of colonies at 0 hours without treatment.
Attachment Test: This test refers to the method based on Dewanti and Wong (1993) which uses a steel plate. First, the steel plate is sterilized by immersing it in a detergent solution which is heated to a temperature of 40-45 °C for 24 hours, then the steel plate is rinsed with hot water of 40-50 °C until clean and then dried, then autoclaved at 121 o C for 20 minute. The test was carried out by placing the steel plate in a 1 L Erlenmeyer in a standing position. The Erlenmeyer was previously filled with 250 ml of sterile TSB and 1 ml of fresh bacterial culture was inoculated. Erlenmeyer was covered with aluminum foil and placed in a shaker for 24 hours at 29 °C. After 24 hours the steel plate was rinsed with phosphate buffer solution (BF). Then the surface of the plate is wiped evenly using a swab. The swab was put into a test tube containing 10 ml of BF and vortexed for 1 minute. Then serial dilutions were carried out and the bacterial population was calculated using the plate count method. The number of bacteria growing on the media in Erlenmeyer was also calculated by taking 1 ml of liquid from the growth medium and diluted with 9 ml of phosphate buffer. Furthermore, the calculation of the bacterial population that grows is carried out using the cup count method. Bacteria that are able to form a good biofilm will be able to stick to the substrate, namely the intestine. Pathogenicity test: A total of 3 selected isolates were then tested for infective properties against shrimp larvae. This test was carried out using the bathing method. A total of 1 gram of the bacterial consortium was grown on the activation medium, namely 70% seawater added with 2% glucose and 0.05% ammonium nitrate, then incubated in a shaker at 150 rpm at 30oC with a density of 106 and 108 CFU/ml. Activation results are then poured on the treatment media. The experiment was repeated twice with positive control in the form of adding V. harveyi bacteria. Shrimp larvae were reared in jars filled with 2 liters of sterile seawater at a density of 10 fish/l and fed commercial pellets. Pathogenicity of probiotic candidate bacteria was observed through larval death during 5 days of rearing (Vijayan et al., 2006). At the end of the experiment, the survival rate (SR) of the shrimp larvae was calculated and compared with the control, namely the treatment without the addition of a bacterial consortium. Selection of carbon and nitrogen sources: Selection of nutrients including carbon and nitrogen sources was carried out using experimental methods. All treatments were repeated 3 times. The method used in this study follows the modified procedure according to Polak-Berecka et al., (2010) and Sathyanarayanan et al., (2011). The selected carbon sources were glucose, fructose and molasses as co-substrates in zobell 2216E medium based on biomass production. Carbon source was given at 1% level in zobell 2216E medium. The nitrogen sources selected were ammonium chloride, ammonium nitrate, and urea were selected as co-substrates based on biomass production. Nitrogen sources were provided at the level of 0.2% in zobell 2216E medium. Selection of carbon sources and nitrogen sources was carried out in a 1000 mL erlenmeyer. All media were set at pH 7.0. The culture medium (200 ml) in erlenmeyer was inoculated with starter isolate which gave an OD of 0.01 in A600. Incubate at room temperature. Every 6-hour interval for 48 hours, 4 mL of samples were taken and OD measurements were taken on the A600. The OD measurement data for each treatment were then used as data to select the right carbon and nitrogen sources for growth.
Based on the growth rate data of 20 isolates in the C and N source selection treatment, ranking was then carried out and the 10 best isolates were selected (appendix 11). The 10 best isolates were then tested for optimization of C and N concentrations; optimization of pH, salinity and growth temperature; and quantitative test of protein hydrolysis. Optimization of carbon and nitrogen concentrations: The carbon and nitrogen sources that have been successfully selected based on the carbon and nitrogen source selection experiments are then carried out by optimizing the carbon and nitrogen concentrations in zobell 2216E medium. There are four concentrations of carbon sources, namely 1%, 2%, and 4%. While the nitrogen sources consist of concentrations of 0.05%, 0.2%, 0.45%. Each medium zobell 221E 2216E with various concentrations of carbon and nitrogen sources in Erlenmeyer was inoculated with starter isolate which gave an OD of 0.01 to A600. Incubation at room temperature every 6 hours intervals, a 4 mL sample was taken, then the OD was measured on the A600 (Mahdhi et al., 2012). Optimizing pH: Liquid zobell 2216E medium added with carbon source and nitrogen source with optimum concentration obtained from experiment orientation of carbon source and nitrogen source concentration in Erlenmeyer was inoculated with starter isolate which gave OD 0.01 to A600. The pH of the medium was adjusted to variations of 6, 7 and 8 with the addition of 1N HCl or 1N NaOH solution. Incubation at the optimum temperature obtained from the experimental orientation of the incubation temperature. Every 6 hour interval for 48 hours, a 4 ml sample was taken and the OD was measured on the A600 (Anderson & Vijayakumar, 2012).
Salinity optimization
The liquid zobell 2216E medium plus a carbon source and a nitrogen source with optimum concentrations obtained from the experimental orientation of the concentration of carbon sources and nitrogen sources in Erlenmeyer was inoculated with a starter isolate which gave an OD of 0.01 to A600. The salinity of the medium was set at variations of 15 o/oo, 20 o/oo, 25 o/oo and 30 o/oo. Incubation at the optimum temperature obtained from the experimental orientation of the incubation temperature. Every 6 hour interval for 48 hours, a 4 ml sample was taken and the OD was measured on the A600 (Anderson & Vijayakumar, 2012). Study of growth kinetics and protease enzymes in fermenter: One slanted culture loop was inoculated into 20 ml of liquid Zobell 221E medium, then incubated at 30oC for 24 hours. A total of 0.5% inoculum was transferred to 200 ml of experimental medium in a 1000 ml Erlenmeyer, and incubated at 30oC and shaken at 150 rpm (Sreekumar & Krishnan, 2010). Growth measurement aims to determine the character of the growth of isolates and the optimal time in enzyme production. Culture in the fermenter was carried out on 5 isolates of bacteria that were selected separately, namely each bacterium that had proteolytic, amylolytic, cellulolytic, lipolytic and antibacterial activity. In this culture using a fermenter with a capacity of 2 liters with a working volume of 1 liter. The condition of the fermenter is zobell 2216E broth media enriched with selected sources of C and N with optimal concentrations. inoculum concentration 1% with an OD of 0.01 on A600, the culture conditions of pH, salinity and temperature were used optimally. 4 ml of samples were taken at incubation 0, 2, 4, 6, 12, 18, 24, 30, 36, 42, and 48 hours (Annamalai et al., 2011). The proteolytic fermenter observed bacterial growth kinetics, protease activity and protein content. amylolytic fermenter observed bacterial growth kinetics and amylolytic activity. Cellulolytic fermenter observed bacterial growth kinetics and cellulolytic activity. The antibacterial fermenter was observed for bacterial growth kinetics and antibacterial activity by the diffusion method. Bacteriocin Test: The bacteriocin activity test was carried out using the agar well diffusion method (Ogunbanwo et al., 2003;Udhayashree et al., 2012). A total of 100 l of indicator bacteria were inoculated on MHA media, then 6 mm diameter wells were made on the solidified agar. In each well, 10 l of crude osin bacteria was added. The MHA plate was then incubated at 35 °C for 24 hours. Bacteriocin activity was indicated by the presence of a clear clear/halo zone around the well. Bacteriocin activity was expressed as Arbitrary Units (AU) per ml. One AU is expressed as the area of the inhibition zone per unit volume of the tested bacteriocin sample (mm2/ml) (Usmiati & Marwati, 2007). data analysis: morphological identification data of shrimp samples were analyzed descriptively. ratio data and bacteriocin activity were tabulated. Bacterial density data were analyzed using orthogonal polynomials. growth data were analyzed using one way annova with SPSS program. Results and discussion: research has been carried out in order to obtain LAB bacteria isolates that have the potential to be used as probiotics. The research conducted sampling in the waters of Karimunjawa, Jepara. The results of sampling and identification of shrimp samples are presented in table 1. Kingdom: Animalia, Filum: Arthropoda, Kelas: Crustaceae, Ordo: Decapoda, Famili : Penaeidae, Genus: Metapenaeus, Spesies: Metapenaeus affinis, Nama Umum: Jinga shrimp/udang jinga, Nama Lokal: Udang Agogo.
Characteristics: Body color grayish yellow with brown spots all over the body. The shape of the rostrum is slightly curved, jagged as many as 8 pieces at the top and smooth at the bottom. Telson has lateral arms from a row of small spines called Spina telson on Periopod.
Maximum body length of 22.2 cm (female) and 14.6 cm (male) generally between 10 and 14 cm. Berdasarkan hasil penelitian pada tabel 3 menunjukkan bahwa isolat bakteri K15 memiliki pertumbuhan yang optimal pada pH normal. sedangkan bakteri k15 lebih sensitif terhadap pH 8 dengan ditunjukkan dengan pertumbuhan terendah. isolat bakteri K28 memiliki pertumbuhan yang optimal pada pH normal. sedangkan bakteri k28 lebih sensitif terhadap pH 3 dan 8 dengan ditunjukkan dengan pertumbuhan terendah. selanjutnya isolat K15 dan K28 dilakukan uji penempelan lempeng. Berdasarkan hasil penelitian pada gambar 6 menunjukkan bahwa isolat bakteri K15 dan K28 memiliki nilai SR 100% dengan demikian kedua bakteri tersebut tidak bersifat patogen. sedangkan larva udang dengan pemberian perlakuan bakteri vibrio memberikan nilai SR 45%. pada media uji paogenitas setelah 7 hari mengalami peningkatan kepadatan bakteri. Berdasarkan hasil penelitian gambar 7 dan tabel 4 menunjukkan bahwa isolat bakteri k15 memiliki pertumbuhan terbaik dengan menggunakan sumber C glukosa dari pada sumber C yang lain. sedangkan untuk islat bakteri k28 memiliki pertumbuhan terbaik dengan menggunakan sumber C glukosa dari pada sumber C yang lain. selanjutnya penelitian melakukan uji pemilihan sumber N terhadap pertumbuhan isolat k15 dan k28. Berdasarkan hasil penelitian gambar 8 dan tabel 5 menunjukkan bahwa isolat bakteri k15 memiliki pertumbuhan terbaik dengan menggunakan sumber N amonium nitrat dari pada sumber N yang lain. sedangkan untuk islat bakteri k28 memiliki pertumbuhan terbaik dengan menggunakan sumber N amonium nitrat dari pada sumber N yang lain. selanjutnya penelitian melakukan uji optimasi glukosa terhadap pertumbuhan isolat k15 dan k28. Berdasarkan hasil penelitian gambar 9 dan tabel 6 menunjukkan bahwa isolat bakteri k15 memiliki pertumbuhan terbaik dengan menggunakan sumber C glukosa pada konsentrasi 0,01% dari pada konsentrasi glukosa yang lain yang lain. sedangkan untuk islat bakteri k28 memiliki pertumbuhan terbaik dengan menggunakan sumber C glukosa pada konsentrasi 0,01% dari pada konsentrasi yang lain. selanjutnya penelitian melakukan uji optimasi amonium nitrat terhadap pertumbuhan isolat k15 dan k28. Berdasarkan hasil penelitian gambar 10 dan tabel 7 menunjukkan bahwa isolat bakteri k15 memiliki pertumbuhan terbaik dengan menggunakan sumber N amonium nitrat pada konsentrasi 0,05% dari pada konsentrasi amonium nitrat yang lain yang lain. sedangkan untuk islat bakteri k28 memiliki pertumbuhan terbaik dengan menggunakan sumber amonium nitrat pada konsentrasi 0,05% dari pada konsentrasi yang lain. selanjutnya penelitian melakukan uji optimasi pH terhadap pertumbuhan isolat k15 dan k28. Berdasarkan hasil penelitian gambar 11 dan tabel 8 menunjukkan bahwa isolat bakteri k15 memiliki pertumbuhan terbaik dengan menggunakan pH 8 dari pada pH yang lain yang lain. sedangkan untuk islat bakteri k28 memiliki pertumbuhan terbaik dengan menggunakan pH 8 dari pada pH yang lain. selanjutnya penelitian melakukan uji optimasi salinitas terhadap pertumbuhan isolat k15 dan k28. Berdasarkan hasil penelitian gambar 13 dan 10 menunjukkan bahwa isolat bakteri k15 dan k28 memiliki pertumbuhan yang lebih baik di fermentor dengan kondisi yang optimal. isolat bakteri k28 memiliki pertumbuahn mutlak dan laju pertumbuhan yang lebih tinggi daripada isolat k15. Berdasarkan hasil penelitian pada gambar 14, tabel 11 dan 12 menunjukkan bahwa isolat bakteri k15 memiliki aktivitas bakteriosin lebih tinggi daripada k28, selanjutnya bakteri k15 dan 28 dilakukan identivikasi secara molekular.
Figures and tables from the paper
| No. | Isolate | Ratio zona hambat | — | — | — | Aktivitas bakteriosin (AU/mi) | — | — | — |
|---|---|---|---|---|---|---|---|---|---|
| vh | va | vp | vv | vh | va | vp | vv | ||
| 1 | K.1 | - | - | 2,83 | - | - | - | 1482 | - |
| 2 | K.2 | 3,88 | - | - | - | 1215 | - | - | - |
| 3 | K.3 | - | - | 3,50 | - | - | - | 1829 | - |
| 4 | K.4 | - | 3,31 | - | - | - | 1212 | - | - |
| 5 | K.5 | - | - | - | - | 818 | - | - | - |
| 6 | K.6 | 1,81 | - | 3,11 | - | - | - | 1732 | - |
| 7 | K.7 | - | - | - | - | - | - | - | - |
| 8 | K.8 | - | - | - | - | - | - | - | - |
| 9 | K.9 | - | - | - | - | - | - | - | - |
| 10 | K.10 | - | - | - | 1,78 | - | - | - | 395 |
| 11 | K.11 | - | - | - | - | - | - | - | - |
| 12 | K.12 | - | - | - | - | - | - | - | - |
| 13 | K.13 | - | - | - | - | - | - | - | - |
| 14 | K.14 | - | - | - | - | - | - | - | - |
| 15 | K.15 | 4,36 | 3,42 | 3,63 | 3,41 | 1916 | 1278 | 1951 | 1955 |
| 16 | K.16 | - | - | - | - | - | - | - | - |
| 17 | K.17 | - | - | - | - | - | - | - | - |
| 18 | K.18 | 3,47 | - | - | 1,73 | 1096 | - | - | 259 |
| 19 | K.19 | - | - | - | - | - | - | - | - |
| 20 | K.20 | - | - | - | - | - | - | - | - |
| 21 | K.21 | - | - | - | - | - | - | - | - |
Table text extracted from the original PDF; superscript letters are shown inline. The original table image is below.
View original table image
| 22 | K.22 | - | - | - | 2,05 | - | - | - | 471 |
|---|---|---|---|---|---|---|---|---|---|
| 23 | K.23 | - | - | 2,48 | - | - | - | 1391 | - |
| 24 | K.24 | - | - | - | - | - | - | - | - |
| 25 | K.25 | - | - | - | - | - | - | - | - |
| 26 | K.26 | - | - | - | - | - | - | - | - |
| 27 | K.27 | - | - | - | - | - | - | - | - |
| 28 | K.28 | 1,55 | 3,83 | - | - | 652 | 1630 | - | - |
| 29 | K.29 | - | - | - | - | - | - | - | - |
| 30 | K.30 | - | 3,11 | - | - | - | 1193 | - | - |
| 31 | K.31 | - | - | - | - | - | - | - | |
| 32 | K.32 | 1,80 | - | - | - | 818 | - | - | - |
Table text extracted from the original PDF; superscript letters are shown inline. The original table image is below.
View original table image
| Isolat | Perlakuan | Regresi linier eksponensial | — | — | Pm l (x 108 sel/mI) | µ (jam') | g1 (generasi) | Tg (jam) |
|---|---|---|---|---|---|---|---|---|
| Persamaan | R2 | R | ||||||
| K.15 | pH 3 | y = 0,5432x + 0,6400 | 0,998 | 0,999 | 4,94 b | 0,13 a | 1,70 a | 5,27 a |
| Normal pH 8 | y = 0,5905x + 0,7850 y = 0,4892x + 0,4275 | 0,997 0,992 | 0,998 | 5,41 c | 0,12 a | 1,67 a | 5,37 a | |
| 0,996 | 4,46 a | 0,13 a | 1,70 a | 5,31 a | ||||
| K.28 | pH 3 | y = 0,8061x + 0,9582 | 0,930 | 0,964 | 7,31 a | 0,11 a | 1,48 a | 6,10 ab |
| Normal pH 8 | y = 1,3653x - 0,2375 | 0,957 | 0,978 | 11,49 b | 0,13 b | 1,79 b | 5,03 a | |
| y = 0,9153x + 1,1175 | 0,977 | 0,988 | 7,98 a | 0,12 a | 1,49 a | 6,01 b |
Table text extracted from the original PDF; superscript letters are shown inline. The original table image is below.
View original table image
| Isolat | Sumber C | Polynomial pertumbuhan | — | — | Pm (x 108 sel/ml) | µ (jam') | g (generasi) | Tg (jam) |
|---|---|---|---|---|---|---|---|---|
| Persamaan | R2 | R | ||||||
| K.15 | Glukosa | y = -0,0004x2 + 0,0209x + 0,0091 | 0,982 | 0,991 | 5,378 b | 0,104 b | 4,208 b | 6,656 a |
| Fruktosa | y = -0,0003x2 + 0,0182x + 0,0216 | 0,989 | 0,995 | 5,218b | 0,101 ab | 4,111 ab | 6,816 ab | |
| Su krosa | y = -0,0003x2 + 0,0187x + 0,0138 | 0,985 | 0,992 | 5,084 b | 0,099 ab | 4,029 ab | 6,952 ab | |
| Maltosa | y = -0,0004x2 + 0,0196x + 0,0093 | 0,987 | 0,993 | 4,402 a | 0,094 a | 3,837 a | 7,308 b | |
| K.28 | Glukosa | y = -0,0005x2 + 0,0289x - 0,0137 | 0,986 | 0,993 | 8,016 b | 0,114 b | 4,630 b | 6,067 a |
| Fruktosa | y = -0,0004x2 + 0,0263x + 0,0109 | 0,971 | 0,985 | 8,092 b | 0,107 b | 4,356 b | 6,434 a | |
| Su krosa | y = -0,0003x2 + 0,0173x + 0,0244 | 0,988 | 0,994 | 5,007 a | 0,100 a | 4,062 a | 6,892 b | |
| Maltosa | y = -0,0003x2 + 0,0167x + 0,0272 | 0,979 | 0,989 | 4,817 a | 0,097 a | 3,948 a | 7,096 b |
Table text extracted from the original PDF; superscript letters are shown inline. The original table image is below.
View original table image
| Isolat | Sumber N | Polynomial pertumbuhan | — | — | Pm (x 108 sel/ml) | µ (jam-1) | g (generasi) | Tg (jam) |
|---|---|---|---|---|---|---|---|---|
| Persamaan | R2 | R | ||||||
| K.15 | Am klorida | y = -0,0071x2 + 0,4330x - 0,6344 | 0,984 | 0,992 | 6,105 c | 0,106 b | 4,298 b | 6,525 b |
| Am nitrat | y = -0,0069x2 +0,4814x - 1,2286 | 0,963 | 0,981 | 7,306d | 0,114c | 4,621 c | 6,061 a | |
| Am sulfat | y = -0,0064x2 + 0,3927x - 0,8180 | 0,972 | 0,986 | 5,275 b | 0,101 ab | 4,104 ab | 6,827 be | |
| Urea | y = -0,0049x2 + 0,3020x - 0,3484 | 0,977 | 0,989 | 4,334 a | 0,094 a | 3,805 a | 7,377 c | |
| K.28 | Am klorida | y = -0,0077x2 +0,5096x - 1,0300 | 0,979 | 0,989 | 7,643 c | 0,115 b | 4,680 b | 5,984 b . |
| Am nitrat | y = -0,0075x2 +0,5841x - 1,0481 | 0,980 | 0,990 | 10,260d | 0,124c | 5,009 c | 5,589 a | |
| Am sulfat | y = -0,0078x2 +0,4839x - 0,8740 | 0,994 | 0,997 | 6,597 b | 0,111 b | 4,489 b | 6,238 b | |
| Urea | y = -0,0071x2 + 0,4286x - 0,7418 | 0,990 | 0,995 | 5,715 a | 0,104 a | 4,219 a | 6,642 c . |
Table text extracted from the original PDF; superscript letters are shown inline. The original table image is below.
View original table image
| Isolat | Kons C | Polynomial pertumbuhan | — | — | Pm (x 108 sel/ml) | µ (jam') | g (generasi) | Tg (jam) |
|---|---|---|---|---|---|---|---|---|
| Persamaan | R2 | R | ||||||
| K.15 | 0,01 | y = -0,0091x2 + 0,6689x - 1,3851 | 0,983 | 0,992 | 11,130 d | 0,125 b | 5,071 b | 5,528 a |
| 0,02 | y = -0,0082x2 + 0,5463x - 0,8061 | 0,994 | 0,997 | 8,297 c | 0,117 ab | 4,731 ab | 5,954 ab | |
| 0,03 | y = -0,0076x2 + 0,4606x - 0,2947 | 0,992 | 0,996 | 6,638 b | 0,111 ab | 4,522 ab | 6,212 ab | |
| 0,04 | y = -0,0065x2 + 0,4058x - 0,2640 | 0,976 | 0,988 | 5,993 a | 0,104 a | 4,208 a | 6,682 b | |
| K.28 | 0,01 | y = -0,0137x2 + 0,8558x - 1,9294 | 0,978 | 0,989 | 12,300 c | 0,133 b | 5,386 b | 5,241 a |
| 0,02 | y = -0,0113x2 + 0,7532x - 1,1988 | 0,989 | 0,994 | 11,320 c | 0,123 b | 4,982 b | 5,631 a | |
| 0,03 | y = -0,0077x2 + 0,4876x - 0,6449 | 0,988 | 0,994 | 6,967 b | 0,110 a | 4,458 a | 6,284 b | |
| 0,04 | y = -0,0060x2 + 0,3860x - 0,4601 | 0,994 | 0,997 | 5,773 a | 0,104 a | 4,215 a | 6,657 b |
Table text extracted from the original PDF; superscript letters are shown inline. The original table image is below.
View original table image
| Isolat | Kons N | Polynomial pertumbuhan | — | — | Pm (x 108 sel/ml) | µ (jam') | g (generasi) | Tg (jam) |
|---|---|---|---|---|---|---|---|---|
| Persamaan | R2 | R | ||||||
| K.15 | 0,05% | y = -0,0200x2+ 1,3099x - 2,8847 | 0,984 | 0,992 | 19,840 d | 0,137 c | 5,541 c | 5,055 a |
| 0,15% | y = -0,0073x2 +0,5638x - 0,2919 | 0,960 | 0,980 | 11,120 c | 0,122 b | 4,952 b | 5,660 b | |
| 0,25% | y = -0,0082x2+ 0,4921x - 0,0411 | 0,912 | 0,955 | 7,993 b | 0,114 b | 4,606 b | 6,082 b | |
| 0,35% | y = -0,0061x2+ 0,3921x - 0,4710 | 0,989 | 0,995 | 5,893 a | 0,104a | 4,234 a | 6,615 c | |
| K.28 | 0,05% | y = -0,0182x2 + 1,1663x - 1,9303 | 0,976 | 0,988 | 18,810 c | 0,147 c | 5,949 c | 4,707 a |
| 0,15% | y = -0,0176x2 + 0,9762x - 1,6423 | 0,979 | 0,990 | 14,240 b | 0,133 b | 5,385 b | 5,202 b | |
| 0,25% | y = -0,0107x2 + 0,6343x - 1,0222 | 0,940 | 0,969 | 13,430 b | 0,125 b | 5,086 b | 5,509 b | |
| 0,35% | y = -0,0093x2+ 0,5482x - 0,8570 | 0,979 | 0,990 | 7,896 a | 0,110 a | 4,472 a | 6,267 c |
Table text extracted from the original PDF; superscript letters are shown inline. The original table image is below.
View original table image
| Isolat | Opt pH | Polynomial pertumbuhan | — | — | Pm (x 108 sel/ml) | µ (jam') | g (generasi) | Tg (jam) |
|---|---|---|---|---|---|---|---|---|
| Persamaan | R2 | R | ||||||
| K.15 | pH 6 | y =-0,0122x2 +0,7079x - 0,7525 | 0,956 | 0,978 | 10,428 a | 0,124a | 5,035 a | 5,563 c |
| pH 7 | y = -0,0169x2 + 1,0171x - 2,0466 | 0,986 | 0,993 | 13,774 b | 0,136 ab | 5,528 a b | 5,076 b | |
| pH 8 | y = -0,0240x2 + 1,6413x - 4,4177 | 0,980 | 0,990 | 25,821 d | 0,153 c | 6,221 c | 4,502 a | |
| pH 9 | y = -0,0185x2 + 1,1174x - 1,8902 | 0,955 | 0,977 | 16,346 c | 0,140 b | 5,672 b | 4,937 b | |
| K.28 | pH 6 | y = -0,0197x2 + 1,1706x - 1,9822 | 0,985 | 0,992 | 15,669 a | 0,140 a | 5,693 a | 4,922 c |
| pH 7 | y = -0,0218x2 + 1,3515x - 3,2813 | 0,970 | 0,985 | 19,941 b | 0,147 ab | 5,948 a b | 4,713 be | |
| pH 8 | y = -0,0391x2 + 2,5322x - 6,7612 | 0,983 | 0,992 | 36,772 d | 0,164 c | 6,658 c | 4,205 a | |
| pH 9 | y = -0,0177x2 + 1,3766x - 3,6292 | 0,935 | 0,967 | 25,902 c | 0,155 b | 6,271 b | 4,466 b |
Table text extracted from the original PDF; superscript letters are shown inline. The original table image is below.
View original table image
| Isolat | Opt Salinitas | Polynomial pertumbuhan | — | — | Pm (x 108 sel/m1) | µ (jam-1) | g (generasi) | Tg (jam) |
|---|---|---|---|---|---|---|---|---|
| Pe rsamaan | R2 | R | ||||||
| K.15 | 15 ppt | y = -0,0166)(2+ 1,1117x - 2,6747 | 0,964 | 0,982 | 17,937a | 0,143a | 5,779a | 4,850c |
| 20 p pt | y = -0,0212x2+ 1,3197x - 2,8781 | 0,979 | 0,989 | 19,261a | 0,147a | 5,948a | 4,709c | |
| 25 ppt | y = -0,0287x2+ 1,7038x - 4,6102 | 0,961 | 0,980 | 23,960b | 0,155b | 6,262b | 4,472b | |
| 30 p pt | y =-0,0398x2+ 2,4.028x - 7,2822 | 0,953 | 0,976 | 34,063c | 0,165c | 6,679c | 4,194a | |
| K.28 | 15 ppt | y = -0,0184x2+ 1,5304x - 5,2893 | 0,950 | 0,975 | 28,024a | 0,161a | 6,544a | 4,278c |
| 20 p pt | y = -0,0423x2+ 2,8860x -10,005 | 0,964 | 0,982 | 41,716 b | 0,171 b | 6,937 b | 4,040 b | |
| 25 ppt | y = -0,0342)(2+ 2,5311x - 8,4964 | 0,958 | 0,979 | 39,975 b | 0,173 b | 7,012 b | 3,993 b | |
| 30 p pt | y = -0,0539x2+ 3,5527x - 10,230 | 0,969 | 0,984 | 54,178c | 0,183c | 7,428c | 3,769a |
Table text extracted from the original PDF; superscript letters are shown inline. The original table image is below.
View original table image
| isolat | Polynomial pertumbuhan | — | — | Pm (x 108 sel/ml) | µ (jam') | g (generasi) | Tg (jam) |
|---|---|---|---|---|---|---|---|
| Persamaan | R2 | R | |||||
| K.15 K.28 | y = -0,1096x2 + 7,3825x - 17,034 y = -0,2094x2 + 14,600x - 35,324 | 0,9858 0,9945 | 0,993 0,997 | 109,763 b 227,602 d | 0,208 b 0,235 c | 8,415 b 9,534 c | 3,328 c 2,937 a |
Table text extracted from the original PDF; superscript letters are shown inline. The original table image is below.
View original table image
| Pengannatan | lnkubasi jam ke- | — | — | — | Regresi liniereksponensial | — | — |
|---|---|---|---|---|---|---|---|
| 12 | 18 | 24 | 30 | y =a + bx | R2 | R | |
| Diameter zona Bening (mm) | 10,9 a | 11,9 a | 13 b | 13,6 c | y = 0,2336x + 8,1949 | 0,987 | 0,994 |
| Luas zona bening (mm2) | 66a | 84a | 106b | 119c | y = 4,4657x + 13,262 | 0,991 | 0,996 |
| Aktivitas bakteriosin (AU/ml) | 1107 a | 1397 a | 1762 b | 1978 c | y = 74,428x + 221,03 | 0,991 | 0,996 |
Table text extracted from the original PDF; superscript letters are shown inline. The original table image is below.
View original table image
| Pengamatan | Inkubasi jam ke- | — | — | — | Regresi linier eksponensial | — | — |
|---|---|---|---|---|---|---|---|
| 12 | 18 | 24 | 30 | y =a + bx | R2 | R | |
| Diameter zona Bening (mm) | 8,2 a | 8,8 ab | 9,2 b | 9,8 c | y = 0,0864x + 7,1807 | 0,9993 | 0,9996 |
| Luas zona Bening (nnm2) | 25 a | 32 ab | 39 b | 47c | y = 1,2195x + 9,9954 | 0,9995 | 0,9997 |
| Aktivitas bakteriosin (AU/ml) | 411 a | 535 a | 649 b | 779 c | y = 20,324x + 166,59 | 0,9995 | 0,9997 |
Table text extracted from the original PDF; superscript letters are shown inline. The original table image is below.
View original table image
| No. | Isolat | Sequence | Nama bakteri | Homologi (%) | No. Accession |
|---|---|---|---|---|---|
| 1 | K.15 | 1476 by | Lactobacillus plantarum | 99,93 | MW693210 |
| 2 | K.28 | 1493 by | Lactococcus garviae | 99,71 | MH057260 |
Table text extracted from the original PDF; superscript letters are shown inline. The original table image is below.
View original table image
References
25 in the original paper- Belanak Fish (Mugil Subviridis). JFMR-Journal Fish Mar Res. 2021;5(1):15-21.
- Pringgenies D, Setyati WA, Djunaedi A, Pramesti R, Rudiyanti S, Ariyanto D. Exploration of antimicrobial potency of mangrove symbiont against multi-drug resistant bacteria. J Ilm Perikan dan Kelaut. 2021;13(2):222-32.
- Andersen RJ. Sponging off nature for new drug leads. Biochem Pharmacol [Internet]. 2017;139(April):3-14. Available from: http://dx.doi.org/10.1016/j.bcp.2017.04.012
- Gatadi S, Gour J, Nanduri S. Natural product derived promising anti-MRSA drug leads: A review. Bioorganic Med Chem [Internet]. 2019;(July):1-15. Available from: https://doi.org/10.1016/j.bmc.2019.07.023
- de Lima Vieira J, dos Santos Nunes L, Rodrigues de Menezes FG, Vieira de Mendonça K, Viana de Sousa O. An integrated approach to analyzing the effect of biofloc and probiotic technologies on sustainability and food safety in shrimp farming systems. J Clean Prod [Internet]. 2021;318(July 2020):128618. Available from: https://doi.org/10.1016/j.jclepro.2021.128618
- El-Saadony MT, Alagawany M, Patra AK, Kar I, Tiwari R, Dawood MAO, et al. The functionality of probiotics in aquaculture: An overview. Fish Shellfish Immunol [Internet]. 2021;117:36-52. Available from: https://doi.org/10.1016/j.fsi.2021.07.007
- Babu B, Sathiyaraj G, Mandal A, Kandan S, Biju N, Palanisamy S, et al. Surveillance of disease incidence in shrimp farms located in the east coastal region of India and in vitro antibacterial efficacy of probiotics against Vibrio parahaemolyticus. J Invertebr Pathol [Internet]. 2021;179(August 2020):107536. Available from: https://doi.org/10.1016/j.jip.2021.107536
- Doan H Van, Soltani M, Ringø E. In vitro antagonistic effect and in vivo protective efficacy of Gram-positive probiotics versus Gram-negative bacterial pathogens in finfish and shellfish. Aquaculture. 2021;540(February).
- Partida-arangure BO, Luna-gonzález A, Fierrocoronado JA, Flores-miranda C, González-ocampo HA. Effect of inulin and probiotic bacteria on growth, survival, immune response, and prevalence of white spot syndrome virus (WSSV) in Litopenaeus vannamei cultured under laboratory conditions. African J Biotechnol. 2013;12(21):3366-75.
- Chiu ST, Chu TW, Simangunsong T, Ballantyne R, Chiu CS, Liu CH. Probiotic, Lactobacillus pentosus BD6 boost the growth and health status of white shrimp, Litopenaeus vannamei via oral administration. Fish Shellfish Immunol [Internet]. 2021;117(July):12435. Available from: https://doi.org/10.1016/j.fsi.2021.07.024
- Das S, Mondal K, pal AK, Sengupta C. Evaluation of the probiotic potential of Streptomyces antibioticus and Bacillus cereus on growth performance of freshwater catfish Heteropneustes fossilis. Aquac Reports [Internet]. 2021;20:100752. Available from: https://doi.org/10.1016/j.aqrep.2021.100752
- Haque MM, Hasan NA, Eltholth MM, Saha P, Mely SS, Rahman T, et al. Assessing the impacts of in-feed probiotic on the growth performance and health condition of pangasius (Pangasianodon hypophthalmus) in a farm trial. Aquac Reports [Internet]. 2021;20(April):100699. Available from: https://doi.org/10.1016/j.aqrep.2021.100699
- Luo K, Tian X, Wang B, Wei C, Wang L, Zhang S, et al. Evaluation of paraprobiotic applicability of Clostridium butyricum CBG01 in improving the growth performance, immune responses and disease resistance in Pacific white shrimp, Penaeus vannamei. Aquaculture [Internet]. 2021;544(February):737041. Available from: https://doi.org/10.1016/j.aquaculture.2021.737041
- MK. Synergistic prebiotic and probiotic on growth, immune gene expression, in Zebrafish.pdf. Heliyon. 2021;7:1-6.
- Tran NT, Li S. Potential role of prebiotics and probiotics in conferring health benefits in economically important crabs. Fish Shellfish Immunol Reports [Internet]. 2022;3:100041. Available from: https://doi.org/10.1016/j.fsirep.2021.100041
- Nurhayati D, Widanarni, Yuhana M. Dietary synbiotic influence on the growth performances and immune responses to co-infection with infectious myonecrosis virus and Vibrio harveyi in Litopenaeus vannamei. J Fish Aquat Sci. 2015;10(1):13-23.
- Azizah R, Riniatsih I, Pringgenis D, Suryono CA, Suryono S. Isolasi dan Identifikasi Bakteri Pembentuk Biofilm dari Tambak Udang Balai Besar Pengembangan Budidaya Air Payau Jepara untuk Menghilangkan Amoniak. J Kelaut Trop. 2017;20(2):154-60.
- Delianis Pringgenies, Gunawan Widi Santosa, Ali Djunaedi and EY. Application of Microbe Consortium Bacillus maritimus and Virgibacillus Chiquensis from Sea Cucumber as Nitrate Booster in Semarang Wastewaters Potentially for Plants Bioactivator. Energy Environ Eng. 2019;5(7):625-30.
- Hanif MI, Pringgenies D, Santosa GW. Potential Application of Consortium Microbe from Sea Cucumber Intestinal Symbiont as Preservatives for Vaname Shrimp. Indones J Environ Manag Sustain. 2019;3(3):106-11.
- Pringgenies D, Idris R. The antioxidant activity of carotenoid pigments in the bacterial symbionts of seagrass Syringodium isoetifolium. Indones J Nat Pigment. 2019;1(1):12-5.
- Pringgenies D, Setyati WA, Soenardjo N, Pramesti R. Investigation of extra-cellular protease in indigenous bacteria of sea cucumbers as a candidate for biodetergent material in bio-industry. AIMS Environ Sci. 2020;7(4):335-49.
- Girsang PH, Pringginies D, Yudiati E, Santosa GW, Djunaedi A. Exploration of Sea Cucumber Intestinal Symbiont Microbe As Probiotic Microbe Candidate in Healthcare Products. JFMR-Journal Fish Mar Res. 2020;4(1):27-34.
- Pringgenies D, Santosa GW, Djunaedi A, Susanto AB. Potential of Bioactive Compounds of Holothuria atraAssociated Bacteria as a Raw Material in Bioindustry. New Visions Biol Sci Vol 4. 2021;4:66-75.
- Brotosudarmo THP, Limantara L, Pringgenies D. Recent exploration of bioactive pigments from marine bacteria. ScienceAsia. 2021;47(3):265-70.
- Abrar T, Hamza TA, Woldesenbet F. Optimization of Culture Growth Parameters for Production of Protease from Bacteria, Isolated from Soil Sugar Cane Production Via Tissue Culture Methods View project Optimization of Culture Growth Parameters for Production of Protease from Bacteria, Isolat. Biosci Bioeng [Internet]. 2017;3(1):1-10. Available from: http://www.aiscience.org/journal/biohttp://creativecom mons.org/licenses/by/4.0/1.