
Research article · 2023 · Full text
International Journal of Geography Geology and EnvironmentA statistical analysis of human and environmental indicators to measure development process: A case study
Volume 5(1) · Pages 168–176 · DOI: 10.22271/27067483.2023.v5.i1b.158 ↗
Research areasSustainable Development and Environmental Policy
Abstract
Author-writtenHuman development and environmental quality are two ultimate goals that every society wants to achieve at present. The development can be considered in terms of preferably economic and social parameters. On the other hand, environment relates to the resource potential and pollution level. The focus on one of these two core issues of sustainable development ultimately leads to negligence of another. It is not very easy to decide that the emphasis should be on development process or the environmental quality. Both issues are equally important in terms of human development. However, both of these parameters of sustainability appear quite different in terms of their nature but they have mutual cause and effect relationship. High level of human or infrastructural development is generally believed to be the cause of environmental degradation and depletion of natural resources and vice versa.
Summary
Source-checkedPlain-language reading of the full paper, prepared with AI and checked against the text. Each point links to the authors' own words.
Why it matters
- Societies generally aim to achieve both high human development and high environmental quality. View evidence ↗
- There is a common belief that high levels of infrastructural or human development lead to the depletion of natural resources and environmental degradation. View evidence ↗
The question
- The study aims to analyze how human development impacts environmental quality across all districts of Himachal Pradesh. View evidence ↗
What they did
- The research was conducted using data from all twelve districts of Himachal Pradesh. View evidence ↗
- The authors selected nineteen variables, dividing them into two categories: Quality of Life (QOL) and Quality of Environment (QOE). View evidence ↗
- Quality of life was assessed using eight indicators, while environmental quality was measured using five indicators. View evidence ↗
- The mean deviation method was used to simplify multidimensional data into a single dimension to interpret the relationship between development and the environment. View evidence ↗
- A composite index method based on district ranking for each indicator was also employed to analyze the data. View evidence ↗
What they found
- In 2010-11, Kangra and Mandi districts exhibited both high human development and high levels of environmental degradation. View evidence ↗
- Hamirpur and Lahul & Spiti were categorized as having both low human development and low environmental degradation. View evidence ↗
- Una district maintained its status from the previous decade, showing low human development alongside high environmental degradation. View evidence ↗
- Chamba was the only district identified as having medium human development and low environmental degradation. View evidence ↗
- According to the composite index, no district achieved the combination of high human development and low environmental degradation. View evidence ↗
What it means
- The authors conclude that accurate assessments of human and ecosystem wellbeing depend on the strategic selection of representative indicators. View evidence ↗
Visual summary
3 visualsIllustrations explain the paper; charts are replotted from the paper's own table values.
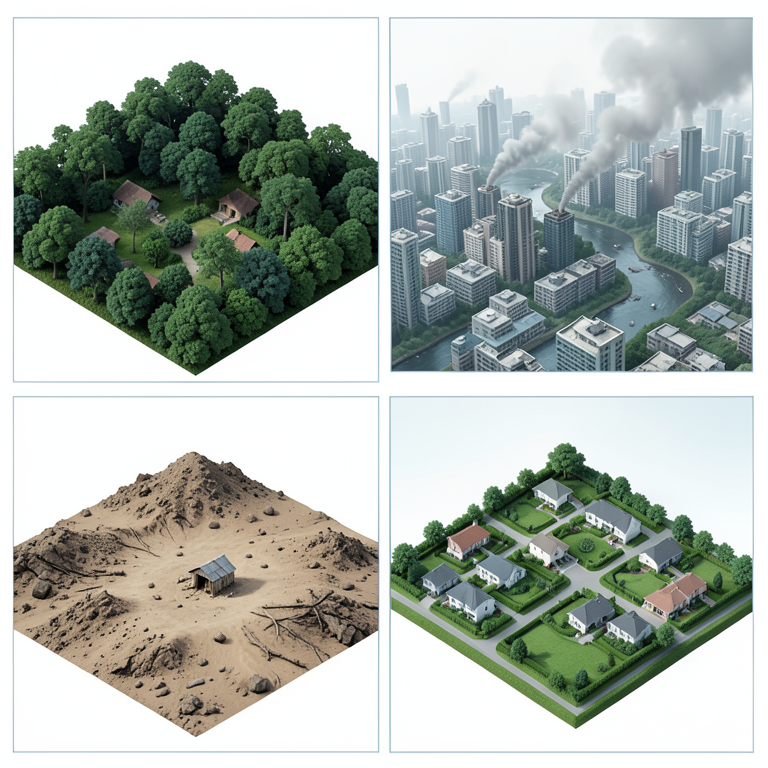
Human Development vs Environmental Degradation Matrix
AI-generated conceptual illustration (human settlements and natural landscapes). It explains the idea and does not show study data.
View source evidence ↗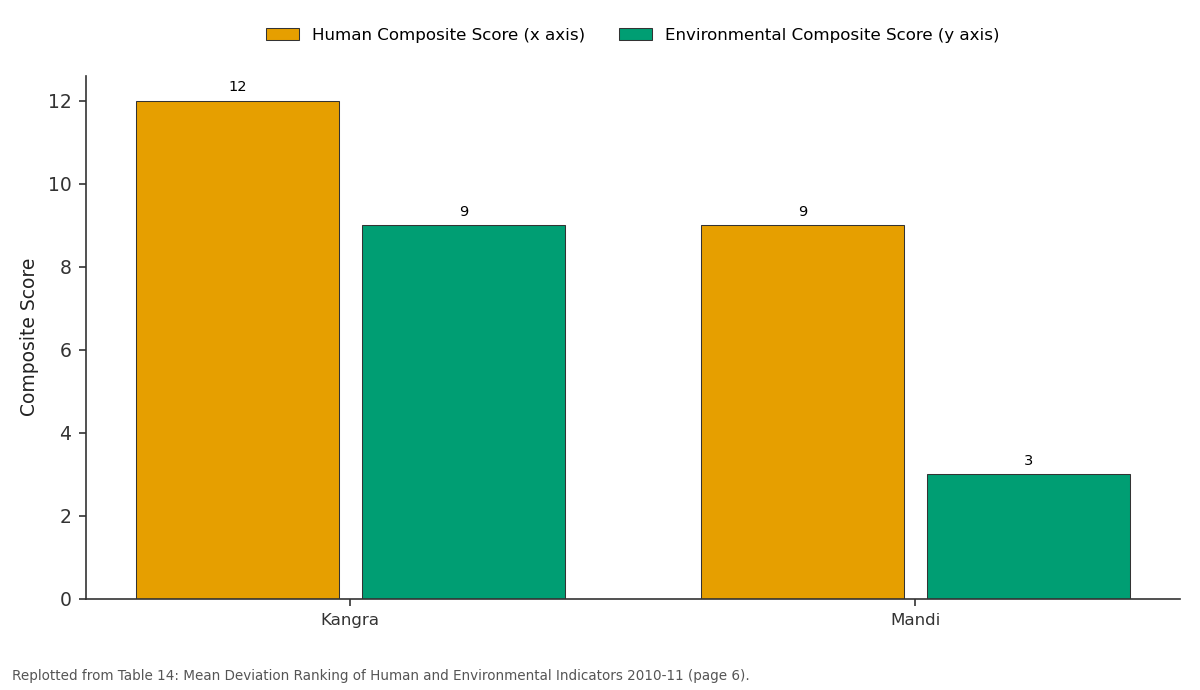
Human Composite Score (x axis) and Environmental Composite Score (y axis): Kangra vs Mandi
Replotted from Table 14 (page 6) of the original paper. Every bar is the paper's own table value.
View source evidence ↗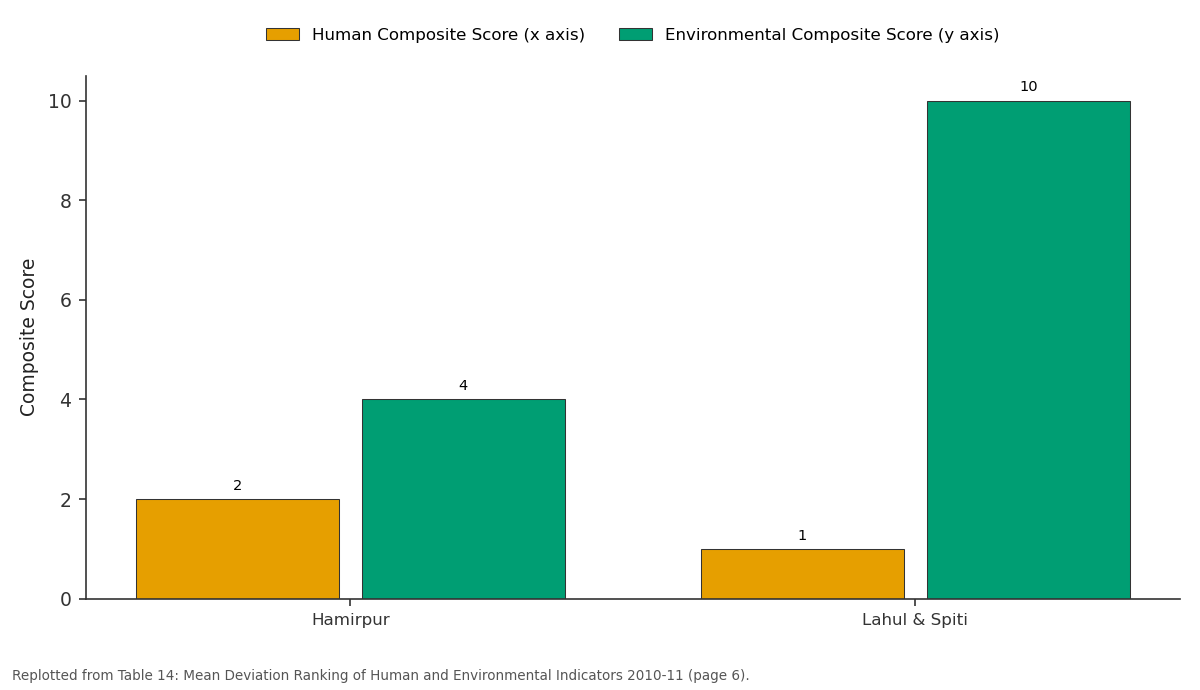
Human Composite Score (x axis) and Environmental Composite Score (y axis): Hamirpur vs Lahul & Spiti
Replotted from Table 14 (page 6) of the original paper. Every bar is the paper's own table value.
View source evidence ↗Figures & tables
From the original paper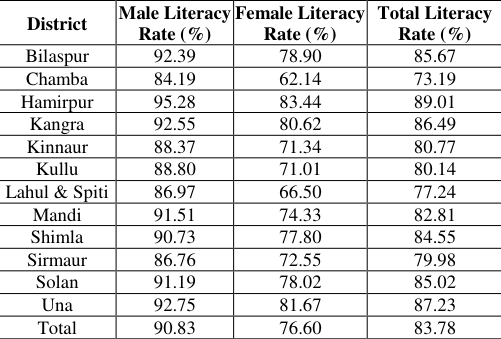 Table 1
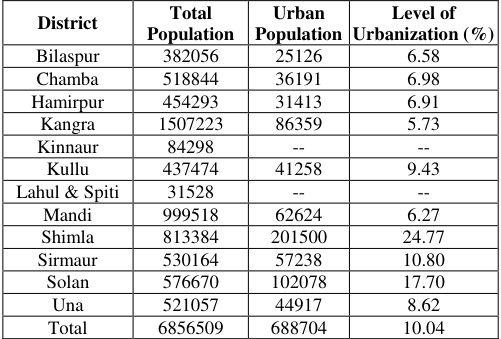 Table 2
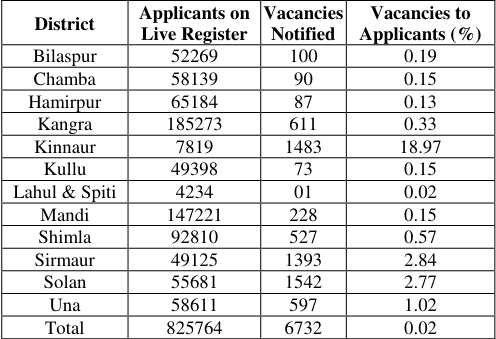 Table 3
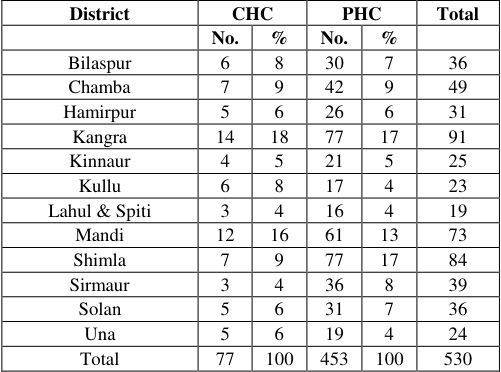 Table 5
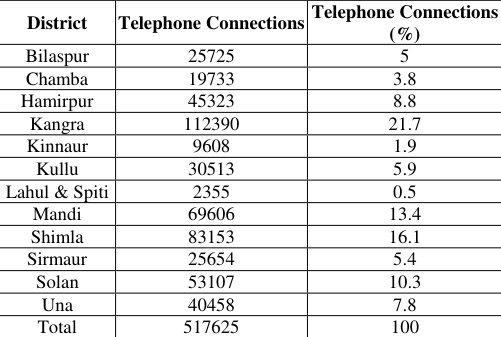 Table 6
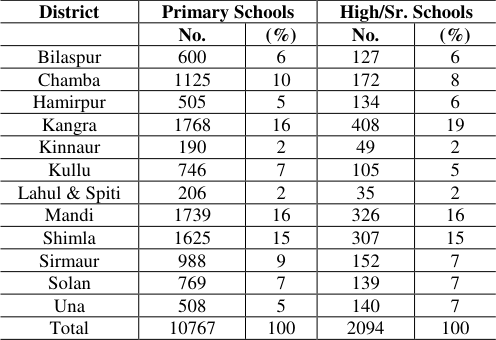 Table 4
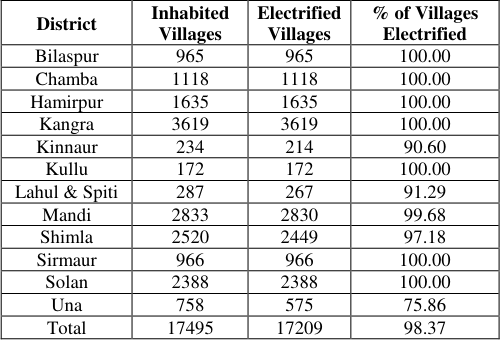 Table 7
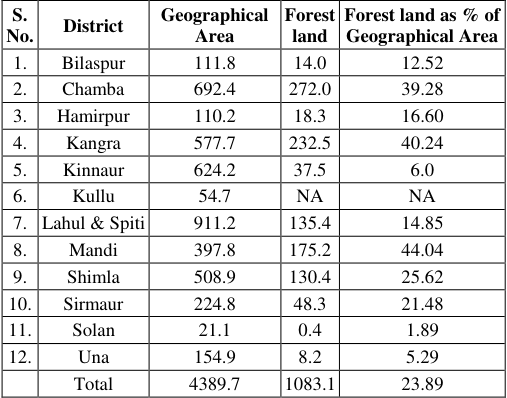 Table 9
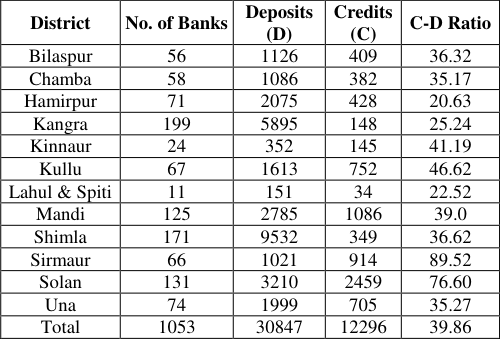 Table 8
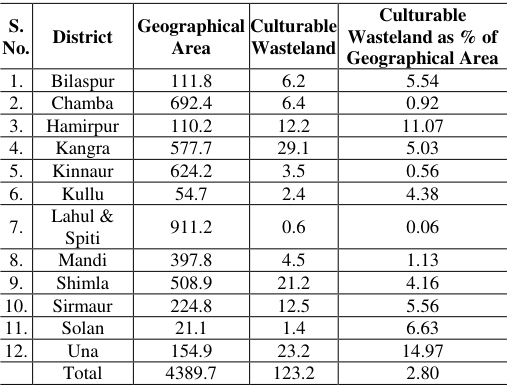 Table 10
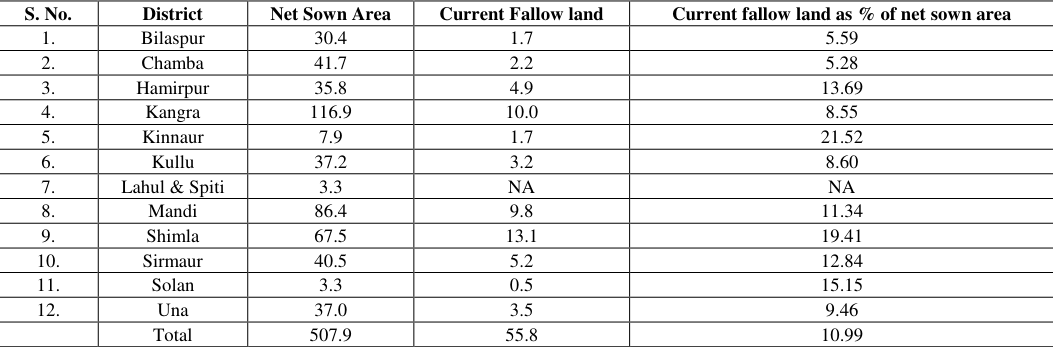 Table 11
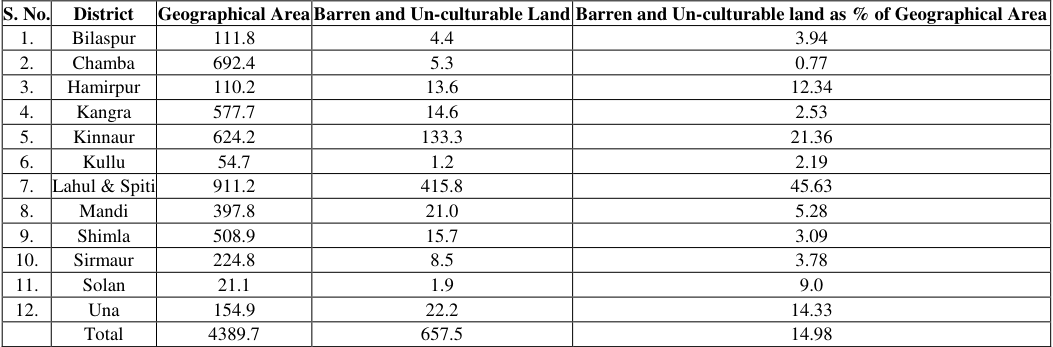 Table 12
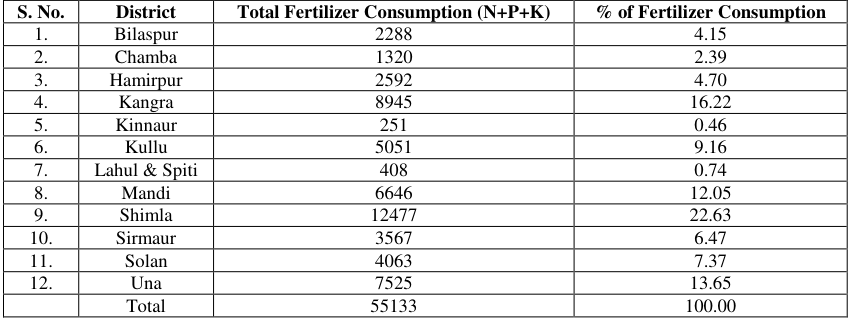 Table 13
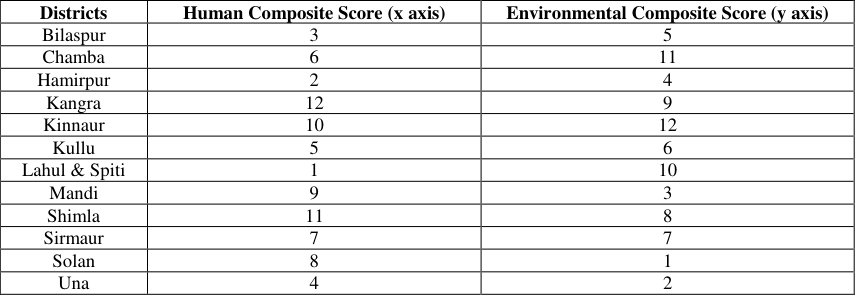 Table 14
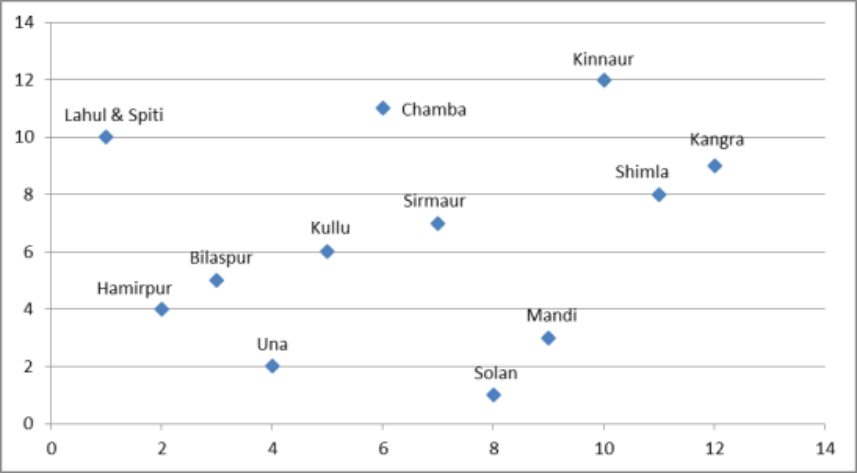 Figure 1
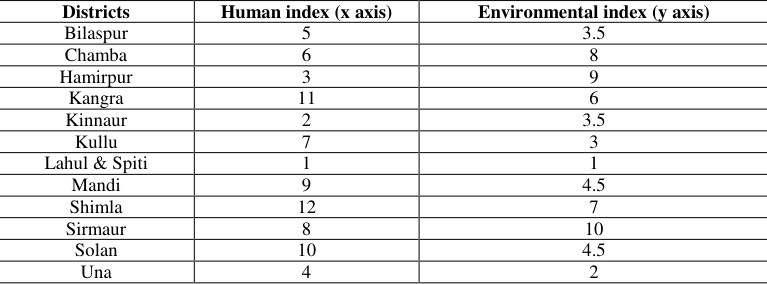 Table 15
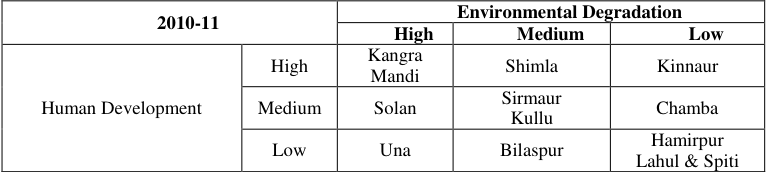 Table 16
 Table 17
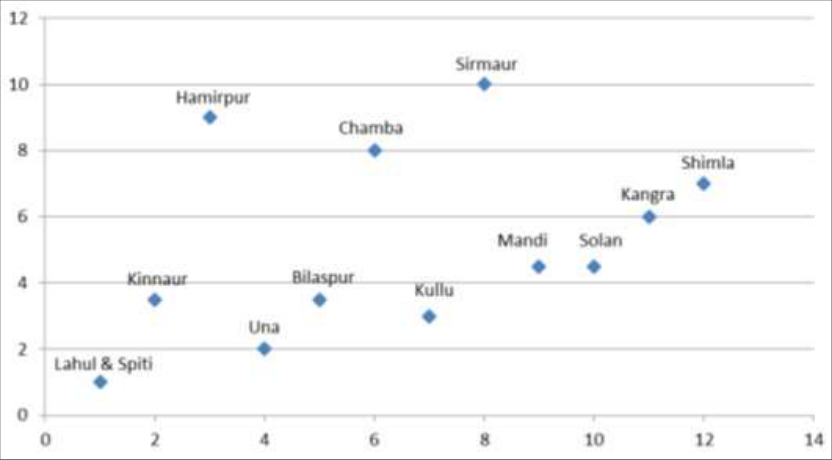 Figure 2
Introduction
High level of human or infrastructural development is generally believed to be the cause of environmental degradation and declining rate of environment quality and natural resources. There has been a long debate between the emphasis on infrastructural development on the one hand and the supporters of better environment quality on the other. Both issues are equally important in terms of human development. Besides, both human development and environment quality have mutual cause and effect relationship. This paper attempts to contribute to this debate with an empirical analysis. The study is based on all twelve districts of Himachal Pradesh. It tries to analyze the structure of the human development with demographic and infrastructural indicators vis-a-vis the level of environmental degradation. It aims to study the impact of human development on the environmental quality of all districts of Himachal Pradesh. Besides, it also studies that in order to achieve the desired goal of development the quality of environment has been degraded in the district or not.
Study Area
The state of Himachal Pradesh has been selected as the study area. The state comprises 12 districts -Bilaspur, Chamba, Hamirpur, Kangra, Kinnaur, Kullu, Lahaul & Spiti, Mandi, Shimla, Sirmaur, Solan and Una, which are further sub-divided into tehsils and sub-tehsils. Despite its mountainous nature, the state shows diversity not only in terms of human dimensions but also in terms of environmental dimensions. On one hand, there is Shimla district which can be termed as the leading district of Himachal Pradesh because of the state capital in the district. The districts manifest itself as the hub of development activities which creates a gravitational pull not only to attract natural resources but human resources also from the neighboring districts. On the other hand, there is the district like Lahul-Spiti where the development level is very low. Therefore, the state represents drastic change in development level from one district to another. Objectives 1. To calculate composite index and component score on the basis of human and environment indicators. 2. To prepare typology of districts on the basis of composite index and component score.
Methodology
Since it is impossible to measure ecosystem or human wellbeing directly, their assessments include selected indicators of each dimension. It is very much essential to know at the start of an assessment how well a given set of indicators represents a desirable combination of human and environmental conditions. Since indicators require the collection and analysis of often large amounts of data, choosing the wrong ones can be a costly mistake (Prescott-Allen, 2001) [7] .
Selection of Variables
The selection of variables is very significant for methodology which depends on certain considerations. First is data availability as it is very crucial that only those variables should be selected to study for which the data is readily and easily available. Besides, there should be consistent availability of data for the period of study. As both the conceptsenvironmental and human dimensionsare dynamic in nature therefore a consistent availability of data is very much crucial. Consequently, it was decided first to take apart the concepts of human and environmental wellbeing to identify the features those need to be measured and those are both representative and measurable. Subsequently, two sets of variables were identified-one reflecting the human dimensions and the other showing the quality of environment. Total nineteen variables were selected and grouped into two sets: Quality of Environment (QOE) and Quality of Life (QOL).
A. Human Indicators
The indicators selected for assessing the quality of life in each of the twelve districts of the Himachal Pradesh number eight in all. These eight indicators are further subdivided into two groupshuman indicators and infrastructural indicators.
Demographic
Demographic
Percentage of Urban population to Total population
It is also referred as a positive indicator of human development. In 2011 the largest percentage of urban population was registered in Shimla district and the lowest percentage was found in Kangra. Lahul & Spiti and Kinnaur are two districts with no urban population (Table 2).
| District | Total Population | Urban Population | Level of Urbanization (%) |
|---|---|---|---|
| Bilaspur | 382056 | 25126 | 6.58 |
| Chamba | 518844 | 36191 | 6.98 |
| Hamirpur | 454293 | 31413 | 6.91 |
| Kangra | 1507223 | 86359 | 5.73 |
| Kinnaur | 84298 | -- | -- |
| Kullu | 437474 | 41258 | 9.43 |
| Lahul & Spiti | 31528 | -- | -- |
| Mandi | 999518 | 62624 | 6.27 |
| Shimla | 813384 | 201500 | 24.77 |
| Sirmaur | 530164 | 57238 | 10.80 |
| Solan | 576670 | 102078 | 17.70 |
| Una | 521057 | 44917 | 8.62 |
| Total | 6856509 | 688704 | 10.04 |
Table text extracted from the original PDF; superscript letters are shown inline. The original table image is below.
View original table image
Percentage of Vacancies to total no. of applicants
Employment is always considered as the positive indicator of human development. The largest percentage of vacancies to total no. of applicants was calculated in Kinnaur district and the lowest was represented by Lahul & Spiti (Table 3).
| District | Applicants on Live Register | Vacancies Notified | Vacancies to Applicants (%) |
|---|---|---|---|
| Bilaspur | 52269 | 100 | 0.19 |
| Chamba | 58139 | 90 | 0.15 |
| Hamirpur | 65184 | 87 | 0.13 |
| Kangra | 185273 | 611 | 0.33 |
| Kinnaur | 7819 | 1483 | 18.97 |
| Kullu | 49398 | 73 | 0.15 |
| Lahul & Spiti | 4234 | 01 | 0.02 |
| Mandi | 147221 | 228 | 0.15 |
| Shimla | 92810 | 527 | 0.57 |
| Sirmaur | 49125 | 1393 | 2.84 |
| Solan | 55681 | 1542 | 2.77 |
| Una | 58611 | 597 | 1.02 |
| Total | 825764 | 6732 | 0.02 |
Table text extracted from the original PDF; superscript letters are shown inline. The original table image is below.
View original table image
Infrastructural Indicators
There are total five infrastructural indicators selected to show the facilities available in the state of Himachal Pradesh.
Level of Education (percentage of primary and high/ secondary schools)
However the literacy rate has already discussed in the demographic indicators but another indicator selected to study the level of education is percentage of primary and high/secondary schools. It shows the availability of education in the district. Kangra and Mandi together show the highest percentage of primary schools followed by Shimla whereas Kinnaur and Lahul & Spiti show the lowest percentage of primary schools (Table 4).
| District | Primary Schools | — | High/Sr. Schools | — |
|---|---|---|---|---|
| No. | (%) | No. | (%) | |
| Bilaspur | 600 | 6 | 127 | 6 |
| Chamba | 1125 | 10 | 172 | 8 |
| Hamirpur | 505 | 5 | 134 | 6 |
| Kangra | 1768 | 16 | 408 | 19 |
| Kinnaur | 190 | 2 | 49 | 2 |
| Kullu | 746 | 7 | 105 | 5 |
| Lahul & Spiti | 206 | 2 | 35 | 2 |
| Mandi | 1739 | 16 | 326 | 16 |
| Shimla | 1625 | 15 | 307 | 15 |
| Sirmaur | 988 | 9 | 152 | 7 |
| Solan | 769 | 7 | 139 | 7 |
| Una | 508 | 5 | 140 | 7 |
| Total | 10767 | 100 | 2094 | 100 |
Table text extracted from the original PDF; superscript letters are shown inline. The original table image is below.
View original table image
Medical Institutions (percentage of primary health centers and community health centers)
To represent the availability of medical facilities in the district two indicators are selected-the community health centers and the primary health centers. The highest percentage of community health centers is found in Kangra followed by Mandi and Shimla for both data years whereas Kinnaur, Lahul & Spiti and Sirmaur are the lowest. In terms of primary health centers, Kangra is the leading district followed by Shimla and Mandi in 2011 (Table 5).
| District | CHC | — | PHC | — | Total |
|---|---|---|---|---|---|
| No. | % | No. | % | ||
| Bilaspur | 6 | 8 | 30 | 7 | 36 |
| Chamba | 7 | 9 | 42 | 9 | 49 |
| Hamirpur | 5 | 6 | 26 | 6 | 31 |
| Kangra | 14 | 18 | 77 | 17 | 91 |
| Kinnaur | 4 | 5 | 21 | 5 | 25 |
| Kullu | 6 | 8 | 17 | 4 | 23 |
| Lahul & Spiti | 3 | 4 | 16 | 4 | 19 |
| Mandi | 12 | 16 | 61 | 13 | 73 |
| Shimla | 7 | 9 | 77 | 17 | 84 |
| Sirmaur | 3 | 4 | 36 | 8 | 39 |
| Solan | 5 | 6 | 31 | 7 | 36 |
| Una | 5 | 6 | 19 | 4 | 24 |
| Total | 77 | 100 | 453 | 100 | 530 |
Table text extracted from the original PDF; superscript letters are shown inline. The original table image is below.
View original table image
Communication (percentage of telephone connections)
Telephone connection displays the level of communication facilities available in the district. In reference to the state of Himachal Pradesh Kangra is the largest district followed by Shimla and Kullu. Lahul & Spiti and Kinnaur are the districts with lowest percentage telephone connections (Table 6).
| District | Telephone Connections | Telephone Connections (%) |
|---|---|---|
| Bilaspur | 25725 | 5 |
| Chamba | 19733 | 3.8 |
| Hamirpur | 45323 | 8.8 |
| Kangra | 112390 | 21.7 |
| Kinnaur | 9608 | 1.9 |
| Kullu | 30513 | 5.9 |
| Lahul & Spiti | 2355 | 0.5 |
| Mandi | 69606 | 13.4 |
| Shimla | 83153 | 16.1 |
| Sirmaur | 25654 | 5.4 |
| Solan | 53107 | 10.3 |
| Una | 40458 | 7.8 |
| Total | 517625 | 100 |
Table text extracted from the original PDF; superscript letters are shown inline. The original table image is below.
View original table image
Electricity (percentage of electrified villages)
Electricity facility has become the basic need of present time. The percentage of electrified villages shows whether the electricity facility is under the reach of rural people or not. In Himachal Pradesh, the data shows that the electricity is available at very good rate in villages. There are total seven districts out of twelve in Himachal Pradesh show the hundred percent availability of electricity in villages in 2011 (Table 7).
| District | Inhabited Villages | Electrified Villages | % of Villages Electrified |
|---|---|---|---|
| Bilaspur | 965 | 965 | 100.00 |
| Chamba | 1118 | 1118 | 100.00 |
| Hamirpur | 1635 | 1635 | 100.00 |
| Kangra | 3619 | 3619 | 100.00 |
| Kinnaur | 234 | 214 | 90.60 |
| Kullu | 172 | 172 | 100.00 |
| Lahul & Spiti | 287 | 267 | 91.29 |
| Mandi | 2833 | 2830 | 99.68 |
| Shimla | 2520 | 2449 | 97.18 |
| Sirmaur | 966 | 966 | 100.00 |
| Solan | 2388 | 2388 | 100.00 |
| Una | 758 | 575 | 75.86 |
| Total | 17495 | 17209 | 98.37 |
Table text extracted from the original PDF; superscript letters are shown inline. The original table image is below.
View original table image
Banking (credit deposit ratio)
The credit deposit ratio is generally used to reveal the saving of people in the district. The largest credit deposit ratio is found in Sirmaur district whereas the lowest credit deposit ratio is shown by Lahul & Spiti and Hamirpur (Table 8).
| District | No. of Banks | Deposits (D) | Credits (C) | C-D Ratio |
|---|---|---|---|---|
| Bilaspur | 56 | 1126 | 409 | 36.32 |
| Chamba | 58 | 1086 | 382 | 35.17 |
| Hamirpur | 71 | 2075 | 428 | 20.63 |
| Kangra | 199 | 5895 | 148 | 25.24 |
| Kinnaur | 24 | 352 | 145 | 41.19 |
| Kullu | 67 | 1613 | 752 | 46.62 |
| Lahul & Spiti | 11 | 151 | 34 | 22.52 |
| Mandi | 125 | 2785 | 1086 | 39.0 |
| Shimla | 171 | 9532 | 349 | 36.62 |
| Sirmaur | 66 | 1021 | 914 | 89.52 |
| Solan | 131 | 3210 | 2459 | 76.60 |
| Una | 74 | 1999 | 705 | 35.27 |
| Total | 1053 | 30847 | 12296 | 39.86 |
Table text extracted from the original PDF; superscript letters are shown inline. The original table image is below.
View original table image
Environmental Indicators
To assess the quality of environment, a set of six indicators has been selected. All six indicators of environmental quality are based on status of natural resources. The dynamic nature of environment allows us to classify the environment quality indicators. The environmental indicators which are used in the study can be categorized into positive and negative indicators based on their influence on the environment.
Positive Indicators Percentage of forest land to total geographical area
The forest, generally, implies a continuous vegetation cover whether densely or openly associated. It is regarded as a positive variable in reference to environmental quality. The proportion of forest land in a state denotes the forest resource reserved for the future. The availability of forest resource is a positive indicator of environmental quality. In terms of percentage of forest land Mandi is the largest district followed by Kangra (Table 9).
| S. No. | District | Geographical Area | Forest land | Forest land as % of Geographical Area |
|---|---|---|---|---|
| 1. | Bilaspur | 111.8 | 14.0 | 12.52 |
| 2. | Chamba | 692.4 | 272.0 | 39.28 |
| 3. | Hamirpur | 110.2 | 18.3 | 16.60 |
| 4. | Kangra | 577.7 | 232.5 | 40.24 |
| 5. | Kinnaur | 624.2 | 37.5 | 6.0 |
| 6. | Kullu | 54.7 | NA | NA |
| 7. | Lahul & Spiti | 911.2 | 135.4 | 14.85 |
| 8. | Mandi | 397.8 | 175.2 | 44.04 |
| 9. | Shimla | 508.9 | 130.4 | 25.62 |
| 10. | Sirmaur | 224.8 | 48.3 | 21.48 |
| 11. | Solan | 21.1 | 0.4 | 1.89 |
| 12. | Una | 154.9 | 8.2 | 5.29 |
| Total | 4389.7 | 1083.1 | 23.89 |
Table text extracted from the original PDF; superscript letters are shown inline. The original table image is below.
View original table image
Percentage of culturable wasteland to total geographical area
Cultural wasteland is also considered as the positive indicator of environmental quality as it implies the availability of land for expansion of agricultural activities without negative impact on the environment. The highest percentage of culturable wasteland is found in Una district whereas Lahul & Spiti display the lowest percentage (Table 10).
| S. No. | District | Geographical Area | Culturable Wasteland | Culturable Wasteland as % of Geographical Area |
|---|---|---|---|---|
| 1. | Bilaspur | 111.8 | 6.2 | 5.54 |
| 2. | Chamba | 692.4 | 6.4 | 0.92 |
| 3. | Hamirpur | 110.2 | 12.2 | 11.07 |
| 4. | Kangra | 577.7 | 29.1 | 5.03 |
| 5. | Kinnaur | 624.2 | 3.5 | 0.56 |
| 6. | Kullu | 54.7 | 2.4 | 4.38 |
| 7. | Lahul & Spiti | 911.2 | 0.6 | 0.06 |
| 8. | Mandi | 397.8 | 4.5 | 1.13 |
| 9. | Shimla | 508.9 | 21.2 | 4.16 |
| 10. | Sirmaur | 224.8 | 12.5 | 5.56 |
| 11. | Solan | 21.1 | 1.4 | 6.63 |
| 12. | Una | 154.9 | 23.2 | 14.97 |
| Total | 4389.7 | 123.2 | 2.80 |
Table text extracted from the original PDF; superscript letters are shown inline. The original table image is below.
View original table image
Percentage of current fallow land to total net sown area
The proportion of net sown area currently left under fallow land reflects the chances of natural rejuvenation of the soil without excessive chemical fertilizers. Kinnaur district shows the highest figure in this category for whereas the lowest ranked district was Chamba (Table 11).
| S. No. | District | Net Sown Area | Current Fallow land | Current fallow land as % of net sown area |
|---|---|---|---|---|
| 1. | Bilaspur | 30.4 | 1.7 | 5.59 |
| 2. | Chamba | 41.7 | 2.2 | 5.28 |
| 3. | Hamirpur | 35.8 | 4.9 | 13.69 |
| 4. | Kangra | 116.9 | 10.0 | 8.55 |
| 5. | Kinnaur | 7.9 | 1.7 | 21.52 |
| 6. | Kullu | 37.2 | 3.2 | 8.60 |
| 7. | Lahul & Spiti | 3.3 | NA | NA |
| 8. | Mandi | 86.4 | 9.8 | 11.34 |
| 9. | Shimla | 67.5 | 13.1 | 19.41 |
| 10. | Sirmaur | 40.5 | 5.2 | 12.84 |
| 11. | Solan | 3.3 | 0.5 | 15.15 |
| 12. | Una | 37.0 | 3.5 | 9.46 |
| Total | 507.9 | 55.8 | 10.99 |
Table text extracted from the original PDF; superscript letters are shown inline. The original table image is below.
View original table image
Percentage of fertilizer consumption
The percentage of fertilizer consumption is also used as a negative indicator of environmental quality because the excessive use of fertilizer results into the loss of soil fertility. Shimla and Kangra are the two largest district in terms of fertilizer consumption followed by Una and Mandi whereas Kinnaur and Lahul & Spiti are two lowest districts in reference to fertilizer consumption (Table 13).
| S. No. | District | Total Fertilizer Consumption (N+P+K) | % of Fertilizer Consumption |
|---|---|---|---|
| 1. | Bilaspur | 2288 | 4.15 |
| 2. | Chamba | 1320 | 2.39 |
| 3. | Hamirpur | 2592 | 4.70 |
| 4. | Kangra | 8945 | 16.22 |
| 5. | Kinnaur | 251 | 0.46 |
| 6. | Kullu | 5051 | 9.16 |
| 7. | Lahul & Spiti | 408 | 0.74 |
| 8. | Mandi | 6646 | 12.05 |
| 9. | Shimla | 12477 | 22.63 |
| 10. | Sirmaur | 3567 | 6.47 |
| 11. | Solan | 4063 | 7.37 |
| 12. | Una | 7525 | 13.65 |
| Total | 55133 | 100.00 |
Table text extracted from the original PDF; superscript letters are shown inline. The original table image is below.
View original table image
Mean deviation method
The technique is applied to interpret the relationship between human development and the environment by reducing the multidimensional data into a single dimension. Firstly, the actual data of human indicators and the environmental indicators was converted into percentages. Secondly, the mean was calculated indicator wise by adding the percentage values and dividing by the total number of districts. Subsequently, the percentage values are divided by the mean in regard to positive indicators viz, sex ratio, literacy rate, etc. for human development and forest, culturable wasteland, etc. for environmental quality. In terms of negative indicators the mean is divided by the percentage values for both types of indicators.
The calculated values of all human indicators and environmental indicators were added and divided by the total number of indicators. In other words, the calculated values were added and the sum total was divided by eight (number of variables) for human indicators and five for environmental indicators. The process is followed for all districts. Thus, the state wise composite score of both types of indicators are calculated. Then each district was assigned a rank based on its composite score where rank 1 was assigned to a state exhibiting low composite score and vice versa.
Level of Human development and level of Environmental Degradation (2010-11)
The high human development and high level of environmental degradation is shown by the districts of Kangra and Mandi in 2010-11. Shimla is still coming under the category of high human development but in terms of environmental degradation it has improved from high environmental degradation to medium environmental degradation district. Kinnaur is still ranked as the low environmental degradation district but in terms of human development it has upgraded from medium to high category (Fig. 1).
Figures and tables from the paper
| District | Male Literacy Rate (%) | Female Literacy Rate (%) | Total Literacy Rate (%) |
|---|---|---|---|
| Bilaspur | 92.39 | 78.90 | 85.67 |
| Chamba | 84.19 | 62.14 | 73.19 |
| Hamirpur | 95.28 | 83.44 | 89.01 |
| Kangra | 92.55 | 80.62 | 86.49 |
| Kinnaur | 88.37 | 71.34 | 80.77 |
| Kullu | 88.80 | 71.01 | 80.14 |
| Lahul & Spiti | 86.97 | 66.50 | 77.24 |
| Mandi | 91.51 | 74.33 | 82.81 |
| Shimla | 90.73 | 77.80 | 84.55 |
| Sirmaur | 86.76 | 72.55 | 79.98 |
| Solan | 91.19 | 78.02 | 85.02 |
| Una | 92.75 | 81.67 | 87.23 |
| Total | 90.83 | 76.60 | 83.78 |
Table text extracted from the original PDF; superscript letters are shown inline. The original table image is below.
View original table image
| S. No. | District | Geographical Area | Barren and Un-culturable Land | Barren and Un-culturable land as % of Geographical Area |
|---|---|---|---|---|
| 1. | Bilaspur | 111.8 | 4.4 | 3.94 |
| 2. | Chamba | 692.4 | 5.3 | 0.77 |
| 3. | Hamirpur | 110.2 | 13.6 | 12.34 |
| 4. | Kangra | 577.7 | 14.6 | 2.53 |
| 5. | Kinnaur | 624.2 | 133.3 | 21.36 |
| 6. | Kullu | 54.7 | 1.2 | 2.19 |
| 7. | Lahul & Spiti | 911.2 | 415.8 | 45.63 |
| 8. | Mandi | 397.8 | 21.0 | 5.28 |
| 9. | Shimla | 508.9 | 15.7 | 3.09 |
| 10. | Sirmaur | 224.8 | 8.5 | 3.78 |
| 11. | Solan | 21.1 | 1.9 | 9.0 |
| 12. | Una | 154.9 | 22.2 | 14.33 |
| Total | 4389.7 | 657.5 | 14.98 |
Table text extracted from the original PDF; superscript letters are shown inline. The original table image is below.
View original table image
| Districts | Human Composite Score (x axis) | Environmental Composite Score (y axis) |
|---|---|---|
| Bilaspur | 3 | 5 |
| Chamba | 6 | 11 |
| Hamirpur | 2 | 4 |
| Kangra | 12 | 9 |
| Kinnaur | 10 | 12 |
| Kullu | 5 | 6 |
| Lahul & Spiti | 1 | 10 |
| Mandi | 9 | 3 |
| Shimla | 11 | 8 |
| Sirmaur | 7 | 7 |
| Solan | 8 | 1 |
| Una | 4 | 2 |
Table text extracted from the original PDF; superscript letters are shown inline. The original table image is below.
View original table image
| Districts | Human index (x axis) | Environmental index (y axis) |
|---|---|---|
| Bilaspur | 5 | 3.5 |
| Chamba | 6 | 8 |
| Hamirpur | 3 | 9 |
| Kangra | 11 | 6 |
| Kinnaur | 2 | 3.5 |
| Kullu | 7 | 3 |
| Lahul & Spiti | 1 | 1 |
| Mandi | 9 | 4.5 |
| Shimla | 12 | 7 |
| Sirmaur | 8 | 10 |
| Solan | 10 | 4.5 |
| Una | 4 | 2 |
Table text extracted from the original PDF; superscript letters are shown inline. The original table image is below.
View original table image
| 2010-11 | — | Environmental Degradation | — | — |
|---|---|---|---|---|
| High | Medium | Low | ||
| Human Development | High | Kangra Mandi | Shimla | Kinnaur |
| Medium | Solan | Sirmaur Kullu | Chamba | |
| Low | Una | Bilaspur | Hamirpur Lahul & Spiti |
Table text extracted from the original PDF; superscript letters are shown inline. The original table image is below.
View original table image
References
0 in the original paperCited by 9
From OpenAlex, OpenCitations and reference lists read by Scinovex
- Reimagining Sustainable Development and Economic Performance Indicators: A Human-Centric Maslow–Bossel Blueprint ↗
Panagiotis Panagiotopoulos, Ioannis Vardopoulos, Marco Maialetti, Clio Ciaschini, Phoebe Koundouri, Luca Salvati · Economies · 2024
Reflecting the shift from purely quantitative economic growth to broader socio-environmental sustainability, this study proposes a framework for assessing sustainable development (SD) by integrating Maslow’s hierarchy of needs with Bossel’s classification system. As economic development increasingly emphasizes sustainability, numerous organizations and agencies, including the United Nations, have developed indicators to measure sustainable progress. However, subjective dimensions of SD, grounded in…
❝ 19PDF - Studies of hydrology, water distribution networks and transmission lines, topographic, physical and socio-economic characteristics of west Kordofan ↗
Abdel Hamid Balla Elnour, K. Sami · International Journal of Multidisciplinary Trends · 2025
The main objectives of the consultancy as depicted by this Article are to describe and avail Physical and Socioeconomic data/ information for the West Kordofan State project of villages and towns benefiting from the construction of detailed engineering designs for water distribution networks to supply the fourteen headquarters towns in the state, together with the design of a water transmission
- Greening the gears: A thematic analysis of sustainable supply chain practices in the Indian automobile sector ↗
Monika Sharma, Deepak Kapur, Suveera Gill · International Journal of Research in Management · 2025
The study presents a thematic analysis of sustainable supply chain management practices within the Indian automobile industry. Eight themes are identified in this study, including sustainability and green initiatives, supply chain resilience and management, technological innovation and integration, impact on environment and resource management, circular economy and waste management, compliance with regulatory requirements and industry standards, supplier engagement and development,
- A review of predominance of gross national income in human development index during COVID-19 crisis ↗
Shem Otoi Sam · International Journal of Financial Management and Economics · 2025
The study explores the role of gross national income (GNI) in the Human Development Index (HDI), a key measure of social progress tied to the Sustainable Development Goals. Using 2021 macroeconomic data from 170 countries, the analysis applies principal component analysis (PCA) and logistic regression to evaluate the relative contribution of HDI predictors: GNI, life expectancy (LE), and mean years
- The role of health for achieving sustainable development of India ↗
Shikhar Agrawal, Vrushangi Gandhi · International Journal of Social Science and Education Research · 2025
Healthcare is essential for human development. This study examines the impact of health indicators, such as Life Expectancy and Infant Mortality Rate, on the Human Development Index [HDI] for the years 2011-2020, and 2023-24. The study revealed that Life Expectancy has a positive impact, and the Infant Mortality Rate has a negative effect on the HDI. This paper also examines
❝ 0Found by Scinovex - Impact of digitalization on sustainable development amidst geopolitical risks ↗
S. Vazeed Pasha · International Journal of Applied Research · 2025
This study examines how digitalization influences sustainable development amid rising geopolitical risks. Using Environmental Performance Index (EPI) and Human Development Index (HDI) as proxies, the analysis evaluates the role of macroeconomic indicators, digital economy measures, and the Global Geopolitical Risk Index (GPRI). Findings show that digitalization enhances environmental performance and socio-economic development in both developed and developing countries, while geopolitical
- The role of evaluation smart agriculture technology to improve climate changes management in Salah al-Din Governorate
Asmaa Zuhir Al-Hafdh, Waleed Sabar Ayed · International Journal of Agriculture Extension and Social Development · 2025
This research, aims to explain differences in the role of evaluation smart agriculture technology to improve climate changes management in Salah al-Din Governorate; comprise climate change forecasting implementation; intelligent watering implementations; insect threat & disease regulation implementations regional yield & sustainable promotion implementations, & crop management implementations. Survey was split into: two divisions first addressed personal factors; whereas latter included 40 statements throughout five scale. This study including 78 farming staffs with 20 respondent in the initia
- Urban Futures: Coordinated Urbanization as a Catalyst for Ethiopia’s Development ↗
Vivek Kumar · International Journal of Political Science and Governance · 2025
The process of urbanization is among the most revolutionary processes that influence the social economic and political environment across the globe. Ethiopia has one of the lowest urbanization rates in Sub-Saharan Africa and the rapid urbanization process in the country is being induced by rural-to-urban migration and natural population growth. The economic growth caused by planned and well-organized urban development
- Sustainability unleashed: Supercharging economic growth through green HR strategies ↗
Tom Janisch, Issah Gyimah · International Journal of Research in Human Resource Management · 2024
This paper describes a semi-systematic literature review that examines how human resource professionals and scholars investigate the relationship between human resource work and green sustainable practices in organizations. The study analyzed the literature on human resources with a focus on sustainability, using the Rummler-Brache model of organizational performance as a framework. The model's nine performance variables were applied to the