
Research article · 2023 · Full text
International Journal of Agriculture and NutritionFactors influencing export of haricot bean in Ethiopia
Volume 5(1) · Pages 19–27 · DOI: 10.33545/26646064.2023.v5.i1a.94 ↗
Research areasGlobal Trade and CompetitivenessAgricultural Economics and Practices
Abstract
Author-writtenThe objective of this study is to analyze factors influencing the export level of haricot beans in Ethiopia over the period 1981 to 2020. The study applied an ARDL model bound test approach. The study portrayed that GDP, export price, real exchange rate, and inflation rate had positive and significant impact on the level of haricot bean export. GDP showed positive and significant impact of GDP on export of haricot beans because higher economic growth of a nation will create higher capacity to export the product. A one period lagged export quantity, GDP, export price, and real exchange rate had negative impact on current export level of haricot beans. The negative and significant effect of lagged real exchange rate exemplifies that the shocks in real exchange rate during preceding year will discourage exporters to participate in international trade in subsequent year. Haricot beans producer price had negative impact on current year’s haricot beans export level in both the long- and short-run, implying that the volatility of domestic prices will discourage exporters to engage in foreign export trade. Real exchange rate revealed negative and significant impact on haricot beans export level in the short-run while it had positive and significant impact on haricot bean export in the long-run. Conversely, GDP, export price, and inflation rate had positive impact on current year’s export level of haricot bean both in the long- and short-run. In view the results of this study, it is recommended that the macroeconomic policy reforms aimed at improving the growth of GDP that enhances the total export supply of the countries to the rest of the world should be taken. The significant relationship between the real exchange rate and export performance indicates the need to ensure a stable exchange rate policy in order to avoid the exchange rate risk.
Summary
Source-checkedPlain-language reading of the full paper, prepared with AI and checked against the text. Each point links to the authors' own words.
Why it matters
- The haricot bean is a primary pulse crop for Ethiopian smallholders and ranks as the third largest agricultural export commodity by value. View evidence ↗
The question
- The study aims to analyze the factors that influenced the export levels of haricot beans in Ethiopia from 1981 to 2020. View evidence ↗
What they did
- The researchers used secondary time-series data focusing on export quantities, production volume, GDP, export and producer prices, real exchange rates, and inflation rates. View evidence ↗
- An autoregressive distributed lag (ARDL) model was used to determine the co-integration relationship between the variables. View evidence ↗
- The study employed Augmented Dickey-Fuller (ADF) and Philips-Perron (PP) tests to check for unit roots in the data series. View evidence ↗
What they found
- In the long run, a 1% increase in GDP, export price, real exchange rate, and inflation rate leads to export increases of 0.35%, 1.245%, 0.62%, and 0.3%, respectively. View evidence ↗
- Long-term analysis shows that a 1% increase in the previous year's export level or the producer price results in a decrease in current exports by 0.56% and 1.1%, respectively. View evidence ↗
- In the short run, a 1% increase in the previous year's export quantity or the current producer price decreases exports by 1.26% and 2.4%, respectively. View evidence ↗
- Short-term results indicate that a 1% increase in lagged GDP and lagged real exchange rate causes current exports to decline by 3.34% and 6.99%, respectively. View evidence ↗
- The model's error correction coefficient of -0.391 indicates that deviations from long-run equilibrium are corrected at a rate of 39% per year. View evidence ↗
What it means
- The authors recommend macroeconomic reforms to improve GDP growth and the implementation of a stable exchange rate policy to mitigate risk and enhance export supply. View evidence ↗
Visual summary
2 visualsIllustrations explain the paper; charts are replotted from the paper's own table values.
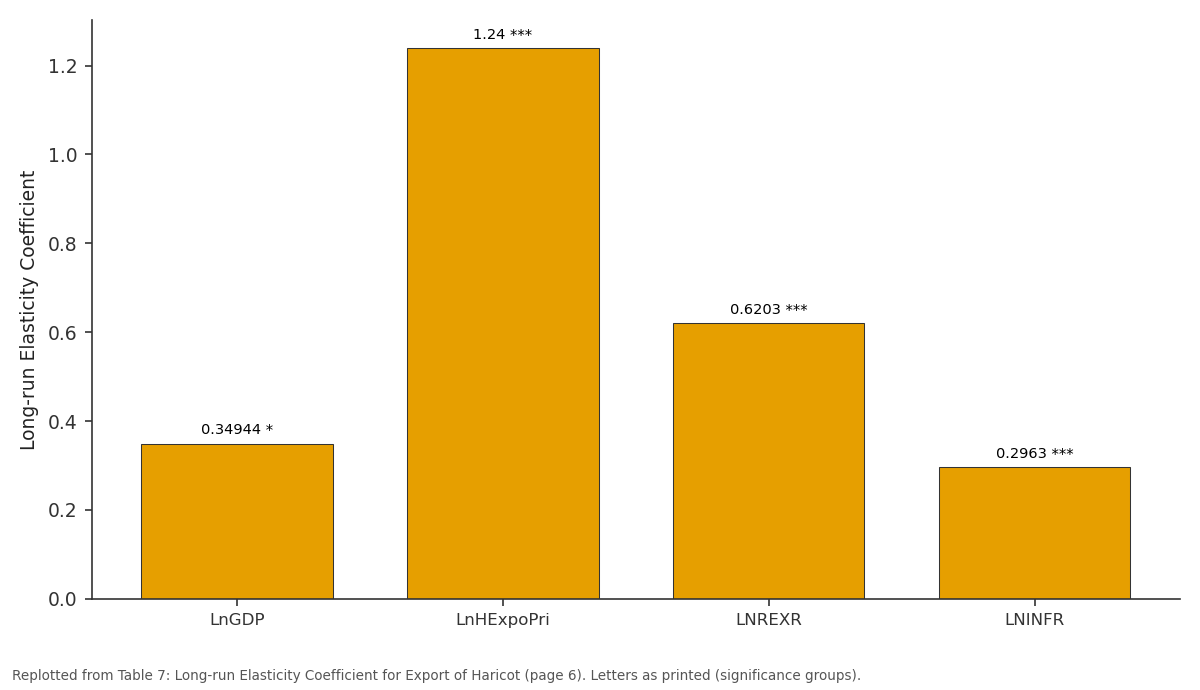
Coefficient: LnGDP vs LnHExpoPri vs LNREXR vs LNINFR
Replotted from Table 7 (page 6) of the original paper. Every bar is the paper's own table value.
View source evidence ↗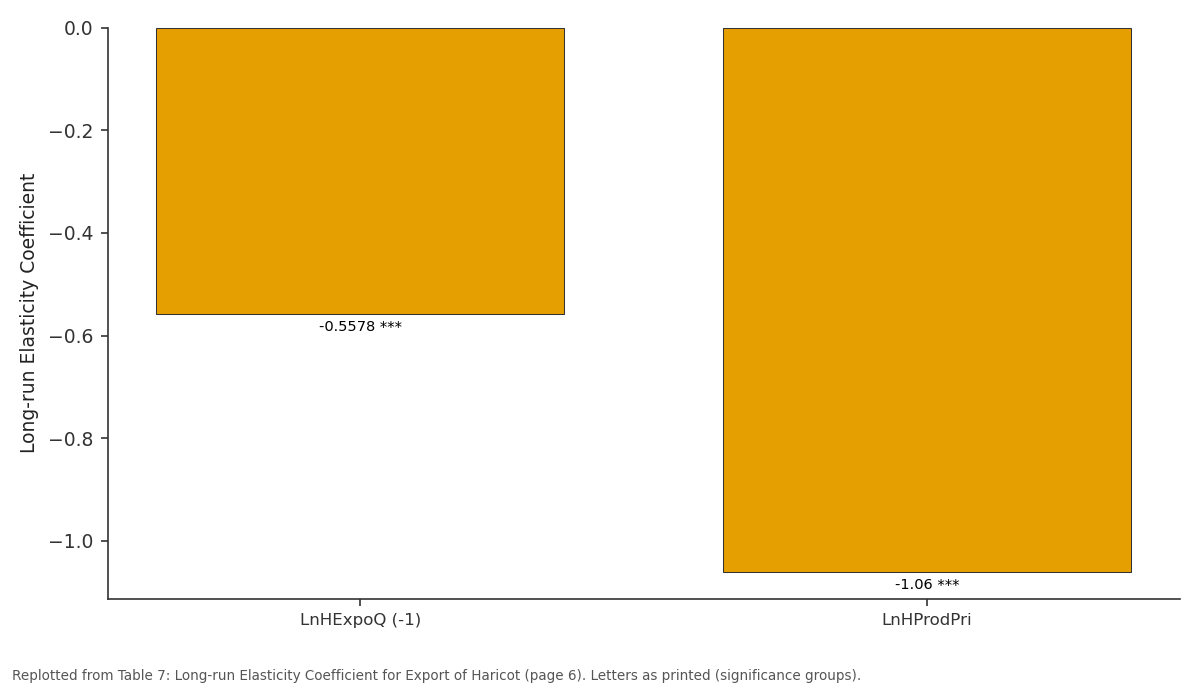
Coefficient: LnHExpoQ (-1) vs LnHProdPri
Replotted from Table 7 (page 6) of the original paper. Every bar is the paper's own table value.
View source evidence ↗Figures & tables
From the original paper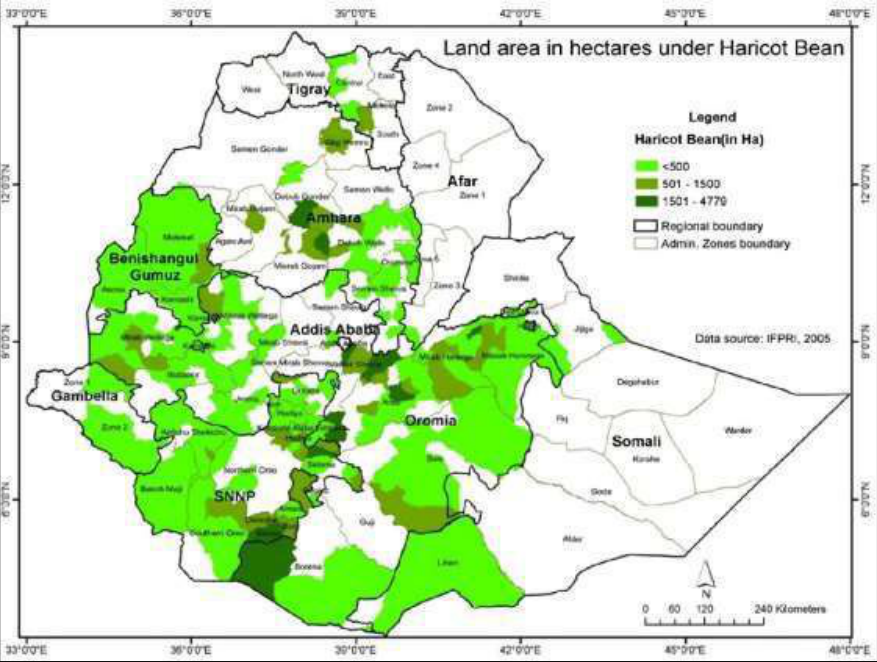 Figure 1
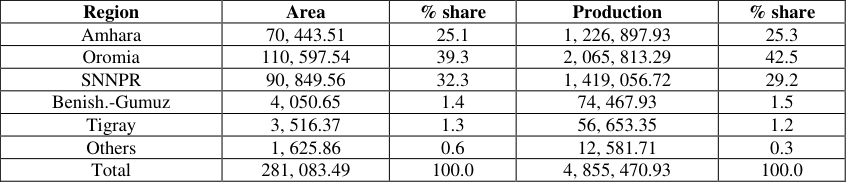 Table 1
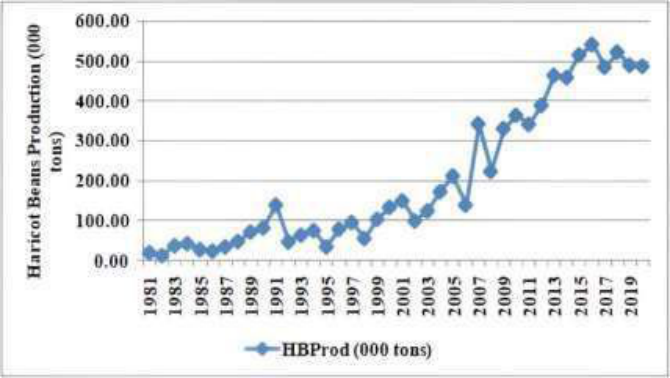 Figure 2
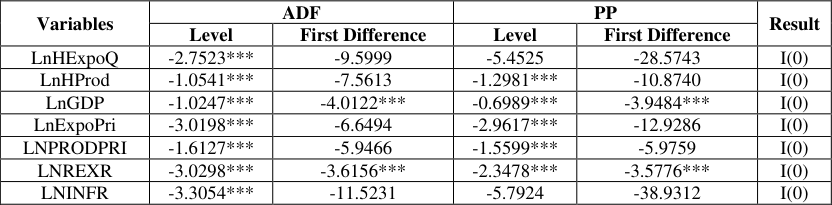 Table 2
 Table 3
 Table 4
 Table 5
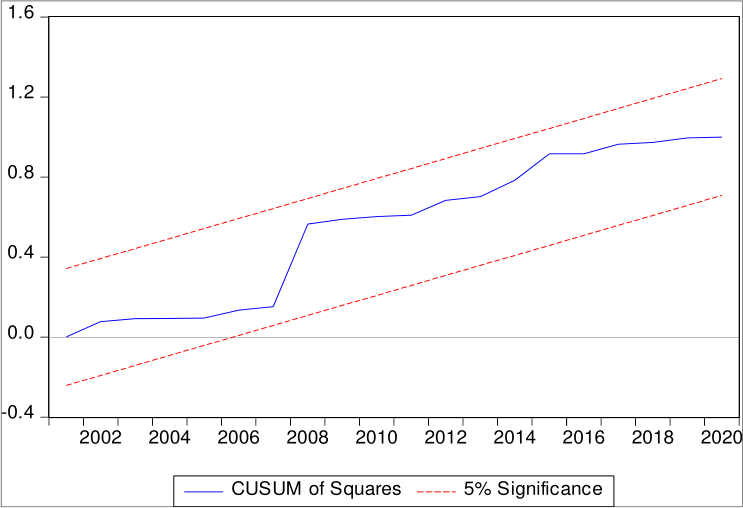 Figure 3
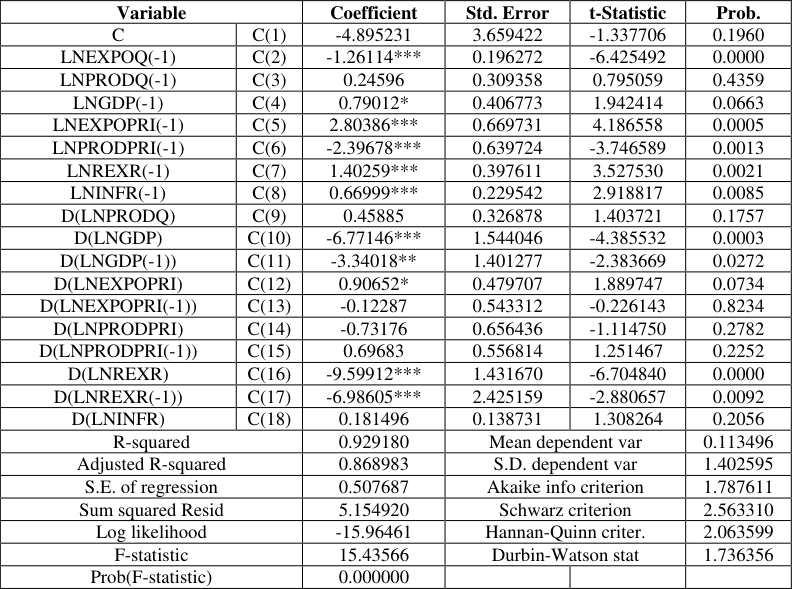 Table 6
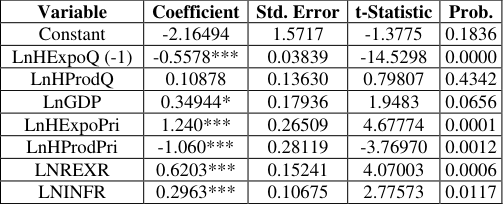 Table 7
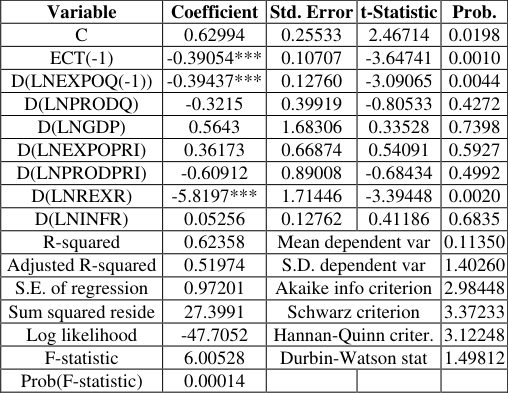 Table 8
Introduction
With varied agro-ecological zones and diversified natural resources, Ethiopia has been known as home land and domestication of several crops. Pulse crops are among these crops cultivated, consumed and marketed in large quantities in the country for many years (Ali, et al., 2014) [5] . Pulse crops play important role in achieving food security and contributing to the economy through export earnings (Francom, 2018) [12] . In 2018, exports of pulse crops reached 340, 000 metric tons, generating US$ 255 million foreign currency. Pulse exports are the third largest foreign currency earner after coffee and oilseeds. Haricot bean (Phaseolus vulgaris L.) is among the major pulse crops cultivated by smallholder farmers of Ethiopia and exported to foreign markets for more than 50 years and probably been grown as food crop for a much longer period in the low and mid land altitude areas of the country (Lemu, 2016) [16] . It is the second-largest crop among pulse crops and third export commodity from the total export value of agriculture in Ethiopia (CSA, 2019) [9] . It is used as food crop, source of foreign currency, and as means of employment. Haricot bean production in Ethiopia takes place almost in all regions with varying degree in the low and mid altitude Agro-ecologies. However, almost all haricot bean production (more than 99 percent) of the country comes from five major haricot beans producing regions: Oromia, Southern Nations Nationalities and Peoples Region (SNNPR), Amhara, Benishangul-Gumuz, and Tigray (Abele and Tefera, 2015) [2] . According to Kassie (2018) [14] , haricot bean has been an export pulse crop for Ethiopia for more than 50 years and probably been grown as food crop for a much longer period in the low and mid land altitude areas of the country. Although haricot bean remained the significant contributors to the export sector and the economy, its export became worsening in the past decade (Abdulkadir, 2020) [1] foreign price level, production level, quality of products, real exchange rate, and infrastructure (Rural road feeders) are an independent variables that determines the export performance pulses. Furthermore, Sawore (2015) [20] cites the main factors influencing the export level of haricot bean as low level of production, export price instability, volatility of domestic prices, and exchange rates. Hence, it becomes vital to further assess and identify factors influencing the export quantity of haricot bean in Ethiopia. Such a study and analysis particularly at national level is limited. Some researchers have conducted studies on haricot bean in specific areas, however, the studies mainly focused on production aspect and did not address issues related to market supply and export performance conducted a study on market access, intensification and productivity of common bean in Ethiopia. The study mainly concentrated on production issue but not on market supply and export issues on his part conducted a study on technical efficiency of haricot bean production in Misrak Badawacho Wereda, Hadiya Zone, Ethiopia. However, the study mainly considered on production efficiency and did not address issues related to market supply and export market. It was also focused on single pocket area rather than covering wider area. Generally, other studies were also conducted on market chain of haricot beans in different areas and there is no empirical study on export of haricot beans at national level. In order to fill this research gaps, this study examines the factors that determine haricot beans export trade in Ethiopia and its dynamics. The main objective of the study is to analyze factors influencing the export level of haricot beans in the country.
Materials and Methods
Materials and Methods
Description of Study Area
The study was conducted in Ethiopia covering the major haricot bean growing belts of Ethiopia. With a total area of 1.1 million km 2 , Ethiopia is located in East Africa and bounded with Eritrea in the north, Djibouti in the east, Somalia to the east and south east, Kenya in the south, South Sudan in the south west, and Sudan in the west (FAO, 2016) [11] . The country's latitudinal and longitudinal locations are between 3 o to 15 o N and 33 o to 48 o E, respectively. The country is administratively divided into four levels: regions/ city administrations, zones, woredas, and the Kebeles. According to the United Nations Population Fund (2021), the population of Ethiopia has reached 117.90 million with an annual growth rate of 2.6 percent. According to Zenebe (2016) [22] , Haricot beans (Phaseolus vulgaris legume) are one of the major types of pulses grown in Ethiopia especially in the lowlands and in the rift valley. In Ethiopia, haricot bean best suits with an altitude between 1200 to 2200 meters above sea level (M.A.S.L), having maximum and minimum temperature mean of less than 30 to 32 °C and greater than 10 to 12 °C, respectively, and a rainfall of 350 to 500 mm well distributed over 70 to 100 days (Merga, 2021) [24] . The major haricot beans producing regions in Ethiopia are Oromia, SNNPR, Amhara, Benshangul Gumuz, and Tigray (see Fig. 1 for the map), which contribute more than 99% of total haricot bean output. In 2019/20 agricultural production, Oromia took the lion share (42.5%) of haricot bean production in the country, followed by SNNPR (29.2%), Amhara (25.3%) Benishangul-Gumuz 1.5% and the other regions contributed the rest to the country's total production (see Table 1). Although suitable agro-ecologies are available for haricot beans production, there is no stability in the production and export the crop over the years. Figure 2 presents the trend of haricot beans production and export volumes from 1981 to 2021. It can be been that both production and export quantities followed the same trend, i.e. increasing over the period from 1981 to 2014 and then started declining. The quantities of production and export of haricot beans were almost stagnant from 1981 to 1995 (Ranging between 19, 650-33, 870 tons for production and between 2, 000 -22, 551 tons for export quantities). Starting from 1996, the production volume has increased from 78, 360 tons to 540, 240 tons in 2016 and then started declining. Similarly, the export volume increased from 36, 650 in 1996 to 227, 633 tons in 2014 and then continuously declined up to 2021. The trend of haricot beans export performance particularly from the year 2015 gives clue for the poor export performance calling for policy interventions.
| Region | Area | % share | Production | % share |
|---|---|---|---|---|
| Amhara | 70, 443.51 | 25.1 | 1, 226, 897.93 | 25.3 |
| Oromia | 110, 597.54 | 39.3 | 2, 065, 813.29 | 42.5 |
| SNNPR | 90, 849.56 | 32.3 | 1, 419, 056.72 | 29.2 |
| Benish.-Gumuz | 4, 050.65 | 1.4 | 74, 467.93 | 1.5 |
| Tigray | 3, 516.37 | 1.3 | 56, 653.35 | 1.2 |
| Others | 1, 625.86 | 0.6 | 12, 581.71 | 0.3 |
| Total | 281, 083.49 | 100.0 | 4, 855, 470.93 | 100.0 |
Table text extracted from the original PDF; superscript letters are shown inline. The original table image is below.
View original table image
Source: IFPRI, 2010
Source: Construct using raw data from FAO, retrieved in Jan. 2022.
Data Types and Sources
This study used time series secondary data for the variables selected for this study. The variables selected for this study included: Exported quantities of haricot beans, production volume of haricot beans, national GDP, export and producer prices of haricot beans, real exchange rate, and inflation rates. The data pertaining to these variables, except production quantities, were collected from the FAOSTAT database. Data on production of haricot beans have been compiled from CSA Agricultural Sample Survey Reports on area and production of major crops.
Empirical Model Specification
To examine the determinants of haricot beans export trade, an autoregressive distributed lag (ARDL) model was employed. ARDL model is more statistically significant approach to determine the co-integration relation between variables in small samples than Johansen co-integration techniques, which require large data samples for valid estimation of the parameters (Pesaran, et al., 2001) [19] . Most importantly, the ARDL estimation can be applied whether the regressors are purely ordered zero [I(0)], purely order one [I(1)], or a mixture of both. The general representation of the ARDL model can be written as:
Where Y t is a vector, μοі is the intercept, and variables in X t are allowed to be purely I(0) or I(1) or fractionally integrated; β and α are coefficients; and j = 1, … k is several independent variables. P is the lag length of dependent variable and q is the optimum lag for independent variables, while the term ԑ іt represents a vector of error term.
Inserting the variables of the current study into equation (1) and converting into natural logarithmic form, the standard ARDL model can be given by the equation:
Where, lnHExpor t is export volume, lnHProd t is production volume, lnGDPt is gross domestic product, lnExpoPri t is export price, lnProdPri t is producer price, lnExR t is exchange rate, and lnInfR t is inflation rate. The symbol Δ is the first difference operator, q, r, s, v, y, x and w are the lag length with their respective variables, and 𝜀 t is the error term; β1, β2, β3, β4, β5, β6, β7 are the coefficients that measure long-run elasticities between the variables. Whereas α i , α j , α k , α l , α m , α n , and α p indicates coefficients that measure short-run elasticities between variables. Based on economic theory and prior empirical results, the expected signs of the coefficients are β 2 > 0,
If there is evidence of long-run relationship (co-integration) between the variables, the following long-run model will be estimated:
From the cointegration series, the short-run elasticities can be derived through constructing the error correction model (ECM) in the following form:
Where, the variable ECM t-1 is the error correction term which captures the long-run relationship whereas 𝛼′𝑠 are the coefficients associated with short-run dynamics of the model converging to equilibrium.
Before estimating the ARDL model using the above specified equations, ti is customary to test the presence of unit root and long-run cointegration in the data series of variables included in the model. Towards this end, an Augmented Dickey-Fuller (ADF) and Philips-Perron (PP) tests were considered the best approach and used to test the presence of unit root in the data series. To estimate the bound tests, all the variables included in the model needs to be stationary at I(0), I(1), or both. Therefore, each data was checked for stationary in levels and first difference for testing their level of integration. Subsequently, a cointegration test has been conducted to detect the presence of a stable equilibrium relationship between the variables included in the model. According to ARDL model the existence of co-integration relationship can be investigated between the time series regardless of whether they are I(1) or I(0). If the presence of cointegration is confirmed with the model for at least two I(1) series and some I(0), the variables can be added to the ARDL model for the estimation which may not alter the I(0) characteristics of the error term. In this study, cointegration analysis was carried out using the Johansen procedure as recommended by Akter and Hong (2011), which first defines an unrestricted vector auto regression (VAR). All of the analyses have been conducted using Eviews 9 Econometric Software.
Results
Results
Unit Root Tests
Table 2 presents the results of the unit root test for the variables included in the current study. The results show that all the data series were found co-integrated of the order I(0), i.e. the dependent variable lnHEpoQ, the explanatory variables lnHProQ, lnGDP, lnlnExpoPri, lnProdPri, lnRExR, and lnInfR are co-integrated at levels (I(0)). Thus, the ARDL approach is more suitable than other approaches for examining the relationships between the given dependent and independent variables.
| Variables | ADF | — | PP | — | Result |
|---|---|---|---|---|---|
| Level | First Difference | Level | First Difference | ||
| LnHExpoQ | -2.7523*** | -9.5999 | -5.4525 | -28.5743 | I(0) |
| LnHProd | -1.0541*** | -7.5613 | -1.2981*** | -10.8740 | I(0) |
| LnGDP | -1.0247*** | -4.0122*** | -0.6989*** | -3.9484*** | I(0) |
| LnExpoPri | -3.0198*** | -6.6494 | -2.9617*** | -12.9286 | I(0) |
| LNPRODPRI | -1.6127*** | -5.9466 | -1.5599*** | -5.9759 | I(0) |
| LNREXR | -3.0298*** | -3.6156*** | -2.3478*** | -3.5776*** | I(0) |
| LNINFR | -3.3054*** | -11.5231 | -5.7924 | -38.9312 | I(0) |
Table text extracted from the original PDF; superscript letters are shown inline. The original table image is below.
View original table image
Diagnostic Tests
Next to the unit root test, different diagnostic tests such as co-integration bound test, diagnostic tests for normality, heteroscedasticity, and serial correlation were conducted. The first step of data analysis using ARDL model requires checking the long relationship between the variables included in the study. Table 3 presents the outcomes of the cointegration bound test. The F-test statistic computed within the co-integration test framework is compared with the upper and lower critical values and found to exceed the upper bound at the 1% critical value. This implies that haricot beans export and its determinant variables are cointegrated, epitomizing the existence of a long-run relationship among the dependent and explanatory variables. In addition to the above diagnostic tests, stability diagnostics has been conducted to measure parameter constancy. To achieve this, the study tested the stability of long-run estimates based on the cumulative sum of recursive residuals (CUSUM) and cumulative squares of recursive residuals (CUSUMQS) tests. Table 5 shows CUSUM stability test results. The result indicates that the model does not suffer from any form of misspecification. Equally, the plot of CUSUM test shown in Figure 3 reveal that the estimated parameters are stable over the observation period at a 5% level of significance.
Impact of Factors Influencing Export of Haricot
Beans: This study has been carried out to examine the factors influencing the export of haricot beans from Ethiopia over the period 1981 to 2020. Using the general to specific approach, an ARDL model with lag length (0, 0, 1, 1, 1, 1, 0) has been selected as optimum to estimate the regression coefficients for the variables included in the model. The estimated ARDL model demonstrated good fitness to the haricot beans export data series with high value of adjusted R 2 (0.869). The result implies that the explanatory variables included in the model explained 86.9% of the variations in the export volume of haricot beans. Furthermore, the Durban-Watson showed no evidence of serial autocorrelation (1.7364). Subsequently, the F-test does not show the presence of any heteroscedasticity of the residual.
The tests, therefore, exemplify that the model becomes viable and fits at lag length 1 and first-order differences. Table 6 presents the regression coefficients estimated for determinants of haricot beans export. The result demonstrated that lnProdq, lnGDP, lnExpoPri, lnRexR, and lnInfR had positive and significant (at 1%) impact on the export level of haricot bean, except LnProdq which is statistically insignificant. The results imply that a 1% increase or change in LnGDP, lnExpoPri, lnRexR, and lnInfR will lead to an augment in the level of haricot bean export by 0.79%, 2.8%, 1.4%, and 0.67%, respectively. Conversely, a one period lagged lnExpoQ quantity and current year's lnProdPri had negative and significant (at 1% level) effect on current level of haricot beans export. The results imply that a 1% increase in one period lagged export quantity and current year's producer price will lead to a decrease in haricot beans export level by 1.26% and 2.4%, respectively. Furthermore, a one period lagged lnGDP, lnExpoPri, and lnRexR had negative impact on current export level of haricot beans, but only lnGDP and LnRexR are statistically significant at 1% level. The result revealed that a 1% increase or change in one period lagged lnGDP and lnRexR will cause a decline in current export level of haricot beans by 3.34% and 6.99%, respectively. Subsequently, the long-run elasticity's for the determinants of haricot beans export included in the model have been estimated. Table 7 presents the empirical results of the longrun model for determinants of coffee export. As can be seen from the table, one period lagged haricot beans export included as explanatory variable (lnHExpoQ(-1)) and haricot beans producer price (lnProdPri) had negative and significant (at 1% level) impact on current year's haricot beans export level in the long-run. The results imply that a 1% increase or change in the first lag order of haricot bean export level and haricot beans producer price will result in a decrease of current year's haricot beans export level by 0.56% and 1.1% respectively. Conversely, lnGDP, lnExpoPri, lnRexR, and lnInfR showed positive and significant (at 1% level) impact on haricot beans export quantity in the long-run. The results imply that, holding the other variables constant, a 1% increase in lnGDP, lnExpoPri, lnRexR, and lnInfR will cause an increase in export level of haricot bean by 0.35%, 1.245%, 0.62% and 0.3%, respectively. In this study, the short-run dynamic ECM (-1) model has also been estimated to capture adjustment towards the longrun and the model. Table 8 presents the short-run elasticity coefficients estimated for the determinants of haricot beans export model. The lagged error correction term (ECT (-1)) of negative and significant at 1% level of significance confirms the existence of long-run association between the variables. The error correction coefficient measures the speed of adjustment toward long-run equilibrium after a short-run shock with a value of -0.391. This indicates that deviation from the long-run equilibrium is corrected at the speed of 39 percent over each year towards long-run equilibrium after a short run shock. As can be seen from Table 8, a one period lagged lnExpoQ and LnRexR revealed negative and significant (at 1% level) impact on export level of haricot beans in the short-run. Equally, one period lagged lnProdQ and lnProdPri has negative impact on current year's export level of haricot bean, but statistically insignificant. Conversely, a one period lagged lnGDP, lnExpoPri, lnInfR had positive impact on export level of haricot bean in the short-run, although statistically insignificant. This implies that these variables have minimal impact on the level of haricot bean export in the short-run.
| Variable | Coefficient | Std. Error | t-Statistic | Prob. |
|---|---|---|---|---|
| C | 0.62994 | 0.25533 | 2.46714 | 0.0198 |
| ECT(-1) | -0.39054*** | 0.10707 | -3.64741 | 0.0010 |
| D(LNEXPOQ(-1)) | -0.39437*** | 0.12760 | -3.09065 | 0.0044 |
| D(LNPRODQ) | -0.3215 | 0.39919 | -0.80533 | 0.4272 |
| D(LNGDP) | 0.5643 | 1.68306 | 0.33528 | 0.7398 |
| D(LNEXPOPRI) | 0.36173 | 0.66874 | 0.54091 | 0.5927 |
| D(LNPRODPRI) | -0.60912 | 0.89008 | -0.68434 | 0.4992 |
| D(LNREXR) | -5.8197*** | 1.71446 | -3.39448 | 0.0020 |
| D(LNINFR) | 0.05256 | 0.12762 | 0.41186 | 0.6835 |
| R-squared | 0.62358 | Mean dependent var | 0.11350 | |
| Adjusted R-squared | 0.51974 | S.D. dependent var | 1.40260 | |
| S.E. of regression | 0.97201 | Akaike info criterion | 2.98448 | |
| Sum squared reside | 27.3991 | Schwarz criterion | 3.37233 | |
| Log likelihood | -47.7052 | Hannan-Quinn criter. | 3.12248 | |
| F-statistic | 6.00528 | Durbin-Watson stat | 1.49812 | |
| Prob(F-statistic) | 0.00014 |
Table text extracted from the original PDF; superscript letters are shown inline. The original table image is below.
View original table image
| Variable | Coefficient | Std. Error | t-Statistic | Prob. |
|---|---|---|---|---|
| Constant | -2.16494 | 1.5717 | -1.3775 | 0.1836 |
| LnHExpoQ (-1) | -0.5578*** | 0.03839 | -14.5298 | 0.0000 |
| LnHProdQ | 0.10878 | 0.13630 | 0.79807 | 0.4342 |
| LnGDP | 0.34944* | 0.17936 | 1.9483 | 0.0656 |
| LnHExpoPri | 1.240*** | 0.26509 | 4.67774 | 0.0001 |
| LnHProdPri | -1.060*** | 0.28119 | -3.76970 | 0.0012 |
| LNREXR | 0.6203*** | 0.15241 | 4.07003 | 0.0006 |
| LNINFR | 0.2963*** | 0.10675 | 2.77573 | 0.0117 |
Table text extracted from the original PDF; superscript letters are shown inline. The original table image is below.
View original table image
| Variable | — | Coefficient | Std. Error | t-Statistic | Prob. |
|---|---|---|---|---|---|
| C | C(1) | -4.895231 | 3.659422 | -1.337706 | 0.1960 |
| LNEXPOQ(-1) | C(2) | -1.26114*** | 0.196272 | -6.425492 | 0.0000 |
| LNPRODQ(-1) | C(3) | 0.24596 | 0.309358 | 0.795059 | 0.4359 |
| LNGDP(-1) | C(4) | 0.79012* | 0.406773 | 1.942414 | 0.0663 |
| LNEXPOPRI(-1) | C(5) | 2.80386*** | 0.669731 | 4.186558 | 0.0005 |
| LNPRODPRI(-1) | C(6) | -2.39678*** | 0.639724 | -3.746589 | 0.0013 |
| LNREXR(-1) | C(7) | 1.40259*** | 0.397611 | 3.527530 | 0.0021 |
| LNINFR(-1) | C(8) | 0.66999*** | 0.229542 | 2.918817 | 0.0085 |
| D(LNPRODQ) | C(9) | 0.45885 | 0.326878 | 1.403721 | 0.1757 |
| D(LNGDP) | C(10) | -6.77146*** | 1.544046 | -4.385532 | 0.0003 |
| D(LNGDP(-1)) | C(11) | -3.34018** | 1.401277 | -2.383669 | 0.0272 |
| D(LNEXPOPRI) | C(12) | 0.90652* | 0.479707 | 1.889747 | 0.0734 |
| D(LNEXPOPRI(-1)) | C(13) | -0.12287 | 0.543312 | -0.226143 | 0.8234 |
| D(LNPRODPRI) | C(14) | -0.73176 | 0.656436 | -1.114750 | 0.2782 |
| D(LNPRODPRI(-1)) | C(15) | 0.69683 | 0.556814 | 1.251467 | 0.2252 |
| D(LNREXR) | C(16) | -9.59912*** | 1.431670 | -6.704840 | 0.0000 |
| D(LNREXR(-1)) | C(17) | -6.98605*** | 2.425159 | -2.880657 | 0.0092 |
| D(LNINFR) | C(18) | 0.181496 | 0.138731 | 1.308264 | 0.2056 |
| R-squared | 0.929180 | Mean dependent var | 0.113496 | ||
| Adjusted R-squared | 0.868983 | S.D. dependent var | 1.402595 | ||
| S.E. of regression | 0.507687 | Akaike info criterion | 1.787611 | ||
| Sum squared Resid | 5.154920 | Schwarz criterion | 2.563310 | ||
| Log likelihood | -15.96461 | Hannan-Quinn criter. | 2.063599 | ||
| F-statistic | 15.43566 | Durbin-Watson stat | 1.736356 | ||
| Prob(F-statistic) | 0.000000 |
Table text extracted from the original PDF; superscript letters are shown inline. The original table image is below.
View original table image
Discussion
The study result revealed that lnGDP, lnExpoPri, lnRexR, and lnInfR are important factors influencing export of haricot beans, which had positive and significant (at 1%) impact on the level of export. The results imply that a 1% increase or change in lnGDP, lnExpoPri, lnRexR, and lnInfR will lead to an augment in the level of haricot bean export by 0.79%, 2.8%, 1.4%, and 0.67%, respectively. LnGDP affects export of haricot beans positively and significantly, because higher economic growth of a nation will create higher capacity to export the product. This study result is consistent with the findings of Bereket (2020) [7] and Asres (2019. Bereket (2020) [7] studied the determinants of export level in Ethiopia and found that RGDP has a positive and significant impact on export level in Ethiopia, where a 1% increase in RGDP will cause an increase in the export by 0.69% on his part studied the determinants of Ethiopian export and reported that a unit increase in the GDP would highly and positively enhance the export of Coffee. With regards to exchange rate, this study supports the finding of who studied exchange rate and its volatility matter for international trade in Ethiopia. They found that the level of exchange rate has a positive impact on export trade in Ethiopia, implying that a 1% increase (devaluation) in domestic currency against foreign currency will result in a 0.14% increase in Ethiopian export trade. Conversely, a one period lagged lnExport quantity had negative and significant (at 1% level) effect on current level of haricot beans export. The results imply that last year's export quantity will affect current year's export of haricot beans negatively. In view of last year's poor performance of haricot beans export to trade partners, exporters may discouraged to allocate their resources towards export of haricot beans in subsequent years. The result is similar the findings of Bonga (2018) [8] who examined import and export trade in Zimbabwe. He reported that past values of exports have a negative impact on current level of exports. However, the result of this study is contrary the finding of Eshetu and Mehare (2020) [10] who studied determinants of Ethiopian export and found that the coefficient of one period lagged value of export is positive and statistically significant at a 1 per cent level of significance. This implies that the level of export value in the preceding year has a positive and significant effect on the level of export value in the subsequent year. Furthermore, a one period lagged lnGDP, lnExpoPri, and lnRexR had negative impact on current export level of haricot beans, but only lnGDP and lnRexR are statistically significant at 1% level. The coefficient of lagged lnRexR has negative and significant impact on haricot beans export level, because the shocks in real exchange rate during preceding year will discourage exporters to participate in international trade in the subsequent year. This result is collaborates with the findings of Fofanah (2020) [23] who in his study on the impact of real exchange rate on cocoa and coffee exports in Sierra Leone reported that a one period lagged LogRER had a negative effect on the subsequent year export levels of cocoa and coffee. However, the result contradicts with the findings of Ajao (2015) [3] who in his study on the determinants of real exchange rate in Nigeria found that a one period lagged real exchange rate had positive and significant influence on export levels of commodities. Subsequently, a one period lagged exported quantity (lnExpoQ(-1)) of haricot beans had negative and significant (at 1% level) on current year's export of haricot bean in both the long-and short-run. The result implies that preceding year export level will negatively affect current year's haricot beans export. Equally, producer price (lnProdPri) of haricot beans had negative impact on current year's export level of haricot beans in both the long-and short-run, but statistically significant (at 1% level) in the long-run only. The result imply that domestic prices of haricot beans negatively affects current year's export level of haricot beans because of volatility of domestic prices which discourages exporters to engage in foreign export trade. On the other hand, LnRexR revealed negative and significant (at 1% level) impact on export level of haricot beans in the short-run while it had positive and significant (at 1% level) impact on export of haricot bean in the long-run. The justification for a positive relationship between the variables in the long-run implies that the exchange rate influences the trade surplus or deficit, the reverse being true. In general, a weaker domestic currency stimulates exports while a strong domestic currency hinders exports. This result is similar with the findings of who in their study on impact of real exchange rate and its volatility on export trade in Ethiopia found that exchange rate had a positive impact on international trade in Ethiopia in the long-run. They reported that a 1% increase (devaluation) in domestic currency against foreign currency results in a 0.14% increase in Ethiopian international trade. Conversely, lnGDP, lnExpoPri, and lnInfR had positive impact on current year's export level of haricot bean both in the long-and short-run, but significant in the long-run only. This implies that these variables have positive and significant effect on current year's export level of haricot bean in the long-run. This result is consistent with the findings of Bereket (2020) [7] in his study on the determinants of agricultural output in Ethiopia found that inflation rate has positive impact and significant at 1% level. Other thing remain constant a one percent increase in inflation rate increases agricultural output by 0.322 percent. Bereket (2020) [7] on his part studied the determinants of export in Ethiopia and reported that RGDP has a positive and significant impact on volume of exports in the long run. The result showed that holding other variable constant, a 1% increase in RGDP will cause increase in export volume by 0.69%.
Conclusion
The main objective of this study is to analyze factors influencing the export level of haricot beans in the country covering the period 1981 to 2020. The study applied the well-known autoregressive distributed lag (ARDL) model bound test as analytical tool. The variables considered for the study were: volume of haricot beans export, haricot beans production volume, gross domestic product, export price of haricot beans, producer prices of haricot beans, real exchange rate, and inflation rate. The study portrayed that GDP, export price, real exchange rate, and inflation rate are important factors influencing export of haricot beans, which had positive and significant (at 1% level) impact on the level of haricot bean export. The results imply that a 1% increase or change in GDP, Export Price, Real Exchange Rate, and Inflation Rate will lead to an augment in the level of haricot bean export by 0.79%, 2.8%, 1.4%, and 0.67%, respectively. GDP affects export of haricot beans positively and significantly, because higher economic growth of a nation will create higher capacity to export the product. Conversely, a one period lagged export quantity considered as explanatory variable had negative and significant effect on current level of haricot beans export. The results imply that last year's export quantity will affect current year's export of haricot beans negatively. In view of last year's poor performance of haricot beans export to trade partners, exporters may discouraged to allocate their resources towards export of haricot beans in subsequent years. Furthermore, a one period lagged GDP, export price, and real exchange rate had negative impact on current export level of haricot beans, but only GDP and real exchange rate are statistically significant at 1% level. The coefficient of lagged real exchange rate has negative and significant impact on haricot beans export level, which was due the fact that the shocks in real exchange rate during preceding year will discourage exporters to participate in international trade in the subsequent year. Subsequently, a one period lagged exported quantity of haricot beans had negative and significant (at 1% level) impact on current year's export of haricot bean in both the long-and short-run. This implies that the preceding year export level will negatively affect current year's haricot beans export. Equally, producer price of haricot beans had negative impact on current year's export level of haricot beans in both the long-and short-run, but statistically significant (at 1% level) in the long-run only. The result imply that domestic prices of haricot beans negatively affects current year's export level of haricot beans because of the volatility of domestic prices which discourages exporters to engage in foreign export trade. On the other hand, real exchange rate revealed negative and significant (at 1% level) impact on export level of haricot beans in the short-run while it had positive and significant (at 1% level) impact on export of haricot bean in the long-run. The justification for a positive relationship between the variables in the long-run implies that the exchange rate influences the trade surplus or deficit, the reverse being true. In general, a weaker domestic currency stimulates exports while a strong domestic currency hinders exports. Conversely, GDP, export price, and inflation rate had positive impact on current year's export level of haricot bean both in the longand short-run, but significant in the long-run only. This implies that these variables have positive and significant effect on current year's export level of haricot bean in the long-run. In sum, GDP, export price, real exchange rate, and inflation rate are important factors influencing export of haricot beans, which had positive and significant (at 1% level) impact on the level of haricot bean export, although the variables portrayed mixed results at their lagged periods. In view of this, the following are recommended. First, the macroeconomic policy reforms aimed at improving the growth of GDP that enhances the total export supply of the countries to the rest of the world should be taken. Secondly, the significant relationship between the real exchange rate and export performance indicates the need to ensure a stable exchange rate policy in order to avoid the exchange rate risk.
Acknowledgement
The author is grateful to the different Institutions that made available the dataset used in this study.
Funding
The article did not have a donation or other funding sources. The main author has covered all the expenses involved access and process the required data.
Competing Interest
The author declares that there are no competing interest.
Declaration on Non-Submission or Published with
Other Journals: The author declares that this submission has not been previously published, nor is it before another journal for consideration.
Data Availability
The data used for this study can be made available upon request provided there is going to be compliance with the owners' policy concerning sharing.
Figures and tables from the paper
| Type of test | Test statistic | Test statistic value | Probability |
|---|---|---|---|
| Normality test - Histogram | Jarque-Bera | 0.3897 | 0.8229 |
| Serial Correlation (LM ) | Obs*R-squared | 1.5985 | 0.4497 |
| Heteroscedasticity (ARCH ) | Obs*R-squared | 17.6529 | 0.4110 |
Table text extracted from the original PDF; superscript letters are shown inline. The original table image is below.
View original table image
References
17 in the original paper- Journal of Scientific & Engineering Research. 2020;11(7):1501-1551.
- Abele W, Tefera T. Factors Affecting Production and Market Supply of Haricot Bean in Southern Ethiopia, Journal of Economics and Sustainable Development. 2015;6(15):103-108.
- Ajao MG. The Determinants of Real Exchange Rate Volatility in Nigeria. Ethiopian Journal of Economics. 2015;24(2):43-62.
- Akter N, Hong SJ. Education and economic growth in Haryana (India): Application of cointegration analysis and vector error correction model on supply response of pulses in Bangladesh. South Asian Studies. 2011;17(1):277-295.
- Ali WO, Bett HK, Kiprop SK, Korir H. Economic Analysis of Spatial Integration of Pulse Market in Ethiopia; A case of Selected Pulse Market in Ethiopia. European Journal of Business and Management. 2014;6(33):100-1008.
- Bereket I. The determinates of Export in Ethiopia, an Auto Regressive Distributive Lag Bound Test Approach. Journal of World Economic Research. 2020;9(1):20-26.
- CSA. Agricultural Sample Survey 2018/2019 Area and Production of Major Crops, Statistical Bulletin. Addis Ababa, Ethiopia; c2019.
- Eshetu, Mehare. Determinants of Ethiopian Agricultural Exports: A Dynamic Panel Data Analysis, Review of Market Integration. 2020;12(1-2):70-94.
- Ntavoua HS. Impact of agricultural exports on economic growth in Cameroon. International Journal of Agriculture Extension and Social Development. 2021;4(1):49-53.
- Ketema AM. Determinants of agricultural output in Ethiopia: ARDL approach to co-integration. International Journal of Business and Social Research. 2020;10(3):01-10.
- Lemu ET. Review of Haricot bean Value Chain in Ethiopia. International Journal of African and Asian Studies. 2016;24:65-72. www.iiste.org.
- Begna T, Asrat Z. Evaluation of improved common bean (Phaseolus vulgaris L.) Varieties for yield and yield components at West Hararghe, Eastern Ethiopia. International Journal of Research in Agronomy. 2021;4(2):50-54.
- Nguse T, Oshora B, Fekete-Farkas M, Tangl A, Desalegn G. Does the exchange rate and its volatility matter for international trade in Ethiopia? Journal of Risk and Financial Management. 2021;14(12):1-18. https://doi.org/10.3390/jrfm14120591.
- Pesaran M, Shin Y, Smith R. Bounds Testing Approaches to the Analysis of Level Relationships. Journal of Applied Econometrics. 2001;16(3):289-326. https://doi.org/10.1002/jae.616.
- Sawore A. Determinants of Export Trade in Econometric Study with Special Reference to Ethiopia. International Journal of Science and Research. 2016;5(12);132-137.
- Fofanaf P. Impact of Real Exchange Rate Fluctuations on Aggregate Cocoa and Coffee Exports in Sierra Leone, Journal of Economics and Behavioral Studies. 2020;12(2):34-56.
- Merga D. Evaluation of some haricot bean (Phaseolus vulgaris L.) cultivars for growth characters and dry matter production, Advanced Journal of Plant Biology. 2021;2(1):1-5.
Cited by 9
From OpenAlex, OpenCitations and reference lists read by Scinovex
- Socio-economic determinants and educational interventions shaping smallholder export participation in bean value chains ↗
Carlos A Mendoza, Lucia R Fernández · International Journal of Social Science and Education Research · 2026
❝ 0Found by Scinovex - Polyphenol content, antioxidant capacity, and nutritional profiling of Phaseolus vulgaris L. varieties for functional food applications ↗
Elena V Petrova, Dmitri S Volkov · Journal of Medicinal Plants Studies · 2026
The haricot bean (Phaseolus vulgaris L.) possesses a rich and diverse phytochemical profile encompassing polyphenols, flavonoids, tannins, saponins, phytic acid, and bioactive peptides, alongside a proximate composition characterized by high protein (20-28%), dietary fiber (15-25%), and essential micronutrient content. This study provides a comprehensive characterization of the phytochemical and nutritional properties of 12 haricot bean varieties representing three market classes
- Seven millennia of bean cultivation: Cultural heritage, indigenous knowledge, and the tensions of modern export trade ↗
Alejandro F Reyes, Maria I Gutierrez · International Journal of Arts Humanities and Social Studies · 2026
The haricot bean (Phaseolus vulgaris L.) possesses a rich cultural heritage spanning over 7,000 years of cultivation history across diverse civilizations, from its Mesoamerican origins through its global diffusion via Columbian exchange routes to its contemporary status as a culturally embedded staple and internationally traded commodity. This study examines the cultural and socio-historical dimensions of haricot bean cultivation and their
- Amino acid quality, starch fractionation, and mineral bioaccessibility in haricot bean: A multi-analytical chemistry study ↗
Carlos A Mendoza, Roberto E. Salazar · Journal of Research in Chemistry · 2026
❝ 0Found by Scinovex - Farmer literacy dimensions and multi-modal knowledge interventions: Evidence from bean-growing communities ↗
Joseph Kibachio Mwangi, Grace W Njoroge, Samuel O Otieno · International Journal of Literacy and Education · 2025
Farmer literacy and knowledge dissemination systems constitute fundamental yet frequently underestimated determinants of haricot bean (Phaseolus vulgaris L.) export chain performance, as the capacity of producers to understand and implement quality management practices, comply with sanitary and phytosanitary standards, and access market information directly influences the volume and value of export-grade output. This study investigates the relationship between farmer literacy
- Bioactive fractions from common bean seeds: In vitro antioxidant, anti-diabetic, and antimicrobial evaluation ↗
Anastasia M. Kuznetsova, Elena V Petrova · Journal of Phytopharmacology and Phytomedicine · 2025
❝ 0Found by Scinovex - Disease spectrum and mycotoxin contamination in haricot bean production: A multi-site pathological survey ↗
Elena V Petrova, Dmitri S Volkov, Anastasia M. Kuznetsova · International Journal of Plant Pathology and Microbiology · 2025
Haricot bean (Phaseolus vulgaris L.) production is severely affected by a range of microbial pathogens including fungi, bacteria, and viruses that reduce yield, compromise grain quality, and ultimately limit export potential. This study investigates the spectrum of microbial interactions both pathogenic and symbiotic in haricot bean production systems and evaluates their implications for meeting international export quality standards. A combination
- Rainfall, temperature, and soil controls on bean yield in semi-arid zones: Field evidence and climate projections
Thabo Michael Ndlovu, Lindiwe P Dlamini · International Journal of Geography Geology and Environment · 2025
Haricot bean (Phaseolus vulgaris L.) production in semi-arid regions is critically shaped by agro-climatic and environmental factors including rainfall distribution, temperature regimes, soil characteristics, and the increasing impacts of climate variability, all of which directly influence yield stability, grain quality, and export potential. This study investigates the agro-climatic and environmental determinants of haricot bean export performance in semi-arid production zones through an integrated approach combining multi-site agronomic field trials, climate data analysis, soil characteriza
- Gravity model analysis of trade barriers and export opportunities in the global haricot bean market ↗
Carlos A Mendoza, Lucia R Fernández, Roberto E. Salazar · International Journal of Foreign Trade and International Business · 2024
❝ 0Found by Scinovex