
Research article · 2023 · Full text
International Journal of Veterinary Sciences and Animal HusbandryAnalysis of a hybrid support vector machine-based laying-hen tracking technique
Volume 8(1) · Pages 106–115 · DOI: 10.22271/veterinary.2023.v8.i1b.477 ↗
Research areasAdvanced Chemical Sensor TechnologiesAnimal Behavior and Welfare Studies
Abstract
Author-writtenAnimal wellbeing may be evaluated by looking at their behaviour. The approach that is most often employed to research animal behaviour is manual examination of videos. This strategy, however, is time-consuming and is based on the analysts' opinions. Automated identification of individual animals is urgently required, and automatic tracking is a key component of the solution to this issue. For the automatic tracking of individual laying hens in a layer group, a Hybrid Support Vector Machine (HSVM)-based algorithm was created in this work. An experimental platform was used to film laying chickens grown beneath a floor system for more than 500 hours. Based on their overlap rates and average Overlap rates, the experimental results showed that the HSVM tracker outperformed the Frag (fragment-based tracking method), the TLD (Tracking-Learning-Detection), the PLS (object tracking via partial least squares analysis), the Mean Shift Algorithm, and the Particle Filter Algorithm. According to the experimental findings, the HSVM tracker outperformed the other examined algorithms in terms of resilience and state-of-the-art performance when it came to tracking individual laying hens. Under realistic rearing circumstances, it may be useful for observing animal behaviour.
Summary
Source-checkedPlain-language reading of the full paper, prepared with AI and checked against the text. Each point links to the authors' own words.
Why it matters
- Evaluating animal wellbeing through behavior often relies on manual video analysis, which is subjective and time-consuming. View evidence ↗
- There is an urgent need for automated individual animal identification and tracking to improve behavioral research. View evidence ↗
- Precision livestock farming (PLF) uses automated monitoring to provide real-time data on animal health and wellbeing. View evidence ↗
The question
- The study aimed to create and evaluate a Hybrid Support Vector Machine (HSVM)-based algorithm for the automatic tracking of individual laying hens. View evidence ↗
What they did
- The experiment used six 20-week-old Hyline Brown laying hens with an average weight of 1.4 kg. View evidence ↗
- Hens were housed in a 1.2 m by 1.5 m enclosure with LED lighting providing 15-20 lux from 0500 to 2100 daily. View evidence ↗
- Cameras were mounted at 2.2 m to collect over 500 hours of footage over 30 days between 0500 and 2100 hours. View evidence ↗
- The HSVM algorithm combined three sub-models (binary, regression, and one-class) with weights of 0.1, 0.6, and 0.3 respectively to handle different behaviors and environmental changes. View evidence ↗
What they found
- The HSVM algorithm achieved an average processing speed of 9.1 seconds per frame on a desktop computer. View evidence ↗
- Overall, the HSVM tracker's average overlap rate was 35% higher than the best performing alternative algorithm. View evidence ↗
- In the most challenging scenario of multi-hen mutual occlusion, HSVM achieved a 68% average overlap rate, which was 41% higher than the next best method. View evidence ↗
- The HSVM tracker maintained a consistent average overlap rate between 68% and 79% across various test instances. View evidence ↗
- In multi-hen occlusion scenarios, the Particle Filter (27%) and PLS (23%) algorithms performed significantly worse than HSVM. View evidence ↗
- The TLD algorithm struggled with the abrupt movements of chickens, resulting in a low average overlap rate of 11%. View evidence ↗
What it means
- The authors conclude that the HSVM algorithm is resilient and efficient, offering significant practical utility for the poultry sector. View evidence ↗
- A limitation of the HSVM algorithm is that it may lose the target if it is heavily obscured for a long duration. View evidence ↗
- Future work will focus on dynamically modifying the tracking box size to account for target size changes and further increase the overlap rate. View evidence ↗
Visual summary
3 visualsIllustrations explain the paper; charts are replotted from the paper's own table values.
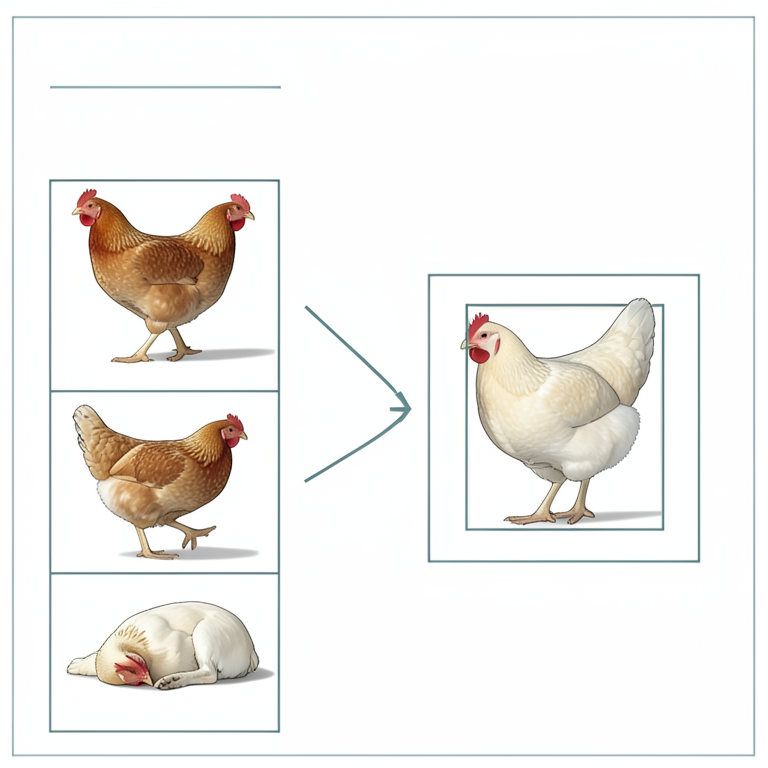
HSVM Model Architecture
AI-generated conceptual illustration (laying hens in a poultry house). It explains the idea and does not show study data.
View source evidence ↗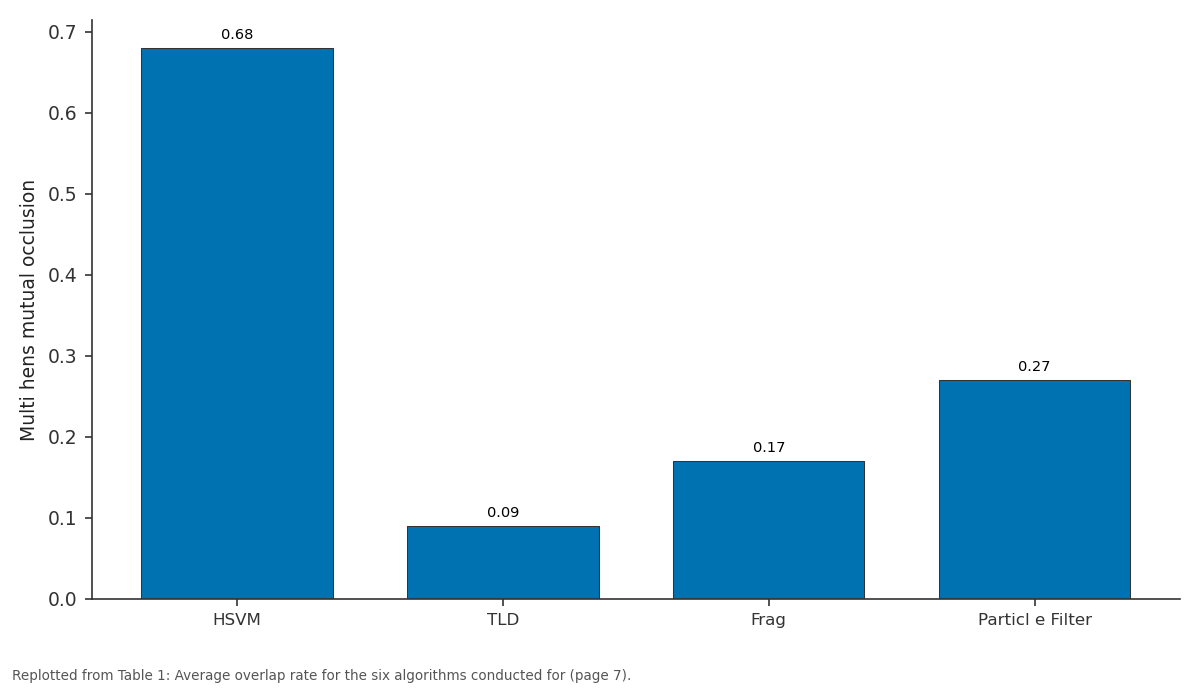
Multi hens mutual occlusion: HSVM vs TLD vs Frag vs Particl e Filter
Replotted from Table 1 (page 7) of the original paper. Every bar is the paper's own table value.
View source evidence ↗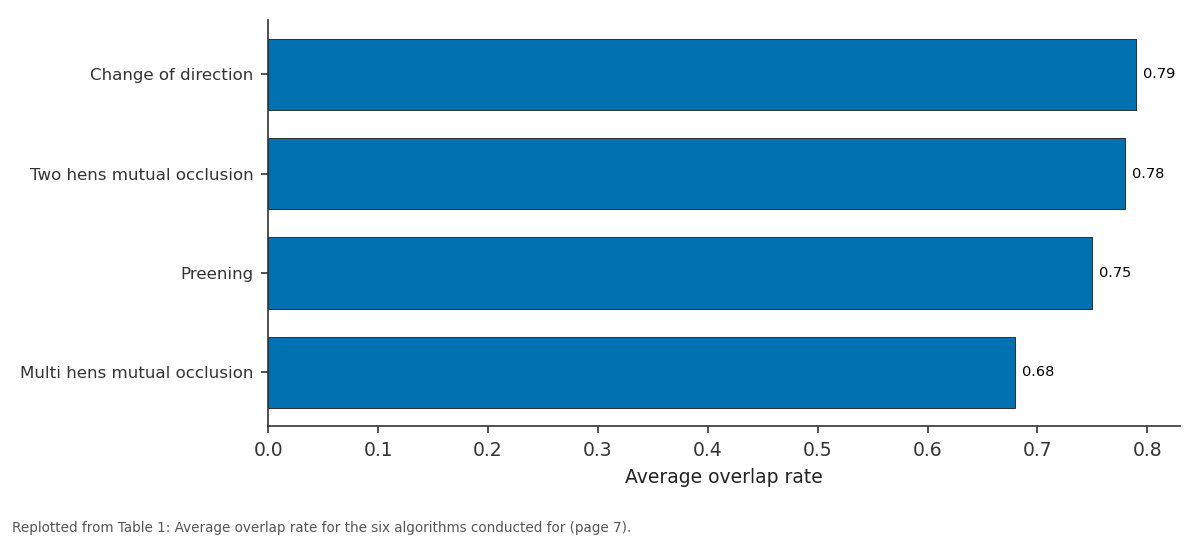
HSVM: Change of direction vs Two hens mutual... vs Preening vs Multi hens mutual...
Replotted from Table 1 (page 7) of the original paper. Every bar is the paper's own table value.
View source evidence ↗Figures & tables
From the original paper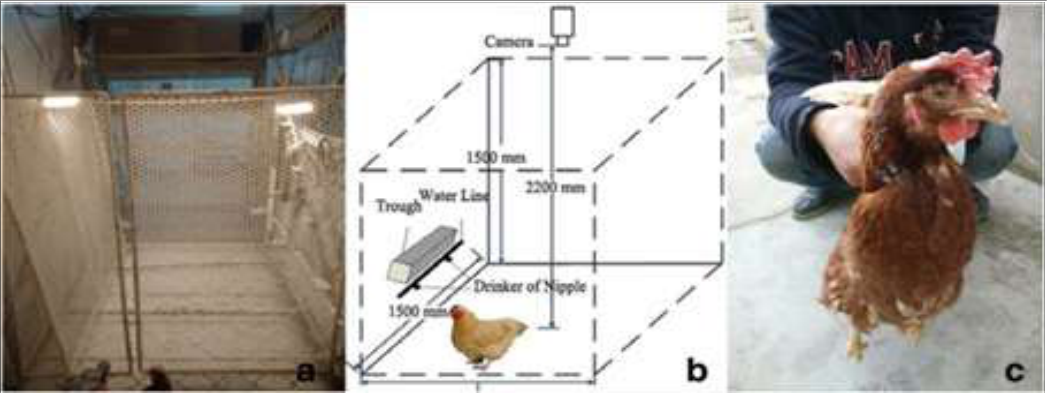 Figure 1
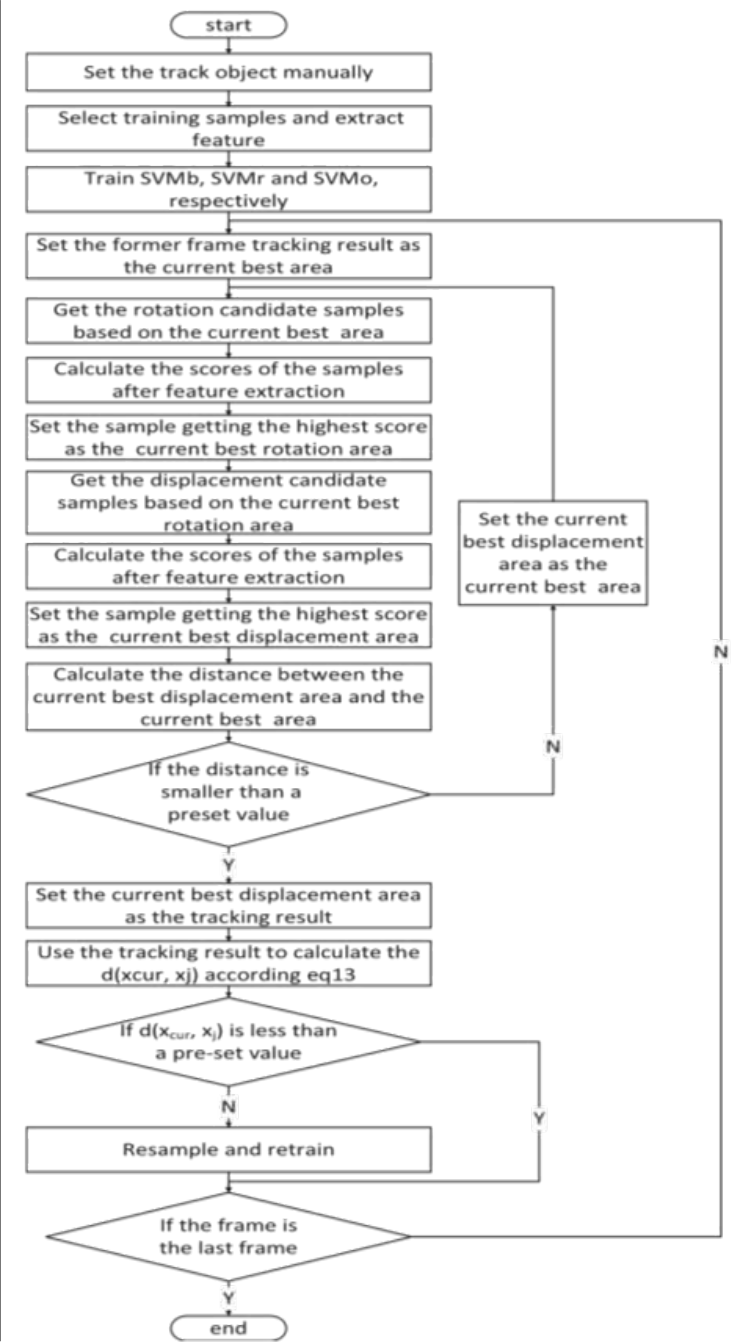 Figure 2
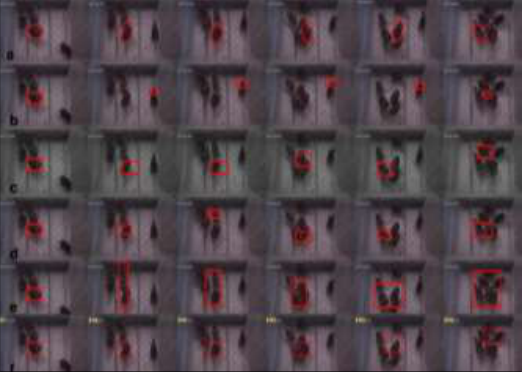 Figure 3
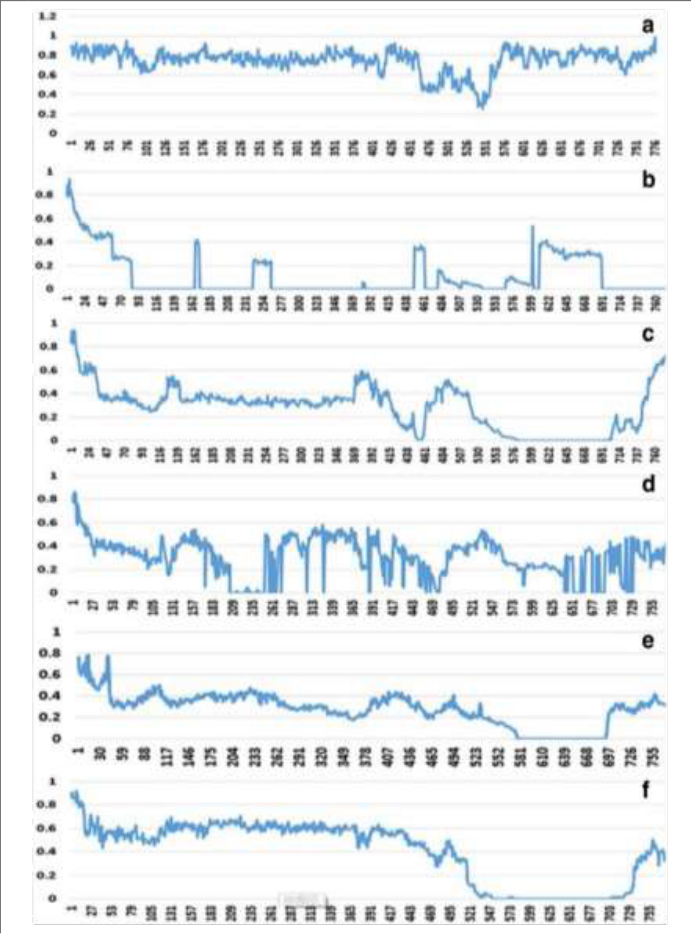 Figure 4
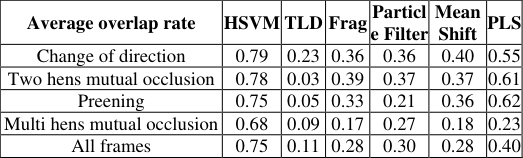 Table 1
Introduction
In light of the growing concern about chicken welfare, breeding should be done with consideration for feeding and killing. In addition, healthy poultry and high-quality products depend greatly on sound welfare practises, which may increase economic effectiveness (Wathes et al. 2008) [57] . In order for birds to be in a good state of wellbeing, they must be physically fit, emotionally stable, and able to engage in natural behaviours (Sih et al. 2021) [44] . However, there are several indications, including behavioural markers, physiological stress, and productivity-based proxies, allowing the thorough evaluation of animal wellbeing. Evaluation is challenging and time-consuming due of the many interactions among them, particularly at the commercial level. The easiest to comprehend and most often used of these wellbeing indices is behaviour (De Jong et al. 2016) [18] , since behaviour, which may be impacted by living situations, emotions, and illnesses in animals, can represent physiological states. Therefore, by keeping an eye on animal behaviour and developing feeding and management strategies appropriately, one may not only encourage animal development and increase production efficiency, but also ensure the wellbeing of the animals. Precision livestock farming (PLF) is the automated monitoring, modelling, and management of animal production via the use of process engineering ideas and methods (Tullo et al. 2017) [23] . PLF aims to automatically and continually monitor animal health and wellbeing in real-time while also sending out quick warning warnings. Monitoring the way hens utilise resources may help with home design and resource allocation (Ringgenberg et al. 2015) [41] . The position of chicken clustering may be used to assess the quality of the house's amenities (such as feeders and drinks) (Fraess et al. 2016) [24] . By monitoring a bird's behaviour, such as feeding, drinking, moving about, and perching, it is possible to determine if it is healthy and, therefore, to detect illnesses early on (Colles et al. 2016; Dawkins et al. 2017) [16,17] . In light of this, the enormous potential of PLF depends on early warning, which enables farmers to intervene in the early phases of welfare issues or illnesses. Monitoring certain animals is important to really accomplish PLF.
Individual behaviour research may influence each person's health and output, as well as increase the precision of welfare evaluation. For instance, using a radio-frequency identification (RFID) system to track each chicken's activities, the chickens may be categorised into three levels: active, normal, and ill (Zhang et al. 2016) [54] . As a result, every ill bird may be discovered quickly. In contrast to big animals (such cattle and pigs), poultry are not only tiny but also bred in enormous numbers on industrial farms, making it challenging to monitor them mechanically and individually. Nevertheless, PLF is able to give new chances to enhance animal husbandry with high effectiveness, low cost, ecological, and sustainable development, as well as some guarantee to customers about the safety of their food (Berckmans, 2014) [30] . The PLF system uses sensors (Such as RFID tags, accelerometers, cameras, microphones, and temperature sensors) to gather data on activity, body temperature, feed intake, and weight that is then utilized for environmental monitoring, person identification, and behaviour analysis. To track animal behaviour, health, and productivity, a variety of sensor systems are available that enable effective and continuous data collecting from several sources. Additionally, cutting-edge data processing methods enable continuous, automated, accurate, and real-time analysis of animal behaviour (Valletta et al. 2017; Van Hertem et al. 2017) [51][52] . Based on the existing research, Ben Sassi et al. (2016) [9] examined the sensors and technology for monitoring poultry welfare. Although the evaluation emphasised that monitoring technology may be used commercially, it omitted to examine the challenges of commercial implementation. The purpose of this research is to evaluate the viability of achieving PLF via an analysis of automated techniques used to track laying hen or broiler behaviour at the experimental or commercial level during the last five years. The review discusses automated techniques that have been used to analyse the welfare and behaviour of poultry, including sound analysis, RFID technology, and image processing. It also discusses the detection aspects of these techniques, their benefits and drawbacks on a commercial level, and their viability for PLF.
Hybrid support vector machine
Animal vocalisations may be utilised as a wellbeing indicator since they carry a plethora of biological information (such as social interactions, warning signals, and behavioural demands) (Manteuffel et al. 2021) [36] . When used in poultry systems, the microphone is always placed low and close to the animals so that it may continually and non-intrusively record sounds like pecking, vocalisations, and outside noises. The length, energy distribution, frequency, and formant amplitude are often used as the defining factors in sound analysis approaches to gauge the behaviour and wellbeing of birds. Long-term monitoring may be done automatically, in realtime, and without disturbing the birds.
Growth rate detection
In order to increase the productivity and financial rewards of broiler farmers, it is crucial to monitor feed conversion, growth rate, and BW. In an experimental pen, pecking noises accurately identified 90% of one broiler's feed intake, demonstrating the link between pecking behaviour and eating (Aydin et al. 2014) [6] . In a different trial, 10 broilers' feed intake had an accuracy of 86%. (Aydin et al. 2015) [4] . Following that, pecking sound analysis was used to predict in real time the short-term eating behaviours of 10 broilers, with accuracy reaching 90% for meal size, 95% for meal length, 84% for number of meals per day, and 89% for feeding rate (Aydin and Berckmans, 2016) [5] . The three publications mentioned above were examined in an experimental pen with a maximum of 10 hens. To verify the application to a commercial farm, it is necessary to filter out external noise and determine whether it is feasible to recognise a single bird among a vast population of birds. Due to the strong correlation between broiler vocalisations and BW, sound analysis may be a viable way to gauge the growth rate of broiler chickens. A research on an intense broiler farm revealed that the peak frequency of the noises produced by broiler chickens reduced significantly throughout the course of the birds' whole lives as they grew (Fontana et al. 2015 and 2016) [21][22] . Additionally, a broiler weight prediction model was developed and verified using a peak frequency analysis of the birds' vocalisations (Fontana et al. 2017) [23] . Thus, vocalisations might be used to help with the autonomous monitoring of broiler chicken development.
Disease detection
The sound of healthy and ill hens differs from one another. A supervised learning neural network's analysis of the frequency domain properties of 15 hens with Clostridium perfringens type A infection and 15 healthy chickens revealed classification accuracy of 66.6% two days after infection and 100% accuracy eight days later. A tool was created to determine if a chicken was healthy or infected with Newcastle disease, the bronchitis virus, or avian influenza using datamining techniques and the Dempster-Shafer evidence theory (Banakar et al. 2016) [8] Without external noise, the equipment could identify the sickness in each bird.
Others
One-day-old chickens might be analysed using sound to determine their sex as well as their genetic makeup (Cobb and Ross chicks) (Pereira et al. 2015) [39] . Four acoustic sound parameters were examined, and it was discovered that the second spectral peak of the sound spectrum and the pitch could both be used to determine the sex of chicks. Commercial hens' health and output may be impacted by stress, including physical, emotional, and environmental stressors. In a commercial farm, the noises of hens experiencing heat or fright stress were heard (Lee et al. 2015) [13] . Support vector machine (SVM) methods were used in the suggested system to automatically and non-invasively categorise various stressors, and both the average classification accuracy and the stress detection accuracy were higher than 96%. Investigation into the vocal variations of hens expecting various incentives revealed that varied auditory cues caused different vocal parameters to be generated by hens (McGrath et al. 2017) [37] . It was able to utilize the chickens' vocalisations as welfare indicators (e.g., health, stress, growth).
Tracking location and locomotion of individuals by radio-frequency identification
The primary purpose of wireless wearable sensors is to monitor people's whereabouts and activities from a distance (e.g., accelerometers, RFID microchips). When human observations are challenging, these sensors can automatically discern between individual behaviours. The technologies were examined by Siegford et al. (2016) [43] , in particular RFID, which was used as a research tool to monitor the movements and whereabouts of specific laying hens. However, owing to the tiny size and light weight of individual birds, the needed size of the on-bird microchips, and the high investment cost, RFID technology is seldom employed in commercial poultry farms compared to farms producing bigger animals (e.g., pigs and cattle). A technique for automated identification and data collection that may be used primarily in test environments to follow the whereabouts of certain birds is radiofrequency identification technology. A bird's leg or back may also be implanted with an RFID microchip, which sends a signal to the RFID reader when the antenna is in the magnetic field and a positional signal to the central information system. Monitoring a bird's position may enable monitoring of its behaviour when breeding, eating, drinking, perching, or roaming and, therefore, allow for the prediction of its health.
Detecting nest use
Wearing RFID tags on the legs of hens allows readers to identify when a hen enters or exits a nest when placed within a nest. A smart nest box was created to recognise each hen's unique laying patterns (Chien and Chen, 2018) [15] . The presence of hens in the nest was determined using a lowfrequency RFID device. The presence of eggs might be determined using an egg detecting sensor, which would then weigh the eggs. Design-based Internet of Things allowed for simultaneous recording of all data on a local SD card and a cloud database. Analyzing the laying efficiency of certain individuals and achieving product traceability are both possible with individual egg identification. The system might have kept track of the chickens whose egg output was suffering because of welfare issues. The nest design may be enhanced by establishing hen visits. Researchers discovered that the location of the nest, the occupancy of the nest, and the age of the hens had a greater impact on the choice of nest than did the look of the nest curtains using the Gantner Pigeon Technology GmbH (Schruns, Austria) RFID system (Ringgenberg et al. 2015) [41] . Using laying behaviour detection, it would be possible to investigate the connection between keel bone abnormalities and fractures and egg laying behaviour (Gebhardt-Henrich and Frohlich, 2015) [26] . Tracking a person's food and activity patterns Individual bird positions may be tracked using radio-frequency identification devices in order to monitor movement and duration at a specific place. To track the movement of four distinct birds in various compartments, a low-frequency RFID device was used to create an environmental preference chamber with four compartments and two stages (Sales et al. 2015) [42] . The detection range of the antenna, the scan interval of the antenna, and the conflicts of the RFID tags would impact the performance of the RFID system, which had successful detection rates that were 62.6 11.2% higher than those of video observation. Chicken behaviours including speed, the capacity to find food, and resting times were observed by tracking the weight and movement of individual hens using weighing sensors and RFID devices. Using the K-means clustering approach, chicks were categorised as being active, normal, or ill (Zhang et al. 2016) [54] . For the purpose of monitoring the eating and nesting habits of 60 individual hens housed in enhanced colony housing, an ultra-high-frequency RFID system was created. Feeding behaviour was evaluated with different feeder spacing (12.0, 9.5, 8.5, and 6.5 cm/hen) using the same experimental equipment (Oliveira et al. 2018) [38] . The distribution of resources, animal welfare, and the design of housing systems might all benefit from this kind of study.
Ranging behaviour in free-range housing
The free-range approach is now seen to be more natural and healthier for the wellbeing of chickens. But each hen in a flock has a unique range of behavioural patterns. RFID systems have been used to track the outdoor roaming behaviour of certain chickens by attaching tags to the birds and installing antennae at the pop holes that the birds use to enter and exit the building (Gebhardt-Henrich et al. 2014; Campbell et al. 2017; Larsen et al. 2017) [27,31] . Data from hens walking over the antennae is then analysed to determine the frequency and length of visits to the outside regions. These devices may be used to monitor thousands of birds in industrial farms. Additionally, an RFID system based on ultra-wideband technology was created to track the whereabouts of 42 individual hens in the 100 m 100 m experimental area. This system was able to determine the position with an inaccuracy of 0.29 m and a registration rate of 68%. (Stadig et al. 2018a) [45] . [14, 12, 13, 28, 32, 49] .
Materials and Methods
Six 20-week-old Hyline Brown laying hens with an average weight of 1.4 kg were chosen for the research as tracking targets. Prior to starting the data collection, the hens were given a 2 week acclimatisation period. To house the birds, a 1.2 m by 1.5 m enclosure (Fig. 1a,b) was built (Fig. 1c). To guarantee that the level of illumination in the pen region was around 15-20 lux, the test area was illuminated on two sides of the pen using LED lighting from 0500 to 2100 every day. Every day at 1700 h, the chickens were fed twice a day at 0900 h and 1700 h, and their eggs were gathered. Every day, manure was removed, and the barn's temperature was kept at about 20 °C. The cameras used to record footage (Launch, LC5505E7-C83R) were mounted at a height of 2.2 m. The hours when the videos were on were 0500 to 2100. Over 500 h of footage were acquired over the course of the next 30 days. Out of the 500 hours of footage, 10 3-min chunks were randomly selected to test the tracking system, and 778 photos were randomly selected and manually annotated.
Initialization
The startup, tracking, and updating phases made up the tracking algorithm. The target's contour area was manually defined for initialization, and the size of the contour area's smallest outside rectangle was determined using the rotation approach. This smallest outer rectangle was represented as T0w0, h0, a0, c0, where w0 stood for T0's width, h0 for T0's height, a0 for T0's angle with respect to the x-axis, and c0 for T0's centre. Each sample's width and height matched the original tracking rectangle, which was this rectangle.
Binary HSVM model (HSVMb)
A binary classification model, a regression model, and a oneclass model made up the HSVM model. The three HSVM types were sampled in the areas around the first tracking rectangle as follows. First, a model known as the Binary Classification Support Vector Machine (HSVMb) was developed (Vapnik VN 1995) [53] . The tracking-by-detection approach to object tracking (Avidan S. 2001; Tang F. et al. 2007) [3,48] often use the binary model. However, this technique leaves a hazy line between positive and negative samples. The regression model helps in pinpointing the objective more precisely to prevent drift to address this issue. The positive and negative samples for the HSVMb were written as "xi, yi," where "yi" was the label of sample "xi," which was positive. When yi = 1, the sample in the first tracking rectangle, designated as x0, was a positive sample, and xi was the same. Sample xi's position was indicated by l (xi), while T0's location was indicated by l (x0). The training samples were chosen using the distance-based method (Avidan S. 2001, Everingham M. et al. 2010) [3,1] . [3] , was generated using the bounding box overlap area ratio:
One-class support vector machine (HSVMo)
The third model was the HSVM with one class. The oneclass model can discriminate between different layers and may be thought of as an appearance model (Zhang S. et al. 2015) [60] . As a result, following feature extraction during the tracking stage, the confidence score of the candidate samples-chosen in accordance with the tracking strategy-was determined using the HSVM model. The tracking outcome for the current frame was the candidate area with the greatest score (Fig. 2c). We determined whether or not to re-sample for model retraining to accommodate changes in target appearance after receiving the tracking result for the current frame. Figure 2: An illustration of sampling using the three different kinds of SVMs The HSVMo utilised the whole tracking result area of every preceding frame as the training sample, which set it apart from the prior two models. The relative contribution of each HSVM was calculated by the weights of each sub-model. For example, HSVMb performed best for monitoring preening and wing flapping because it embraced the binary categorization and was resistant to changes in bird attitude.
The drift issue was successfully resolved by HSVMr. The test chickens' proximity to one another produced the greatest outcomes. Since HSVMo was less sensitive to a rapidly changing backdrop, it performed well while monitoring quick movements from the hens (Zhang S. et al. 2015) [60] . Wo, wr, and wb were set at 0.3, 0.6, and 0.1 in consideration of the different support vector machines' ability to adapt to various settings as well as the outcomes of repeated tries.
Tracking
The candidate samples were collected around the tracking object during the tracking phase. To choose the top tracking outcomes, the model score was used. The particular steps were as follows:
(a) The first target region was determined using the tracking results from the previous frame. The present frame's towo, ho, ao, and co.
The rotational axis was chosen to be (b) co. To create the shift search area Tmwm,hm, am,cm, the target area was rotated h times in clockwise and counterclockwise orientations, respectively. Where wm = mwa, hm = mha, am = aa, and cm = ca. The whole shift was searched using the search box search area, where the initial value of the search box was w s = w a , h s = h a , and a s = a a . Figure 3 shows a flowchart of the tracking procedure. The optimum tracking area for the current step is shown by a blue box; the position of the tracking box in previous steps is represented by an orange box; and the candidate areas are represented by red dashed boxes. The tracking object is denoted by an ellipse. The candidate regions are chosen, and the best region is chosen.
Updating
A hen's non-rigid body motions may produce a significant change in look as it moves, especially if it rotates or has some of its body partially covered. The model has to be modified to take into consideration how the hens' appearance changes as they move.
To determine if video tracking needed to be updated, the amount of appearance change had to be calculated after each frame (Zhang S. et al. 2015) [60] : The binary HSVM and the regression HSVM both employed the same sampling method for positive samples. Twenty additional negative samples were picked at random to take the place of the original negative samples. (c) The binary HSVM and the one-class HSVM both employed the same sampling method for positive samples. The whole algorithmic process is shown in (Fig. 4).
Results and Discussion
The two most important considerations for evaluating algorithm tracking strategies are real-time functionality and robustness. The HSVM was built in OpenCV on a desktop computer with an Intel Core i2-4150 CPU operating at 3.50GHz. 9.1 seconds per frame on average were achieved. One of the six observational objects, a Hyline Brown hen, was the target of the tracking operation. The other four algorithms that were contrasted with HSVM were Mean Shift, TLD, Frag (Agassiz A. 2006) [2] , and PLS (Wang Q. et al. 2012) [56] . On the website of the original author, all three of these algorithms are available (these two are widely used classical algorithms). Each of these algorithms followed the target hen in the test video. In these 3 trials, the 6 algorithms were tested using 3 distinct tracking targets that were randomly selected. The results are shown in (Fig. 5). To assess the robustness of the algorithm, the overlap rate (OR) was used to quantify the tracking accuracy. For the six aforementioned methods, the overlap rates were determined (Fig. 6). The overlap rate was shown on the statistical graph's vertical axis. While an overlap rate of 0 meant that the computer entirely missed the tracking targets, higher overlap scores indicated more precise tracking. Figure 6a demonstrates that HSVM consistently maintained an overlap rate of around 0.8 for the majority of frames.
Between the 430th and 600 th frames, laying hens gathered together. The overlap rate decreased due to the chickens' mutual occlusion, but the method remained same. Self-adjusted to get an approximate 0.8 overlap rate. The statistical graph for the TLD method is shown in Figure 6b.
The tracking box's drift grew until it missed the target, as seen by the substantial dip in the overlap rate curve in the beginning. Only briefly in the midst of the frames did the tracking box bounce back to the target. The graph for the Frag algorithm is shown in Figure 6c. Because the target hen continued altering its direction of travel, the overlap rate curve fell until it was around 0.4. After then, the curve held onto this value for a while. The tracking box missed the goal as a result of the hen aggregation after the 430th frame, when the overlap rate curve started to drop once again. Throughout the tracking phase, the Particle Filter Algorithm repeatedly lost and found the target. As a consequence, as shown in Fig. , the overlap rate's value fluctuated between 0 and 0.5. 6d, but each time it lost the target hen, it swiftly found it again. Figure 6e demonstrates how the MeanShift Algorithm tracking boxes grew readily when the target hen approached other laying hens, which caused the overlap rate curve to decelerate. The tracking box enlarged rather than losing the target as the hens gathered at the 430th frame. The overlap rate curve did not clearly decline after the 430th frame as a result. When the target hen departed the flock, the tracking box lost the target and remained on the group of chickens. The tracking box was then moved to other laying hens until the target hen and tracking box lined up once again.
The PLS algorithm's overlap rate curve demonstrated generally consistent performance, and the overlap rate value was close to 0.6. However, the curve started to flatten down at the 430th frame, and continued to do so until the tracking box lost the target. Each algorithm responded differently to various circumstances in the movement of laying hens, as shown in the figures above. Table 1 displays the average overlap rate for the various conditions found in the 778 photos. In terms of the overall average overlap rate as well as for the various specific circumstances, Table 1 demonstrates that HSVM outperformed the other algorithms in terms of average overlap rate. The average overlap rate was 35% greater overall than it was for the other algorithms, which had the greatest value. The average overlap rate for HSVM was 68% while tracking a single target in a multi-hen mutual occlusion situation (the most difficult case), which was 41% higher than the greatest value recorded by the other methods. The average overlap rate among the individual instances and the total average was maintained between 68 and 79%, indicating that HSVM remained mostly constant. The PLS method, which is capable of both dimensionality reduction and classification, achieved the greatest performance among the contrast algorithms by modelling the relationship between target appearance and class labels (Wang Q. et al. 2012) [56] . The average overlap rate for the situations of changing directions, mutual occlusion between two hens, and preening was 55, 61, and 62%, respectively. However, PLS struggled to deal with high occlusion, which may rapidly and readily alter targets' appearance (Yan J. et al. 2014) [58] . When numerous hens were mutually occlusive, PLS sometimes lost track of the target hen, causing the average overlap rate to fall to 23%. The Particle Filter Algorithm had the best results (apart from HSVM) for the scenario of many hens mutually occluding each other, with an average overlap rate of just 27%.
| Average overlap rate | HSVM | TLD | Frag | Particl e Filter | Mean Shift | PLS |
|---|---|---|---|---|---|---|
| Change of direction | 0.79 | 0.23 | 0.36 | 0.36 | 0.40 | 0.55 |
| Two hens mutual occlusion | 0.78 | 0.03 | 0.39 | 0.37 | 0.37 | 0.61 |
| Preening | 0.75 | 0.05 | 0.33 | 0.21 | 0.36 | 0.62 |
| Multi hens mutual occlusion | 0.68 | 0.09 | 0.17 | 0.27 | 0.18 | 0.23 |
| All frames | 0.75 | 0.11 | 0.28 | 0.30 | 0.28 | 0.40 |
Table text extracted from the original PDF; superscript letters are shown inline. The original table image is below.
View original table image
The following three requirements have to be fulfilled for the optical flow approach to be employed by the TLD algorithm to track the object. First, there should be very little brightness variation between frames. Second, two consecutive frames' content should alter extremely gradually. The projections of the close-by picture points were also close-by points and had a comparable speed (Sun C. et al. 2015) [47] . Our hen house's lighting was uneven and difficult to maintain. Furthermore, chickens often moved abruptly and quickly, resulting in a TLD overlap rate of just 11% on average. The backdrop was blurry, making it difficult for the TLD to identify the genuine target from it (Zhong W. et al. 2012) [62] . Despite having the benefit of being simple, the MeanShift tracker struggled with quick motion, lighting changes, a crowded backdrop, and occlusion (Phadke G. 2011, Dinh TB. Et al. 2011) [40,19] . The MeanShift tracker's average overlap rate was just 17% higher than TLD's. By anticipating the item's position in the subsequent frame, the particle filter algorithm followed the thing. When the item was momentarily obstructed, it functioned properly. However, the tracking was more likely to fail if the occlusions persisted for a longer period of time (Abramson H. and Avidan S. 2011) [1] . Furthermore, rapid or abrupt motions caused the Particle Filter Algorithm to lose the target (Fujii T. et al. 2009) [25] . As a result, the Particle Filter Algorithm's average overlap rate was comparable to that of the MeanShift tracker. The Frag uses local appearance models to adapt to a variety of settings (Lu H. et al. 2012) [35] . However, Frag struggled in this experiment because it was unable to cope with abrupt changes in appearance (Babenko B. et [37,61,55] , and as a result, its average overlap rate was only 28%. Figure 6 and Table 1 show that, in terms of greater coverage and resilience on the testing sequences, our HSVM tracker outperformed both traditional approaches and current state-ofthe-art technologies.
The following elements contributed to the success of HSVM.
In order to recognise laying hens, the system first employed histograms of orientation gradient characteristics, which accurately characterized the shape of the laying hens. Second, the tracking accuracy was increased by using a novel tracking approach that took into consideration the displacement and body angle of the laying hens. Third, by streamlining the tracking procedure and minimising the number of sample rounds, the method maintained a decent real-time performance even though the histogram of orientation gradient feature extraction required a lot of time.
There is still room for development, despite the HSVM algorithm's great promise. The object edge gradient served as the basis for the histogram of the orientation gradient feature (Fig. 7). As a result, the HSVM algorithm may potentially lose track of the tracking object if it is heavily obscured over an extended period of time. The stocking density in this experiment was not excessive, and this circumstance only sometimes appeared in the recordings. The stocking density will be raised in subsequent studies to investigate methods for enhancing the algorithm's resilience. Figure 7: Results of the histogram of the orientation gradient feature utilized in the HSVM track as shown in visualization
Conclusions
In order to monitor a single hen among a flock of chickens beneath a floor system, a laying hen tracking algorithm based on the HSVM was created in this study. The experimental findings demonstrated that the method outperformed other similar algorithms in terms of resilience and real-time performance, demonstrating that HSVM has significant practical utility in the sector. The HSVM has many potential applications since it did not need a sensor to function. We can categorise the behaviour of the laying hens using the tracking strategy to accomplish automated recognition. We will research a technique to modify the size of the tracking box depending on the size change of the moving tracking targets in order to increase the average overlap rate in subsequent work.
Figures and tables from the paper
References
55 in the original paper- Abramson H, Avidan S. Tracking via dispersed occlusion, Workshops on Computer Vision & Pattern Recognition at the IEEE Computer Society Conference. Institute of Electrical and Electronics Engineers; c2011. p. 1-8. doi:10.1109/CVPRW.2011.5981674.
- Agassiz A. Strong fragments-based tracking with the help of the integral histogram, Conference on Computer Vision & Pattern Recognition of the IEEE Computer Society. Institute of Electrical and Electronics Engineers. 2006;1:798-805.
- Avidan S. Support vector tracking, Journal of Pattern Analysis and Machine Intelligence. Institute of Electrical and Electronics Engineers. 2001;26(8):1064-1072.
- Aydin Measures of lying are automatically classified in order to determine how lamely broilers are. In Animal Welfare. 2015;24(3):335-343
- Aydin A, Berckmans D. Using sound technology to automatically monitor the broiler birds' short-term eating habits. Agriculture Computers and Electronics. 2016;121:25-31.
- Aydin, Bahr, Viazzi, Exadaktylos, Buyse, Berckmans. A new technique using sound technology to assess the feed intake of broiler chicks automatically. Agriculture: Computers and Electronics. 2014;101:17-23.
- Babenko, Yang, Belongie. Robust object tracking using online multiple instance learning. IEEE Trans Pattern Analogical Machine Intell. 2011;33(8):1619-32.
- Shushtari A, Sadeghi M, Banakar A. An intelligent tool for detecting avian illnesses including avian influenza, infectious bronchitis, and Newcastle. Agriculture's use of Computers and Electronics. 2016;127:744-753.
- Berckmans D. Technologies for managing wellbeing in intensive livestock systems using precision livestock husbandry. Office International des Epizooties, Scientific and Technical Review. 2014;33(1):189-196.
- Lee C, Downing JA, Hinch GN, Campbell DLM. Fear and coping mechanisms in free-range laying hens that favour the outdoors, the mild outdoors, and the inside. Applied Animal Behaviour Science. 2016;185:73-77.
- Lee C, Little BA, Warin L, Hinch GN, Dyall TR, Campbell DLM, et al. The effects of outdoor stocking density on range utilisation in free-range laying hens were radio-frequency identified. Animal. 2015;11(1):121-130.
- Chien YR, Chen YX. An experimental investigation of the behaviour and laying efficiency of individual chickens using an RFID-based smart nest box. Sensors. 2018;18(3):859. Doi: 10.3390/s18030859.
- Colles FM, Cain RJ, Nickson T, Smith AL, Roberts SJ, Maiden MCJ, et al. Monitoring the behaviour of flocks of chickens may detect Campylobacter infections in humans early on. Royal Society of London B: Biological Sciences. 2016;283(1822):20152323.
- Donnelly CA, Nickson T, Roberts SJ, Cain RJ, Dawkins MS. Using optical flow, bodyweight, and water intake, broiler chicken flocks may be warned of footpad dermatitis and hockburn early on. Animal Health Record. 2017;180(20):499-U60.
- In De Jong IC, Hindle VA, Butterworth A, Engel B, Ferrari P, Gunnink H, et al. Published a study on the topic. Streamlining the process for evaluating the Welfare Quality ((R)) of broiler chicken welfare. Species. 2016;10:117-127.
- Dinh TB, Vo N, Medioni G. Context tracker: Exploring supports and distracters in unrestricted contexts. IEEE Conference on Computer Vision and Pattern Recognition (CVPR). IEEE Trans. Power Electronics 2011;2011:1177-84.
- Everingham M, Van Gool L, Williams C, Winn J, Zisserman A. Pascal visual object classes challenge results. 2005;1(6):7. Available from www. Pascalnetwork. org.
- Butterworth A, Fontana I, Tullo E, Guarino M. A creative strategy to forecast the expansion of intensive poultry farming. Computers and Electronics in Agriculture. 2015;119:178-183.
- Butterworth A, Vranken E, Norton T, Berckmans D, Fontana I, Tullo E, et al. A reliable analysis to predict chicken broiler weight. Poultry Science. 2016;96(11):3938-3943.
- Bench CJ, Tierney KB, Fraess GA. Automated evaluation of two heritage chicken breeds' behavioural reactions to a feeding event. Applied Animal Behaviour Science. 2016;179:74-81.
- Particle filters are used in a poultry monitoring system using a camera developed by Fujii, Yokoi, Tada, and Suzuki. IEEE Trans. Power Electronics; c2009. doi:10.1109/ROBIO.2009.4913289.
- Frohlich EKF, Gebhardt-Henrich SG. Keel bone fractures are more likely when lying and bumble foot first appear. Animals. 2015;5(4):1192-1206.
- Toscano MJ, Gebhardt-Henrich SG, Frohlich EKF. Different-sized flocks of laying hens use outdoor ranges. Applied Animal Behaviour Science. 2014;155:74-81,
- Hartcher KM, Hickey KA, Hemsworth PH, Cronin GM, Wilkinson SJ, Singh M, et al. Relationships between fearfulness and plumage damage in free-range laying hens, as measured by radio frequency identification technology. Animal. 2016;10(5):847-853.
- Kalal Z, Matas J, Mikolajczyk K. PN learning: Bootstrapping binary classifiers by structural constraints. IEEE Conference on Pattern Recognition and Computer Vision. 2010;238(6):49-56.
- Larsen H, Cronin GM, Gebhardt-Henrich SG, Smith CL, Hemsworth PH, Rault JL. Individual ranging behaviour patterns in commercial free-range layers as observed through RFID tracking. Animals. 2017;7(3):21.
- Gebhardt-Henrich SG, Cronin GM, Larsen H, Hemsworth PH, Smith CL, et al. Individual ranging behaviour and wellbeing in commercial free-range laying hens Species. 2018;12(11):2356-2364.
- Chang HH, Lee J, Noh B, Jang S, Park D. Others By using sound analysis, laying hens' stress levels may be identified and categorised. Journal of Animal Sciences in Asia and Australia. 2015;28(4):592-598.
- Xin H, Liu K, Zhao Y, Oliveira J, Verhoijsen W, Li L, et al. A UHF RFID device for monitoring the individual feeding and nesting habits of laying hens kept in communal housing. ASABE Transactions. 2017;60(4):1337-1347.
- Lu H, Jia X, Yang MH. Visual tracking using an adaptive structural local sparse appearance model. IEEE Conference on Pattern Recognition and Computer Vision. Institute of Electrical and Electronics Engineers; c2012. p. 1822-1829. IEEE Computer Society. Doi:10.1109/CVPR. 2012.6247880.
- Manteuffel G, Puppe B, Schon PC. Farm animal vocalisation is used as a wellbeing indicator. Applied Animal Behaviour Science. 2021;88:163-182.
- McGrath N, Dunlop R, Dwyer C, Burman O, CJC. When expecting certain rewards, hens alter their vocal repertoire and structure. Animal Behaviour. 2017;130:7996.
- Xin H, Wu H, Oliveira JL. Effect of feeder area on the productivity and eating habits of laying hens in enhanced colony housing in Animal. 2018;13:374-383.
- Garcia RG, Pereira EM, Naas ID. Broilers' vocalisations may be used to determine their sex and genetic strain. Agricultural Engineering. 2015;35:192-196.
- Phadke G. Robust multiple target tracking in the presence of obstruction using the Kalman filter and fragmented mean shift. International Communications and Signal Processing Conference; c2011. p. 517-521. doi:10.1109/ICCSP.2011. 5739376.
- Toscano MJ, Wurbel H, Harlander-Matauschek A, Ringgenberg N, Frohlich EKF, Roth BA, et al. Effects of different nest curtain designs on domestic hens' prelaying behavior. Applied Animal Behaviour Science. 2015;170:34-43.
- Brown-Brandl TM, Gates RS, Sales GT, Green AR, Eigenberg RA. Measuring the effectiveness of a passive low-frequency RFID system's detection in a laying hens' preferred habitat. Computers and Electronics in Agriculture. 2015;114:261-268.
- Siegford JM, Berezowski J, Biswas SK, Daigle CL, Gebhardt-Henrich SG. Employing current technology to monitor the movement and whereabouts of specific laying hens in huge groups. Animals. 2016;6(2):01-10. Animals the number 10.3390/ani6020010;
- Bell AM, Johnson JC, Ziemba RE, Sih A. Overview of behavioural syndromes with integration. Quarterly Review of Biology. 2021;79:241-277.
- Sun, Zhu, Liu. Using the TLD algorithm and the Kalman filter together for target tracking. Control Meeting (CCC). 2015;3736-41. doi:10.1109/ChiCC.2015. 7260218.
- Tang F, Brennan S, Zhao Q, Tao H. Co-tracking using semi-supervised support vector machines. The IEEE International Conference on Computer Vision Proceedings (ICCV); c2007. p. 1-8. doi:10.1109/ICCV.2007.4408954.
- Rault JL, Gebhardt-Henrich SG, Groves PJ, Taylor PS, Hemsworth PH. In commercial free-range broilers, ranging behaviour is related to welfare measures both before and after range access. Poultry Science. 2018;97(6):1861-1871.
- Norton T, Berckmans D, Diana A, Tullo E, Fontana I, Guarino M, et al. Application note: Labelling is a process for creating trustworthy PLF algorithms. Agriculture's Use of Computers and Electronics. 2017;142:424-428.
- Valletta JJ, Madden J, Kings M, Torney C. Applications of machine learning to the study of animal behaviour. Animal Behaviour. 2017;124:203-220.
- Norton T, Berckmans D, Fernandez AP, Van Hertem T, Rooijakkers L, Berckmans D, et al. Acceptance of Precision Livestock Farming is largely dependent on effective data visualisation. Computers and Electronics in Agriculture. 2017;138:1-10.
- Vapnik VN. The nature of statistical learning theory, IEEE Transactions on Neural Networks. Institute of Electrical and Electronics Engineers. 1995;10(5):988-99.
- Wang C, Chen H, Zhang X, Meng C. Evaluation of a hybrid support vector machine-based laying-hen tracking method. Animal Science and Biotechnology Journal. 2016;7:60. DOI: 10.1186/s40104-016-0119-3.
- Wang D, Lu H, Yang MH. Online object tracking using sparse prototypes. IEEE Trans. Image Processing 2013;22(1):314-25.
- Wang Q, Chen F, Xu W, Yang MH. Partial least squares analysis for object tracking. A publication of the IEEE Signal Processing Society. IEEE Transactions on Image Processing. 2012;21(10):4454-65.
- Wathes CM, Kristensen HH, Aerts JM, Berckmans D. Is precision livestock farming a farmer's salvation or a farmer's worst nightmare, an animal's buddy or enemy? Computers and Electronics in Agriculture. 2008;64(1):210,
- Yan J, Chen X, Deng D, Zhu Q. Structured partial least squares based appearance model for visual tracking. Neurocomputing. 2014;144:581-95.
- Wang L, Duan WJ, Guo LH, Chen LC, Zhang FY, Hu YM, et al. Using an RFID radio frequency network, poultry behaviour is being monitored. International Journal of Agricultural and Biological Engineering. 2016;9(6):139-147.
- Zhang S, Sui Y, Yu X, Zhao S, Zhang L. Hybrid support vector machines for reliable object tracking. Recognizing Patterns. 2015;48(8):2474-88.
- Zhong W, Lu H, Yang MH. Robust Object Tracking through Sparse Collaborative Appearance Model. IEEE Trans. Image Processing. 2014;23(5):2356-68.
- Zhong W, Lu H, Yang MH. Robust object tracking using a sparsity-based collaborative model, IEEE Conference on Pattern Recognition and Computer Vision. c2012. p. 1838-1845. doi:10.1109/CVPR.2012.6247882.