
Research article · 2022 · Full text
International Journal of Geography Geology and EnvironmentHousehold domestic water consumption patterns in a rural semi-arid village: A case study of Kumbha village in Hisar district, Haryana
Volume 4(2) · Pages 01–05 · DOI: 10.22271/27067483.2022.v4.i2a.105 ↗
Research areasWater resources management and optimizationWater-Energy-Food Nexus StudiesWater Governance and Infrastructure
Abstract
Author-writtenThe need for water in India is increasing as a result of development, both in urban and rural areas. This could exacerbate tensions and conflicts over the distribution of water sources. Understanding the specifics of actual water use on a household level is critical for water demand management. As a result, based on questionnaires and interview surveys of 105 households consisting 10 per cent of total households, this paper investigates the pattern of domestic water consumption in semi-arid Kumbha village of Hisar district in Haryana state of India, in order to better understand how local communities in the region relate to water. The study looked at household water usage on a daily and activity basis, as well as the sources, quality, duration of water supply, and awareness of water storage. According to the study's findings, the village's daily average water usage is 105 per person per capita per day. Cloth washing uses the most water utilized activity. The Calculated value of chi square test is greater than tabulated value hence null hypothesis is rejected at 5% level of significance. It is found that the people with high income utilize more water than the others. However most of residents are dissatisfied with the duration of their water supply, and 38 per cent are unaware of conservation technologies. This needs to be addressed immediately by affecting public perception through the media and conducting public awareness campaigns. It is believed that the study's findings may assist Indian policymakers and planners in optimising current water resources for rural development.
Summary
Source-checkedPlain-language reading of the full paper, prepared with AI and checked against the text. Each point links to the authors' own words.
Why it matters
- Increasing water demand in India due to development may lead to heightened tensions and conflicts regarding the distribution of water sources. View evidence ↗
- Detailed knowledge of water usage at the household level is essential for effective water demand management. View evidence ↗
- In semi-arid and dry climates, water is a highly sensitive and significant issue because freshwater sources are limited. View evidence ↗
The question
- The study aims to investigate domestic water consumption patterns in Kumbha village, Haryana, to understand the relationship between local communities and water. View evidence ↗
What they did
- The researchers surveyed 105 households, representing 10% of the total households in the village, using questionnaires and interviews. View evidence ↗
- Water consumption was estimated by measuring the volume and number of vessels used, as well as the flow rate and duration of running tap water. View evidence ↗
- Households were divided into four socio-economic categories (Sec-A to Sec-D) based on annual income, ranging from under 25,000 to over 100,000 rupees. View evidence ↗
- A Chi-Square test was used to analyze the association between the economic status of residents and their domestic water consumption. View evidence ↗
What they found
- The average daily domestic water consumption in Kumbha village is 468 liters per household and approximately 105 liters per capita. View evidence ↗
- Washing clothes is the most water-intensive domestic activity in the village, accounting for about 21% of total household water use. View evidence ↗
- Residents primarily rely on hand pumps for drinking water, followed by paid supplies, with very few using the government supply. View evidence ↗
- Water supply is erratic, with over 70% of households receiving domestic water only once a week and the rest receiving it 2-3 days a week. View evidence ↗
- Awareness of rainwater harvesting is low, with only 40% of households aware of the technology and 38% completely unaware. View evidence ↗
- A Chi-Square test (calculated value 1584.20 vs tabulated 128) showed a significant association between economic status and water use, with higher-income groups consuming more water. View evidence ↗
What it means
- The authors recommend that local and state governments prioritize increasing public awareness of water conservation and management methods. View evidence ↗
- The authors suggest that the findings from Kumbha village may be applicable to other similar semi-arid villages across India. View evidence ↗
- The use of annual income as the primary indicator for socio-economic classification carries a risk of under-reporting or over-reporting by respondents. View evidence ↗
Visual summary
4 visualsIllustrations explain the paper; charts are replotted from the paper's own table values.
Domestic Water Use Distribution
AI-generated conceptual illustration (Rural domestic water usage in a semi-arid village). It explains the idea and does not show study data.
View source evidence ↗
Income vs Water Consumption
AI-generated conceptual illustration (Rural domestic water infrastructure in a semi-arid village). It explains the idea and does not show study data.
View source evidence ↗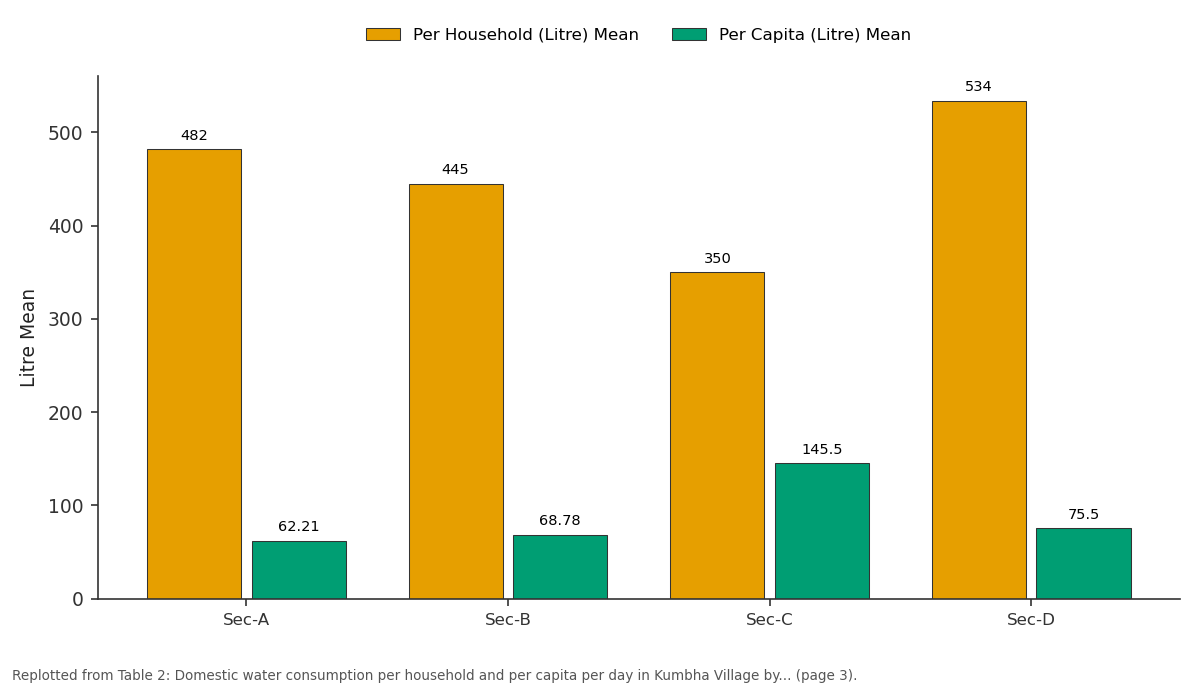
Per Household (Litre) Mean and Per Capita (Litre) Mean: Sec-A vs Sec-B vs Sec-C vs Sec-D
Replotted from Table 2 (page 3) of the original paper. Every bar is the paper's own table value.
View source evidence ↗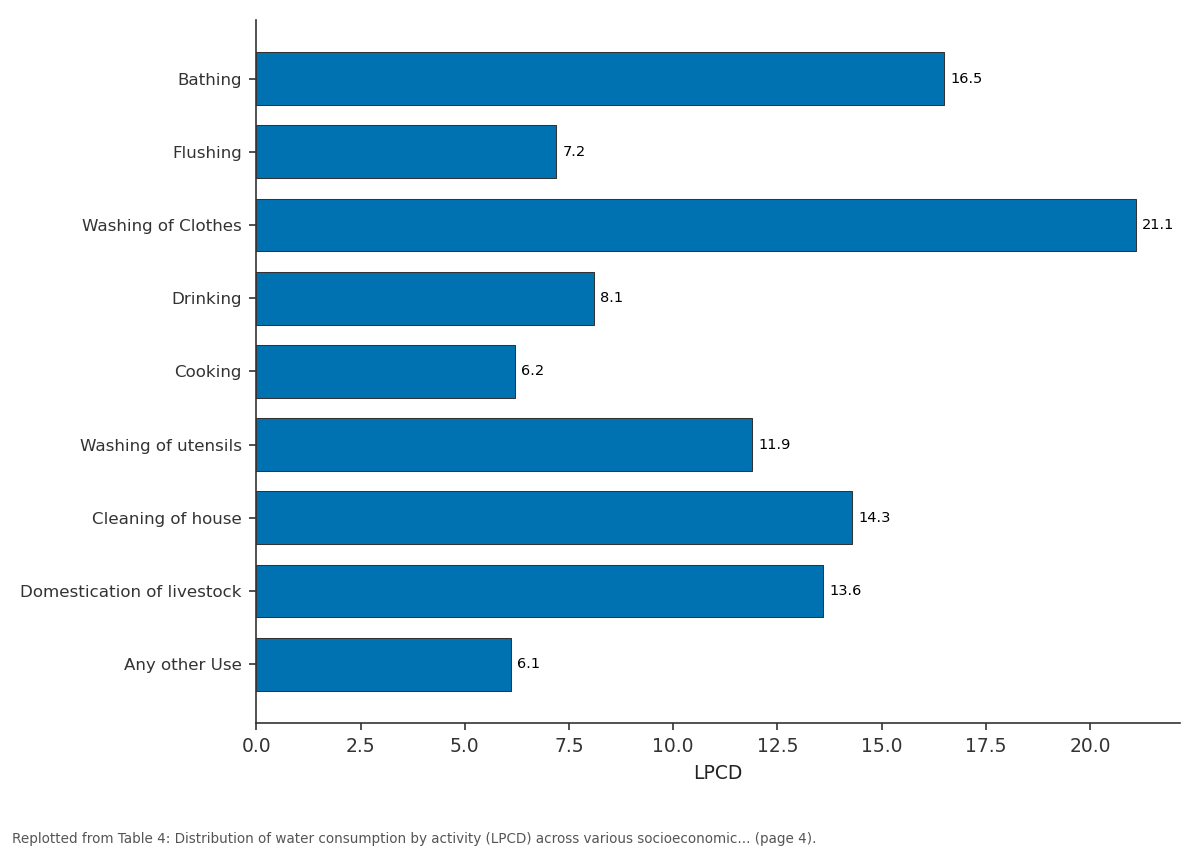
Daily Water Consumption: Bathing vs Flushing vs Washing of Clothes vs Drinking vs Cooking
Replotted from Table 4 (page 4) of the original paper. Every bar is the paper's own table value.
View source evidence ↗Figures & tables
From the original paper Table 1
 Table 2
 Table 3
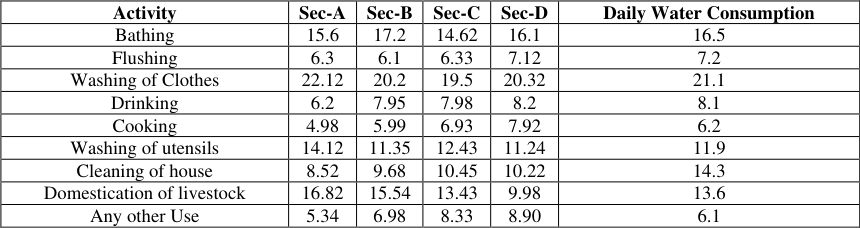 Table 4
 Table 5
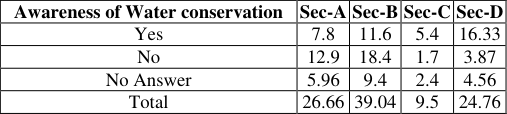 Table 6
Introduction
The world's and humanity's greatest pressing problem is not the threat of war, pandemic, or the breakdown of civil government, but the overwhelming problem of water scarcity (Jury and Vaux 2006) [7] . Household, particularly women and children, suffer greatly as a result of water scarcity, as they must spend many hours each day gathering water from far away sources (Gopaldas and Gujral 1995) [6] . Water is necessary for life, and it serves as a cornerstone for any country's social and economic development. It is primarily used in the residential, agricultural, and industrial sectors. Furthermore, food production is largely dependent on water availability at the agricultural production. In the twenty-first century, rising population and urbanization, combined with climate change, may diminish global water supplies (Murad et al. 2007; Wheida and Verhoeven 2007) [10] . Because the world's population will reach 9 billion people by the year 2050, considerably more water will be required to produce food in the future. Rural areas in developing countries are sometimes overlooked when it comes to water supply. When such facilities are available, they are rarely used to their full potential (Briscoe and DeFerranti 1988; World Health Organization 1992; Sharma et al. 1996) [3,18,15] . Due to the limited freshwater sources, water is regarded one of the most significant and sensitive issues in dry and semi-arid climates (Nyong and Kanaroglou 1999, 2001; AlKhatib et al. 2003) [11,12] . Increased pressure on water resources as a result of population growth accelerates the requirement for not only good water supply management but also proper water demand management (White and Fane 2002; Mathurasa 2005) [17,9] . The demand for water in India is increasing in both urban and rural areas as a result of population growth and economic development. The average annual fresh water availability per capita has decreased from 5,177 m3 in 1951 to 1,820 m3 in 2001, and it is expected to decrease further to 1,341 m3 in 2025 and 1,140 m3 in 2050. (Kumar et al. 2005).
Increased pressure on water resources as a result of population growth accelerates the requirement for not only good water supply management but also proper water demand management (White and Fane 2002; Mathurasa 2005) [17,9] . Reduced availability may exacerbate tensions and disputes over water resource sharing (Rao 1975; Shaban and Sharma 2007) [13,14] . A large segment of the population in the weaker parts of society (both in rural and urban regions) wastes time collecting water for their daily requirements. As a result, knowledge about a population's water consumption pattern (village) is critical for estimating the best use of available water resources. Such investigations are critical in the development of a comprehensive water policy for rural areas that will meet the growing demands of the villagers. Furthermore, the current study's results and findings with respect to Kumbha village in Hisar district will be practical, valuable, and significant, and will serve as a model for rural sector water resource management in Haryana.
Materials and Methods
The current study was conducted at the micro-level in Haryana's semi-arid zone, in Kumbha village of Hisar district. The village is a part of Ghaggar-Yamuna alluvial plain. In Hansi tehsil of Hisar district, this village is situated between 29°7'51"N Latitude and 76°4'26"E longitude at international map. It covers an area of about 1932 hectares. The village is almost flat, with sandy and sandy loam soils of medium texture. Organic matter and nutrients are poor in soils. The village's main crops are wheat, cotton, and rice, while minor crops include bajra, jowar, mustard, and vegetables. These crops are grown using a combination of semi-automated and traditional labour. The Bhakra canal system provides agricultural feed to the village, and agricultural fields are generally irrigated by lined canals. The village's livestock includes buffaloes, cows, sheep, and goats. The majority of the village's households are belongs to small and medium-size farmers who engage in intensive farming. Agriculture and livestock are the pillars of the village economy.
Data collection on consumption pattern of Domestic Water
On a household level, knowing the details of real water use and its end use, such as drinking, washing utensils, toilet flushing, bathing, and clothes washing, is critical for water demand management. However, in most underdeveloped nations, including India, obtaining such information is extremely difficult. As a result, the majority of the data for this study derived from primary sources. Water scarcity is a visible occurrence in the semi-arid Kumbha village of Hisar district, and extensive research at the household level pertaining to domestic water consumption patterns at the micro-level as a specific case have yet to be done in the state and country. As a result, the entire research methodology used in this work is interdisciplinary and descriptive. The household survey included questions regarding daily and activity-specific consumption, water supply sources, quality, duration and frequency, distance among sources, and awareness of rainwater harvesting technologies in the village. Housewives were the target demographic.
Estimation of water consumption
The volume of the vessels used to keep household water was measured, as well as the number of vessels used for various tasks. When using running tap water, the quantity of water per minute that came out of the tap was measured as well as the duration for which the tap was used. The volume of water utilised through a running tap was calculated by multiplying the duration by the quantity of water per minute. The amount of water used in a toilet was calculated based on the volume of buckets used and the capacity of the flush tank. The evaluation of the quantity of data and water utilised in various activities was a tough undertaking, but every effort was taken to ensure that the data was accurate.
Classification of socio-economic categories
Based on the annual income of the households in Kumbha village, the self-collected data of households was categorised into four socio-economic classes. These four classes are Sec-A (<25000), Sec-B (25000-49999), Sec-C (50000-100000) and Sec-D (>100000). In general, a household assets score rather than annual income is recommended for dividing households into distinct socioeconomic categories. In addition, the major wage earner's education, occupation, and land holdings can be used to classify socio-economic classes. The selection of household annual income as the primary indicator for categorising various socioeconomic categories in the current study was justified on the grounds that it is simple to use and understanding. Under this indicator, however, there is a greater risk of respondent households under report and over report of data related to annual income. The following statistics were employed in this study: frequency, percentage, means, and standard deviation were all of which were calculated using a Microsoft Excel spreadsheet. Chi-Squre test also employed to know about the association with economic status and domestic water consumption on the people of Kumbha village.
Results and discussion
Results and discussion
Daily domestic consumption of water
It has been calculated that the residents of Kumbha village use 49150 of domestic water each day (Table 1). Sec-B households used the most domestic water in the village, followed by Sec-D households. More than 65 percent of the village's total household water use was accounted for by these two socioeconomic classes. The Sec-C and Sec-A group families used the minimum amount of domestic water, which was 7.9 and 27.46 percent of the village's overall usage. [4,5] . The WHO also divided the availability and access to water into four categories. (WHO 1997, 2003; Bartram 2003) [19] . These categories are:
| Socio-economic Classes | No. Households | Total Consumption | Percent |
|---|---|---|---|
| Sec-A | 28 | 13500 | 27.46 |
| Sec-B | 41 | 18250 | 37.13 |
| Sec-C | 10 | 3500 | 7.92 |
| Sec-D | 26 | 13900 | 27.49 |
| Total | 105 | 49150 | 100 |
Table text extracted from the original PDF; superscript letters are shown inline. The original table image is below.
View original table image
(1) no access (water availability below 5 LPCD), (2) basic access (average of 20-50 LPCD), (3) intermediate access (average of 50-100 LPCD), and (4) optimal access (average of 100-200 LPCD). In the village, the average daily domestic water use per household is 468 liter, while the daily domestic water use per capita is around 105 liter.
Source of water for domestic and drinking uses
The majority of household in Kumbha village depend on the govt water supply for their domestic requirements. But in context to drinking water, majority of household depend on hand pump. Up to 81 per cent household from Sec-C category depend on hand pump followed by 80 per cent household from Sec-A category, 75 per cent from Sec-B category for their drinking water purposes. Majority of households form Sec-D category depend on paid supply, followed by Sec-B category for their drinking water needs. Table 3 shows that the residents of Kumbha village depend on Hand pump followed by Paid supply and very few residents use Government water supply for their drinking water needs because the quality of government supply was not fit for the health. The field survey revealed that the water supply is subject to significant seasonal variations in the villages as well. During the summer, the village's water supply crisis gets even worse. Respondents were asked to list the activities they would be willing to give up in the face of water scarcity in order to get information about how people manage their water use during these periods. Few households in the village claimed that they would go to long lengths to obtain water in order to continue their water use habits rather than forego any of their household tasks. The majority of households said that they would be willing to give up household cleaning and limit water use for toilet flushing and clothes washing in order to deal with the summer time water shortage. Additionally, households use the village's water tanker facility on a paid basis to solve the issue of water supply during the summer. An additional investigation showed that affluent households utilized tanker services more frequently than poorer ones.
| Source of Drinking Water | Sec-A | Sec-B | Sec-C | Sec-D |
|---|---|---|---|---|
| Government Supply | 20 | 5 | 4 | 6 |
| Hand pump | 80 | 75 | 81 | 60 |
| Paid Supply | 0 | 20 | 15 | 34 |
Table text extracted from the original PDF; superscript letters are shown inline. The original table image is below.
View original table image
Perception of water quality
For rural communities in developing nations, no agreement has been reached on acceptable drinking water quality criteria. Due to the technical nature of the issue, many studies believe that creating water quality standards is the sole responsibility of specialists or planners. Sheat (1992) [16] has emphasised, however, that planners must take into account how water consumers perceive the quality of the water. He argues that, particularly when it comes to drinking water quality, perception may very well override reality. This perception among the locals is founded on their indigenous knowledge and needs to be treated seriously. According to the field observation in Kumbha village, it is found that the quality of water is not fit for drinking as well as domestic use. Many residents claimed that the quality of water supplied to them is not of good quality, so the people of village cover long distance for their drinking purposes.
Quantity of water consumption for different domestic activities
The amount of domestic water that a household needs depends on a number of variables, including the environment, culture, eating habits, degree and kind of development, and physiology. In Kumbha village, washing clothing uses the most water per household, accounting for roughly 21 percent of total usage. This is followed by consumption for bathing (16.5 Per cent), domesticating livestock (13.6), housecleaning (14.3 per cent) and washing of utensils (11.9 per cent). A household uses less than 10 per cent of its total water usage for drinking and cooking, on average. Significantly decreased household income levels less water will be consumed under different activities, and vice versa. Additionally, some of the water consumption rates for various activities were confirmed using on-site measurements and direct observations, and it was discovered that the amount of water reported by the households closely matched what was seen during the survey. Additionally, 1-2 times per day on average were recorded for bathing and using the toilets. Three meals are prepared each day. Further, Kumbha is a rural area where most of households wash their clothes by hand.
Duration of water supply
The quality of the water supplied to households is not the only issue; its availability is also critical. Water supply in households for 24 hours a day is unheard of in Indian villages. Because the supply is erratic and only available for a limited time, households store water in tanks and drums. In Kumbha village more than 70 per cent of households claimed that they get water for domestic uses in once in week and remaining households get water only for 2-3 days in a week. Status on duration of water supply in Kumbha village given in table 5.
| Duration of Water supply | Sec-A | Sec-B | Sec-C | Sec-D |
|---|---|---|---|---|
| 2 Days in a Week | 21.42 | 17.07 | 30 | 46.15 |
| Once in a week | 78.58 | 82.93 | 70 | 53.85 |
Table text extracted from the original PDF; superscript letters are shown inline. The original table image is below.
View original table image
Awareness about water conservation
Water conservation has the potential to play a significant role in addressing rural water supply challenges. However, awareness of rainwater harvesting is insufficient in Kumbha village, with only 40 per cent of households aware of the technology, while 38 per cent are unaware (Table 12). About 22 per cent of households did not respond to the question about their knowledge of water conservation practices. In all four socioeconomic classes in the village, approximately 16 percent of Sec-D households are aware of water conservation practices, followed by approximately 11 percent of Sec-B households, 7.8 per cent of Sec-A households, and 5 percent of Sec-C households. Because water conservation technology leads to adaptation, local and state governments must place special emphasis on spreading awareness about various methods of water conservation and management. Kumbha village is a semi-arid Indian village. Other villages of comparable size, physical evolution, and climatic environment in India's semi-arid region are likely to be symptomatic of the Kumbha village's domestic water consumption pattern characteristics. As a result, it is hoped that the findings of this study can be extrapolated and applied to other villages in India's semiarid region.
Association with Economic Status and Water Utilized by People of Kumbha village for Domestic Purposes
The area under study is categorized according to economic status that are Sec-A (<25000 rupees per annum), Sec-B (25000-49999 rupees per annum), Sec-C (50000-99999 rupees per annum) and Sec-D (>100000 rupees per annum). A study is conducted to test if there is any significant difference between different economic groups and quantity of water utilized for various domestic purposes. For this the hypotheses is: H0: Economic status of people is independent of the quantity of water utilized for domestic purposes. H1: Economic status of people of Hisar district is dependent of the quantity of water utilized for domestic purposes. The Calculated value of chi square is 1584.20 which greater than tabulated value is 128, hence H 0 is rejected at 5% level of significance. It is concluded that the economic status of people and water utilized by them for domestic use is significantly associated. It was noticed that people of high income group utilize more water than that of people with low income group.
Conclusion
Water-intensive economic activities and population growth are to blame for the world's declining per capita water availability. Increased consumption by the privileged class puts additional strain on this depleting natural resource. A systematic rise in rural water supply would check the high degree of migration from rural to urban areas in search for employment. Water consumption in Kumbha village is significantly lower than WHO standards. The erratic and limited duration of water supply in the village is a common phenomenon. This has forced the villagers to rely on alternative water sources, such as private tube wells, hand pumps, and private vendors who deliver water via tankers. As a result, new water markets are emerging in the village, and private water vendors are in high demand during the summer season.
Figures and tables from the paper
| Socio-economic Classes | Per Household (Litre) Mean | Std. deviation | Per Capita (Litre) Mean | Std. deviation |
|---|---|---|---|---|
| Sec-A | 482 | 321.02 | 62.21 | 24.19 |
| Sec-B | 445 | 285.67 | 68.78 | 19.64 |
| Sec-C | 350 | 240.41 | 145.5 | 99.66 |
| Sec-D | 534 | 359.21 | 75.5 | 35.00 |
Table text extracted from the original PDF; superscript letters are shown inline. The original table image is below.
View original table image
| Activity | Sec-A | Sec-B | Sec-C | Sec-D | Daily Water Consumption |
|---|---|---|---|---|---|
| Bathing | 15.6 | 17.2 | 14.62 | 16.1 | 16.5 |
| Flushing | 6.3 | 6.1 | 6.33 | 7.12 | 7.2 |
| Washing of Clothes | 22.12 | 20.2 | 19.5 | 20.32 | 21.1 |
| Drinking | 6.2 | 7.95 | 7.98 | 8.2 | 8.1 |
| Cooking | 4.98 | 5.99 | 6.93 | 7.92 | 6.2 |
| Washing of utensils | 14.12 | 11.35 | 12.43 | 11.24 | 11.9 |
| Cleaning of house | 8.52 | 9.68 | 10.45 | 10.22 | 14.3 |
| Domestication of livestock | 16.82 | 15.54 | 13.43 | 9.98 | 13.6 |
| Any other Use | 5.34 | 6.98 | 8.33 | 8.90 | 6.1 |
Table text extracted from the original PDF; superscript letters are shown inline. The original table image is below.
View original table image
| Awareness of Water conservation | Sec-A | Sec-B | Sec-C | Sec-D |
|---|---|---|---|---|
| Yes | 7.8 | 11.6 | 5.4 | 16.33 |
| No | 12.9 | 18.4 | 1.7 | 3.87 |
| No Answer | 5.96 | 9.4 | 2.4 | 4.56 |
| Total | 26.66 | 39.04 | 9.5 | 24.76 |
Table text extracted from the original PDF; superscript letters are shown inline. The original table image is below.
View original table image
References
21 in the original paper- Al-Khatib I, Kamal S, Taha B, Hamad J, Jaber H. Water-health relationships in developing countries: A case study in Tulkarem district in Palestine. International Journal of Environmental Health Research. 2003;13(2):199-206.
- Aluko OJ, Eniola O, Shaib Rahim HO, Lawal MO, Agboola FO, Roberts AE. Extent of remittances to households in villages around onigambari forest reserve of Oyo state, Nigeria. Int. J Agric. Food Sci. 2020;2(2):08-10. DOI: 10.33545/2664844X.2020.v2.i2a.35
- Briscoe J, De Ferranti, D. Water for rural communities: Helping people help themselves. Washington, DC: The World Bank, 1988, 32-34p.
- Dieterich BH, Henderson JM. Urban water supply conditions and needs in seventy-five developing countries. Switzerland, Geneva: World Health Organization Public Health Papers, 1963, 23.
- Gleick PH. Basic water requirements for human activities: Meeting basic needs. Water International. 1996;21(2):83-92.
- Gopaldas T, Gujral S. Girl child and environment. Social Change. 1995;25(2-3):226-234.
- Jury WA, Vaux HJ. The role of science in solving the world's emerging water problems. Proceeding of National Academy of Science USA. 2006;102(44):15715-15720.
- Kumar R, Singh RD, Sharma KD. Water resources of India. Current Science. 2005;89(5):794-811.
- Mathurasa L. Analysis and forecast of domestic water end-uses in Khon Kaen province. IWA, Bangkok: Proceedings of the Aqua Asia Forum, 2005.
- Murad AA, Al Nuaimi H, Al Hammadi M. Comprehensive assessment of water resources in the United Arab Emirates. Water Resources Management. 2007;21(9):1449-1460.
- Nyong AO, Kanaroglou PS. Domestic water use in rural semi-arid Africa: A case study of Katarko village in Northeastern Nigeria. Human Ecology. 1999;27(4):537-555.
- Nyong AO, Kanaroglou PS. A survey of household domestic water use patterns in rural semi-arid Nigeria. Journal of Arid Environments. 2001;49(2):387-400.
- Rao KL. India's water wealth. New Delhi: Orient Longman Ltd, 1975.
- Shaban A, Sharma RN. Water consumption pattern in domestic households in major Indian cities. Economic and Political Weekly. 2007;9(23):2190-2197.
- Sharma NP, Damhaug T, Gilgan-Hunt E, Grey D, Okaru V, Rothberg D. African water resources: Challenges and opportunities for sustainable development. Washington, DC: World Bank Technical, 1996, 331pp.
- Sheat A. Public perception of drinking water quality: Should we care? Christchurch, New Zealand: New Zealand Water Supply and Disposal Association Annual Conference, 1992.
- White SB, Fane SA. Designing cost effective water demand management programs in Australia. Water Science and Technology. 2002;46(6-7):225-232.
- World Health Organization. Report on the WHO commission on health and environment. Geneva, Switzerland: WHO. 1992.
- World Health Organization. Guidelines for drinking water quality: surveillance and control of community supply, (2nd ed.). Geneva, Switzerland: WHO, 1997, 2.
- World Health Organization. The right to water. Geneva, Switzerland: WHO, 2003.
- Bartram HG. Domestic water quantity: Service level and health. Geneva: WHO, 2003.
Cited by 8
From OpenAlex, OpenCitations and reference lists read by Scinovex
- Water, sanitation, and hygiene implications of large-scale recycling of treated municipal wastewater in semi-arid regions ↗
Manjari Manisha, Kavita Verma, N. Ramesh, T.P. Anirudha, R.M. Santrupt, Lakshminarayana Rao · The Science of The Total Environment · 2023
❝ 16 - Public awareness and perception of gastrointestinal health: A comparative study of rural and urban areas in Khordha District, Odisha ↗
Stefan Patra, Padmalaya Jena · Journal of Current Research in Food Science · 2025
Gastrointestinal (GI) diseases are a significant public health concern in India, with varying levels of awareness and perception among different populations. These diseases affect millions of individuals, impacting their overall health, quality of life, and economic productivity. The disparities in awareness and healthcare-seeking behavior between rural and urban populations contribute to differences in disease prevalence and management.This study aims to
- A study to analyze the correlation between groundwater depletion and migration trends in Jhunjhunu district ↗
Anurag Anurag, Dheer Singh · International Journal of Advanced Academic Studies · 2025
Groundwater is one of the most crucial sources of freshwater, particularly in regions that lack access to surface water or reliable municipal water systems. This study explores the impact of groundwater depletion on rural migration in Jhunjhunu District, Rajasthan, using a descriptive and analytical research design. The research area has experienced significant groundwater depletion over the last decade, influencing socio-economic
- Transitioning to cleaner cooking fuels: Challenges faced by rural women and recommendations for sustainable adoption under Ujjwala Yojana
Rakesh Bhardwaj, Suman Singh, Hemu Rathore · International Journal of Agriculture and Food Science · 2025
Access to clean cooking energy remains a persistent challenge in rural India, with significant implications for women’s health, environmental sustainability, and social equity. The Pradhan Mantri Ujjwala Yojana (PMUY), launched in 2016, was envisioned as a transformative initiative aimed at enabling access to Liquefied Petroleum Gas (LPG) for economically disadvantaged households, particularly in rural areas. Despite the wide distribution of LPG connections under PMUY, sustained and exclusive adoption remains elusive. This study, based in Udaipur district of Rajasthan, investigates the challen
- Consumer intention towards healthy products: An empirical study of Bhiwani district of Haryana ↗
Priyanka · International Journal of Research in Marketing Management and Sales · 2025
This study examines consumer buying intention towards healthy products in Bhiwani District of Haryana, India. With rising health consciousness and lifestyle diseases, understanding consumer preferences and purchasing patterns for healthy products has become crucial. A survey of 110 consumers was conducted using structured questionnaires. The study analyzes demographic factors, awareness levels, purchasing patterns and factors influencing buying decisions. Findings reveal
- Decentralized Systems for Resource Recovery: Water Recovery Strategies from Wastewater ↗
Upexa Patel, Ambika Arkatkar, Pankaj M. Pardeshi, Alka Arvind Mungray, Arvind Kumar Mungray · 2025
The utility of water resources and generation of wastewater is an unavoidable one-way process. Researchers are continuously exploring the possibilities of reducing the generation of wastewater. Less usage of potable water is widely recommended. The next step after usage is reuse of wastewater and further recovery from wastewater. Reuse and recovery at a large scale is many times a challenging…
❝ 0 - Future of domestic water purifiers in the Indian market ↗
Indraneel Das, Sudip Kumar Ghosh, Pranabesh Ghosh · International Journal of Research in Management · 2024
Water is life for all but the global problem of water pollution requires a continuous evaluation of water resource policy. Day by day water pollution increases due to rapid industrial growth and create demand drinking water. In industrial effluent, high levels of radioactive and hazardous chemicals harm living organisms. Water supply, rivers, lakes, and oceans worldwide are affected. Water pollution
- A study on the role of gram panchayats and awareness on Jal Shakti Abhiyan in South Andaman district
Debendra Nath Dash, Kandimuthu, K Venkatesan · International Journal of Agriculture Extension and Social Development · 2024
This study investigates the water supply, treatment practices, and usage patterns in the Gram Panchayats (GPs), focusing on the role of local governance in managing water resources and the impact of national initiatives such as the Jal Shakti Abhiyan (JSA) in rural areas. The research examines the frequency, duration, and quality of water supply, the modes of payment for water services, and the methods used for water treatment before consumption. Additionally, it explores the main purposes for which water is used, including drinking, cooking, washing, and agriculture. A total of 1300 responden