
Research article · 2022 · Full text
International Journal of Statistics and Applied MathematicsUnderstanding and meeting different user needs for consumer price index in Nigeria
Volume 7(3) · Pages 54–59 · DOI: 10.22271/maths.2022.v7.i3a.825 ↗
Research areasConsumer Market Behavior and PricingOrganizational Management and Leadership
Abstract
Author-writtenPrice statistics with particular reference to Nigeria has huge data potential irrespective of the numerous challenges. When you think you have done enough to make various data sets available and a fresh/new user comes with new request, you will discover you still have a lot of work to do. Very key problems to solve as far as meeting different user needs are concerned are those of identifying and understanding the users and their needs. Apart from international organizations like IMF, World Bank and a few others, all local prices data users are haphazard users. They come for data when they are in need of it and have never taken time to compile a series for their own use. Contractors (both government and non government) are not left out. They come each time they want to revalue their contracts waiting for another phase of revaluation without making any effort to keep the series for economic study of their own system. Traders and business people both in the formal and informal sectors who should be major users of prices data ignore it leaving consumers to arbitrary increases in prices. This paper will attempt to among other things; identify prices statistics users, understand prices statistics users with a view to making provision for their needs, carry out Sensitization exercises and timely dissemination of the required data. Several data sets are lying unused in the database looking for users. In the days past, consumers are allowed to step out first with their needs before the suppliers are able to supply. Today to make our product (prices data) relevant and remain in business, we need to carry out sensitization exercises with lots of advertisement to awake user needs to our product. By so doing, we keep staying in business and make popular the use of prices statistics. Analyzed consumer prices data from the National Bureau of Statistics have been used to create user awareness, explanations made and dissemination channels made clearly available for every user.
Summary
Source-checkedPlain-language reading of the full paper, prepared with AI and checked against the text. Each point links to the authors' own words.
Why it matters
- Price statistics in Nigeria have significant potential for data use, despite facing various challenges. View evidence ↗
- Most local users of price data in Nigeria are inconsistent, unlike international organizations such as the IMF and World Bank. View evidence ↗
- The failure of formal and informal business people to use price data often results in arbitrary price increases for consumers. View evidence ↗
The question
- The study aims to identify and understand the needs of price statistics users to improve data provision, sensitization, and dissemination. View evidence ↗
What they did
- The Consumer Price Index (CPI) is designed to cover all of Nigeria using a representative sample of outlets and a comprehensive basket of items. View evidence ↗
- The CPI sampling includes 187 urban open markets, 500 urban shopping plazas/supermarkets, and 444 rural open markets. View evidence ↗
- Monthly CPI compilation relies on price data provided by 10,534 informants or respondents. View evidence ↗
- The pricing process in Nigeria covers approximately 835 product specifications. View evidence ↗
- Nigeria currently uses 'plutocratic weighting,' where weights are derived from aggregate household expenditure, giving more influence to high-spending households. View evidence ↗
What they found
- In January 2013, the 'All Items' monthly index was 141.9 with a year-on-change of 9.0%. View evidence ↗
- Analysis of the CPI data indicates that the Nigerian economy lacks a steady inflation pattern on both monthly and yearly bases. View evidence ↗
- The instability in inflation patterns is attributed to a lack of price controls, allowing market manipulators to determine prices. View evidence ↗
What it means
- The authors conclude that the CPI must be established as a 'brand' in Nigeria through increased awareness to ensure user needs are properly understood and met. View evidence ↗
- The authors suggest that future outlet selections should move away from systematic sampling toward stratified or non-probability sampling to better account for outlet size and viability. View evidence ↗
Visual summary
1 visualsIllustrations explain the paper; charts are replotted from the paper's own table values.
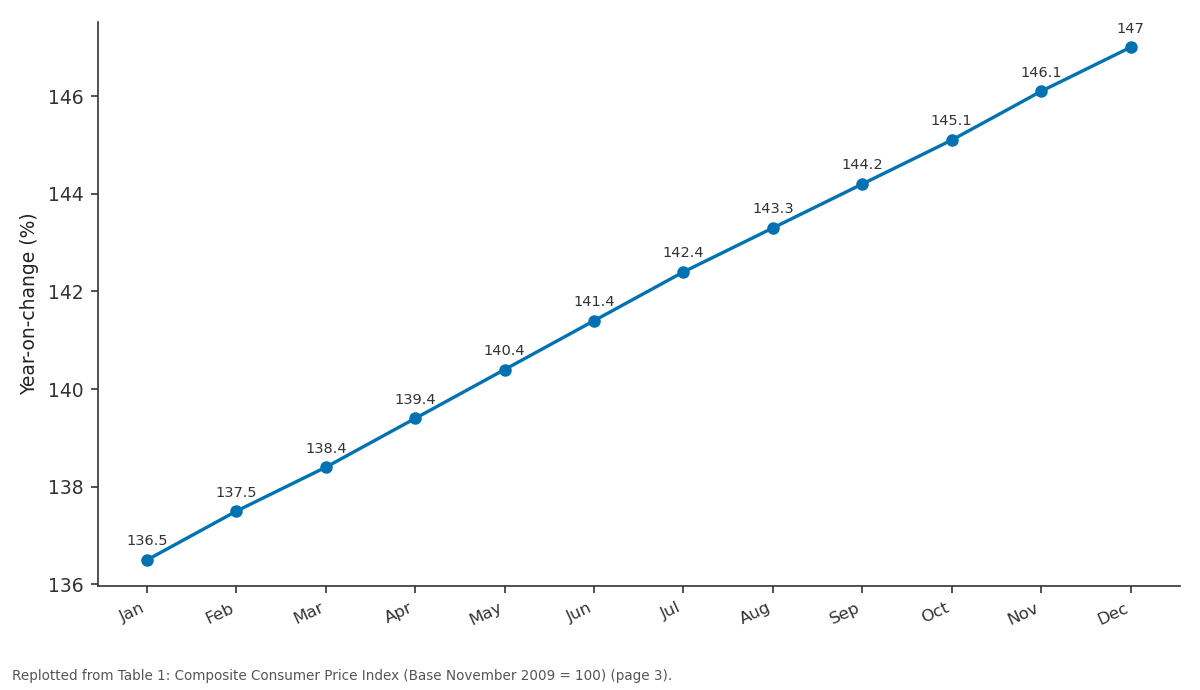
12- Month Average: Jan vs Feb vs Mar vs Apr vs May
Replotted from Table 1 (page 3) of the original paper. Every bar is the paper's own table value.
View source evidence ↗Figures & tables
From the original paper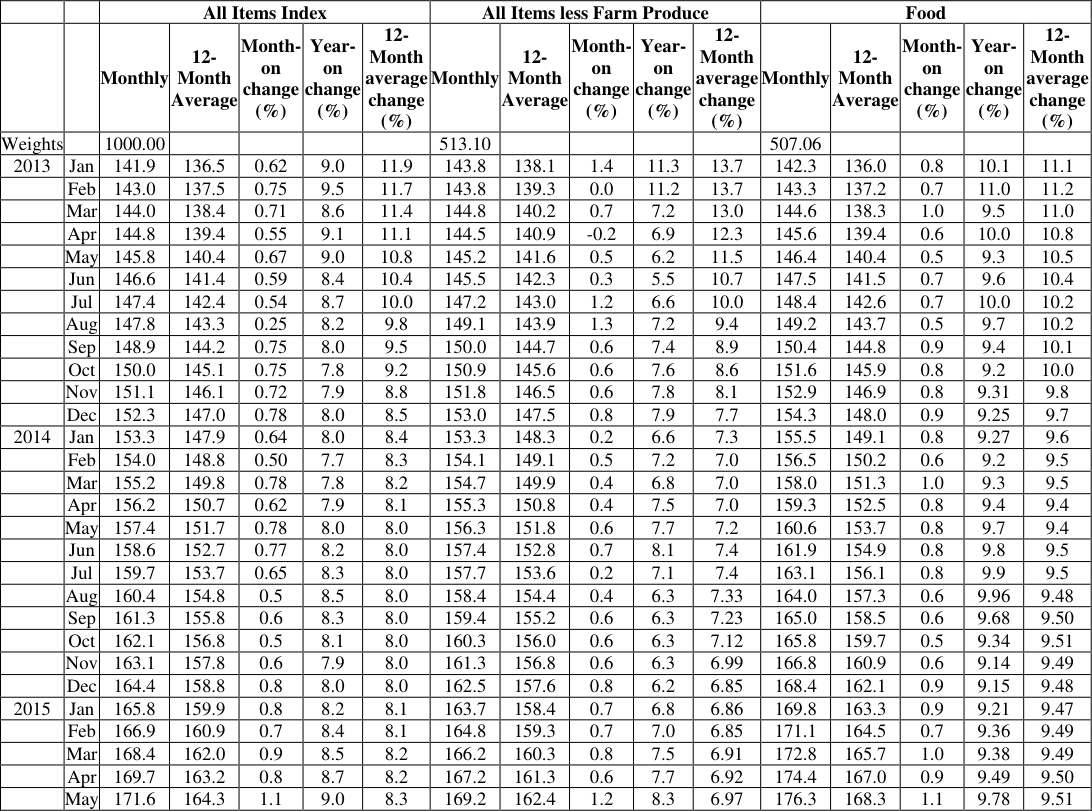 Table 1
Introduction 1.1 Defining the Scope of Index
Nigeria is a country with thirty-six (36) Federating States and the Federal Capital Territory (FCT) Abuja. The Consumer Price Index (CPI) covers every part of the country, a representative sample of outlets are taken with almost all items that can be found in the country being included in the basket Bawa S 2016 [1] .
Geographical Coverage:
Urban and rural sectors of each state of the country are covered. Prices data are collected from selected outlets in these areas Bashir 2012 [2] .
Outlet Coverage:
Sample of viable outlets is selected from urban and rural areas of each state. In the latest revised CPI, all together, 187 (5 each from 35 states and 6 each from Lagos and Kano due to their sizes) open markets and 500 shopping plazas and large supermarkets were selected in the urban centers. In the rural areas, 444 (twelve from each state including Federal Capital Territory Abuja) open markets were selected for the CPI Butt 1988 [3] . The selected outlets are kept constant as long as they remain viable to ensure that only pure item price changes are measured by the CPI Chaudhary 1996 [4] .
Altogether a total of 10,534 informants/respondents provide price data for the compilation of the CPI each month ECOWAS c2013 [5] .
Item Coverage:
Items with significant expenditure are selected from the available current household expenditure survey to form the CPI basket Fakiyesi 1996 [6] . About 835 products specifications are priced in Nigeria with each centre having as many items as can be found in it. However, it is important to note that basket of goods and services vary from state to state and a combination of the state baskets makes up the national CPI basket Friedman 1963 [7] .
Materials and Methods
Materials and Methods
Materials
The expenditure survey in Nigeria is a component of Nigerian Living Standard Survey (NLSS) conducted by the National Bureau of Statistics and the result provide item weights used in the rebasing and computation of Consumer Price Index (CPI). Weights are developed from expenditure on each item consumed by the target households over a period of one year. The weights from each item in a state (36 and the Federal Capital Territory Abuja) are computed and treated as standalone and thereafter combined to form the national weight. As Consumer Price Index (CPI) awareness grew and its demand kept rising, a comprehensive national statistical frame of market outlets was compiled and Price collection outlets were selected from the frame. This served as a guide to enumerators/interviewers for consistency in data collection. The frequency of price collection is determined by the degree of fluctuations in the prices of the items. This frequency varies from once a week for certain foodstuffs to once a month for an item with fairly stable prices such as services. Workshops, seminars and meetings are regularly held with stakeholders to create awareness on the procedure involved in producing CPI. All these are geared towards meeting the needs of users Imimole 2011 [8] .
Plutocratic versus Democratic weights
In the past, democratic weights were applied where initial computation of the consumer price index (CPI) in Nigeria was based on a few urban towns with different base periods. They include Lagos, the then Federal capital and the other regional capitals. However, there was the desire for a national index. The group indices were combined across the country with weights proportional to population. The rural indices were computed in zones and similarly aggregated across the country ILO c2004 [9] . This scenario above describes the democratic weighting structure in which weights are first calculated using each household's expenditure share on a particular class, by dividing each household's expenditure on that class by the household's total expenditure.
In the recent Nigeria CPI practice, the aggregate expenditure by index household is used to derive weights and this reflects the principle that each index household contributes to the weights, an amount proportional to its expenditure. This is referred to as plutocratic weighting and means that the expenditure patterns of high-spending households have more influence on the index Kabundi c2012 [10] .
Sampling of Outlets and items/Varieties
The probability sampling (systematic sampling) method was employed in the selection of outlets in the current CPI. The size of the country did not help the samplers then. It takes close to two days on a fast moving vehicle to move from the federal capital territory to some states in Nigeria. This made scientific method of sampling inefficient since the sizes of the outlets (especially markets) are not the same and the probability of selecting some non-viable ones may be high. This is our experience and it is quite interesting. In our next selection of outlets, it is better to recommend stratified sampling method where outlets will be stratified by size or most appropriate non probability sampling method where samplers will select by judgments according to size and viability of the outlets since most large outlets in the capital cities must not be left out. Nigeria has a large basket and the items/varieties are not selected rather they are included or excluded during expenditure survey when the basket is formed. However, the CPI basket is formed from items with significant expenditure weights to avoid unnecessarily overloading the basket. All these exercises are properly explained in meetings, seminars and workshops where stakeholders are present. An interesting thing to note is that most of these exercises are funded in collaboration with the World Bank Kuijs c1998 [11] .
Price Collection
The CPI in Nigeria as at today still makes use of paper questionnaire for its data collection. The National Statistics office (NBS) has offices in the 36 federating states including Abuja (Federal Capital Territory). Well trained staff of the office collects prices data using well-structured twelve module paper questionnaire on monthly basis from each state from selected outlets. Since the country is partitioned along regional lines, six regions exist with average of six states per region. One central state in each region is made the headquarter of the region for ease of data gathering. These headquarters are equipped with computer networks. Upon transmission of data from the states to their respective headquarters, data entry is carried out and the data transmitted online to the Federal capital (National headquarters) where analysis and publications are done. Most times, publications start with press briefing where dozens of press men converge for the purpose giving the products wider coverage Michael c1997 [12] .
Methods
Methods
CPI Compilation
The CPI in Nigeria targets mainly the compilation of national indices which leads to the computation of inflation rates, even though states or regional indices are used to compile the national indices; the interest of the country due to its level of expose and use of CPI include the short term outlook of the country's economic performance through the inflation rate and deflation of national account series for the production of gross domestic product (GDP). The weights of all items covered during the expenditure survey are calculated by experts and aggregated at lower level with the aim of arriving at the individual class levels of the items. The class indices are obtained, thereafter all items, core and food indices are computed which are used to calculate the respective inflation rates Qayyum c2006 [17] . Most countries including Nigeria make use of the Laspeyres index formula in the computation of Consumer Price Index. It makes use of base-year quantities, while base period expenditures are used to derive item weights. By so doing, it assesses changes in the cost of base-year quantities. It tries to find out what it would have cost if base-year quantities are purchased in the current year. Therefore, Laspeyres price index relates the cost of purchasing base-year quantities at current year prices to base-year quantities at base-year prices. Since the base-year weights are kept constant, it is expected that if prices in the base-year is the same as prices in the current year, then the index for the two periods will be the same because there is no price change. If the price of the item changes during the current year, then the index will change. The laspeyres price index formula is denoted by Mordi 2007 [13] 𝐿𝑃𝐼 = ∑ 𝑝 𝑛 𝑞 𝑜 ∑ 𝑝 0 𝑞 0 𝑥 100
If we recall that the value of a commodity is given as the product of the quantity purchased (q) and its price (p), that is value of item = price x quantity purchased (pxq). Therefore 𝑝 𝑛 𝑞 0 = the product of price of current year (𝑝 𝑛 ) and the quantity of the base year (𝑞 0 ) 𝑝 0 𝑞 0 = the product of the base-year price (𝑝 0 ) and base-year quantity (𝑞 0 ). That is value of the product in the base-year Masha 2007 [14] . The derived laspeyres index number therefore becomes: 1 above shows the Nigerian CPI and how the resultant indices and inflation rates from 2009 -2021 have been structured. The results are not limited to all items Index, all items less farm produce and food. It also covers other sub-indices not regularly reported. In each of the sub index, the following are derived: monthly index, month-on change %, year-on-change %, and 12-month average change % Moser 1995 [15] . The monthly index in each of the sub index records the calculated monthly price index, month-on change % (which is the monthly inflation rates), year-on change % (which is the yearly inflation rates) and 12-month average change %. From the table above, it can be seen that Nigeria economy does not sustain a steady inflation pattern for a long time both on monthly and yearly basis. The reason may obviously be due to absence of price control giving room to price determination by the market manipulators. The character and market behavior in this country is that simple traffic can cause price increase not to talk of increases in prices of fuel and diesel putting consumers at the mercy of market men and women. Users of this statistics should be made to be aware of what to expect as the purpose of these figures are for them to be used for making informed decisions Nwaboku 2014 [16] .
Discussion
It is a routine in the National Bureau of Statistics to disseminate on time online price statistics since it has a wider coverage. Prices statistics is released between 15 th and 17 th of every month under normal condition. There is no restriction to manual dissemination methods as some local users still insist on manual or hard copy collection. Publications containing price statistics data are available in the information services unit of the National Bureau of Statistics for local researchers and business sector, government and non-government organizations. A very important point to note is that users would not bother about your product unless it can benefit them in solving problem, address a need and do something to make them feel better. This is better achieved if you are able to identify and meet their needs. Regular users of price statistics in Nigeria are National account departments including that of NBS, Central bank of Nigeria (CBN), International Monitoring Fund (IMF) and World Bank. Non regular users are Research institutions, Individual or private researchers such as students, Contractors, business people both in the formal and informal sectors. Dealing with reactions from users cannot be over looked. There is a popular saying that "a customer is always right", this leaves a huge burden on the price statistician whose duty it is to manage the excesses of majority of the users. When users come and complain, it is the duty of a price statistician to pay attention to their complaints and avoid engaging them in unnecessary arguments even when it is obvious that they are wrong. Try convincing them giving examples of what happens in other countries. It is a fact that some users cannot be easily satisfied, avoid quarrelling with them rather make a promise that when next they come, the service will be better. All these efforts help to draw attention of many users to your products and keep you very relevant in price statistics business. It is important also to note that this paper is not purely coming from academic point of view rather a lot of experiences gathered from day to day price statistics compilation and dissemination. According to Adam Fard (co-founder and lead UX designers), understanding user behavior is key to finding out how users interact with the product. Specifically how much do they spend using it? What point in the user journey do they decide to bounce? Analyzing your user behavior will answer such questions and help you continuously refine your product. Also, understanding user behavior is the foundation of building a great product and an indicator of good organization. A good way to start is to insure that the producer has proper knowledge of its products. The producer has to keep a list of its customers and ensure that they are all in its mailing list. Provision should be made online for customers to report back to the organization areas where improvements are needed and commendations may also be necessary to help them know what they are doing well. All the feedbacks are regularly analyzed and reviewed over and over to serve as working instrument for improvement. Once a while, press reports, conferences and stakeholders meetings are necessary where users will be educated on the existing products, improvements made on them and new products may also be introduced in these meetings. Frequently requested data sets are properly identified and the series compiled and kept for historical purposes. Price statisticians must be ready to explain in detail the data they produce, its importance and uses. If a prices statistician is seen as good in his field and always ready and patient to educate users on its products, he/she not only builds good relationship with customers but also creates the desire and interest on the product.
Conclusion
The consumer price index which is used to compute inflation rates have been around for quite some decades in Nigeria but quite new in awareness. This has created a huge burden on the producers in trying to meet users' needs. Thanks to international organizations like International Monetary Fund (IMF), World Bank as well as Central bank of Nigeria that have always amplified the use of Inflation rates and also assisted the National Statistical office in Nigeria in series of trainings, workshops and meetings. Secondly, Nigeria and academic institutions have not as a matter of policy made concerted effort to educate citizens on the usefulness of Statistics rather see other courses like Medicine, Law, Economics, Accountancy, etc as prestigious courses making children and parents focus more attention on those courses. Understanding comes from awareness and meeting user needs come from proper understanding of Statistics. The consumer price index has to be a brand in Nigeria with proper awareness to both producers and users before users' needs can be understood and properly met.
Figures and tables from the paper
| — | — | All Items Index | — | — | — | — | All Items less Farm Produce | — | — | — | — | Food | — | — | — | — |
|---|---|---|---|---|---|---|---|---|---|---|---|---|---|---|---|---|
| Monthly | 12- Month Average | Month- on change (%) | Year- on change (%) | 12- Month average change (%) | Monthly | 12- Month Average | Month- on change (%) | Year- on change (%) | 12- Month average change (%) | Monthly | 12- Month Average | Month- on change (%) | Year- on change (%) | 12- Month average change (%) | ||
| Weights | 1000.00 | 513.10 | 507.06 | |||||||||||||
| 2013 | Jan | 141.9 | 136.5 | 0.62 | 9.0 | 11.9 | 143.8 | 138.1 | 1.4 | 11.3 | 13.7 | 142.3 | 136.0 | 0.8 | 10.1 | 11.1 |
| Feb | 143.0 | 137.5 | 0.75 | 9.5 | 11.7 | 143.8 | 139.3 | 0.0 | 11.2 | 13.7 | 143.3 | 137.2 | 0.7 | 11.0 | 11.2 | |
| Mar | 144.0 | 138.4 | 0.71 | 8.6 | 11.4 | 144.8 | 140.2 | 0.7 | 7.2 | 13.0 | 144.6 | 138.3 | 1.0 | 9.5 | 11.0 | |
| Apr | 144.8 | 139.4 | 0.55 | 9.1 | 11.1 | 144.5 | 140.9 | -0.2 | 6.9 | 12.3 | 145.6 | 139.4 | 0.6 | 10.0 | 10.8 | |
| May | 145.8 | 140.4 | 0.67 | 9.0 | 10.8 | 145.2 | 141.6 | 0.5 | 6.2 | 11.5 | 146.4 | 140.4 | 0.5 | 9.3 | 10.5 | |
| Jun | 146.6 | 141.4 | 0.59 | 8.4 | 10.4 | 145.5 | 142.3 | 0.3 | 5.5 | 10.7 | 147.5 | 141.5 | 0.7 | 9.6 | 10.4 | |
| Jul | 147.4 | 142.4 | 0.54 | 8.7 | 10.0 | 147.2 | 143.0 | 1.2 | 6.6 | 10.0 | 148.4 | 142.6 | 0.7 | 10.0 | 10.2 | |
| Aug | 147.8 | 143.3 | 0.25 | 8.2 | 9.8 | 149.1 | 143.9 | 1.3 | 7.2 | 9.4 | 149.2 | 143.7 | 0.5 | 9.7 | 10.2 | |
| Sep | 148.9 | 144.2 | 0.75 | 8.0 | 9.5 | 150.0 | 144.7 | 0.6 | 7.4 | 8.9 | 150.4 | 144.8 | 0.9 | 9.4 | 10.1 | |
| Oct | 150.0 | 145.1 | 0.75 | 7.8 | 9.2 | 150.9 | 145.6 | 0.6 | 7.6 | 8.6 | 151.6 | 145.9 | 0.8 | 9.2 | 10.0 | |
| Nov | 151.1 | 146.1 | 0.72 | 7.9 | 8.8 | 151.8 | 146.5 | 0.6 | 7.8 | 8.1 | 152.9 | 146.9 | 0.8 | 9.31 | 9.8 | |
| Dec | 152.3 | 147.0 | 0.78 | 8.0 | 8.5 | 153.0 | 147.5 | 0.8 | 7.9 | 7.7 | 154.3 | 148.0 | 0.9 | 9.25 | 9.7 | |
| 2014 | Jan | 153.3 | 147.9 | 0.64 | 8.0 | 8.4 | 153.3 | 148.3 | 0.2 | 6.6 | 7.3 | 155.5 | 149.1 | 0.8 | 9.27 | 9.6 |
| Feb | 154.0 | 148.8 | 0.50 | 7.7 | 8.3 | 154.1 | 149.1 | 0.5 | 7.2 | 7.0 | 156.5 | 150.2 | 0.6 | 9.2 | 9.5 | |
| Mar | 155.2 | 149.8 | 0.78 | 7.8 | 8.2 | 154.7 | 149.9 | 0.4 | 6.8 | 7.0 | 158.0 | 151.3 | 1.0 | 9.3 | 9.5 | |
| Apr | 156.2 | 150.7 | 0.62 | 7.9 | 8.1 | 155.3 | 150.8 | 0.4 | 7.5 | 7.0 | 159.3 | 152.5 | 0.8 | 9.4 | 9.4 | |
| May | 157.4 | 151.7 | 0.78 | 8.0 | 8.0 | 156.3 | 151.8 | 0.6 | 7.7 | 7.2 | 160.6 | 153.7 | 0.8 | 9.7 | 9.4 | |
| Jun | 158.6 | 152.7 | 0.77 | 8.2 | 8.0 | 157.4 | 152.8 | 0.7 | 8.1 | 7.4 | 161.9 | 154.9 | 0.8 | 9.8 | 9.5 | |
| Jul | 159.7 | 153.7 | 0.65 | 8.3 | 8.0 | 157.7 | 153.6 | 0.2 | 7.1 | 7.4 | 163.1 | 156.1 | 0.8 | 9.9 | 9.5 | |
| Aug | 160.4 | 154.8 | 0.5 | 8.5 | 8.0 | 158.4 | 154.4 | 0.4 | 6.3 | 7.33 | 164.0 | 157.3 | 0.6 | 9.96 | 9.48 | |
| Sep | 161.3 | 155.8 | 0.6 | 8.3 | 8.0 | 159.4 | 155.2 | 0.6 | 6.3 | 7.23 | 165.0 | 158.5 | 0.6 | 9.68 | 9.50 | |
| Oct | 162.1 | 156.8 | 0.5 | 8.1 | 8.0 | 160.3 | 156.0 | 0.6 | 6.3 | 7.12 | 165.8 | 159.7 | 0.5 | 9.34 | 9.51 | |
| Nov | 163.1 | 157.8 | 0.6 | 7.9 | 8.0 | 161.3 | 156.8 | 0.6 | 6.3 | 6.99 | 166.8 | 160.9 | 0.6 | 9.14 | 9.49 | |
| Dec | 164.4 | 158.8 | 0.8 | 8.0 | 8.0 | 162.5 | 157.6 | 0.8 | 6.2 | 6.85 | 168.4 | 162.1 | 0.9 | 9.15 | 9.48 | |
| 2015 | Jan | 165.8 | 159.9 | 0.8 | 8.2 | 8.1 | 163.7 | 158.4 | 0.7 | 6.8 | 6.86 | 169.8 | 163.3 | 0.9 | 9.21 | 9.47 |
| Feb | 166.9 | 160.9 | 0.7 | 8.4 | 8.1 | 164.8 | 159.3 | 0.7 | 7.0 | 6.85 | 171.1 | 164.5 | 0.7 | 9.36 | 9.49 | |
| Mar | 168.4 | 162.0 | 0.9 | 8.5 | 8.2 | 166.2 | 160.3 | 0.8 | 7.5 | 6.91 | 172.8 | 165.7 | 1.0 | 9.38 | 9.49 | |
| Apr | 169.7 | 163.2 | 0.8 | 8.7 | 8.2 | 167.2 | 161.3 | 0.6 | 7.7 | 6.92 | 174.4 | 167.0 | 0.9 | 9.49 | 9.50 | |
| May | 171.6 | 164.3 | 1.1 | 9.0 | 8.3 | 169.2 | 162.4 | 1.2 | 8.3 | 6.97 | 176.3 | 168.3 | 1.1 | 9.78 | 9.51 |
Table text extracted from the original PDF; superscript letters are shown inline. The original table image is below.
View original table image
References
8 in the original paper- Bawa S, Abdullahi IS, Ibrahim A. Analysis of inflation dynamics in Nigeria (1981-2015). CBN Journal of Applied Statistics. 2016;7(1):255-276.
- Bashir et al. Determinants of Inflation in Pakistan: An Econometric Analysis Using Johansen Co-integration Approach. Australian Journal of Business and Management Research. 2011 August;1(5):71-82.
- Butt MS. A Monetarist Approach to Inflation for Pakistan. Pakistan Economic and Social Review. 1988;XXVI(2):69-87.
- Chaudhary MA. Sources and Impact of Inflation in Pakistan. Pakistan Economic and Social Review. 1996;XXXIV(1):21-39.
- Fakiyesi OM. Further Empirical Analysis of Inflation in Nigeria. Central Bank of Nigeria (CBN) Economic and Financial Review, 1996;34(1):2.
- Imimole B, Enoma A. Exchange Rate Depreciation and Inflation in Nigeria (1986-2008). Business and Economics Journal. 2011 Jan 1;28(1):1-1.
- Masha I. New Perspectives on Inflation in Nigeria. CBN Economic and Financial Review. 2007;38(2):3.
- Moser GG. The Main Determinants of Inflation in Nigeria. Staff Papers. 1995 Jun;42(2):270-89.