
Research article · 2022 · Full text
International Journal of Statistics and Applied MathematicsOn record based transmuted inverse exponential distribution
Volume 7(1) · Pages 25–30 · DOI: 10.22271/maths.2022.v7.i1a.771 ↗
Research areasStatistical Distribution Estimation and Applications
Abstract
Author-writtenInverse Exponential distribution has been used to analyze lifetime datasets which has non monotone hazard function and has applications in reliability and biological study areas. The present study introduces new generalization of inverse exponential distribution using Record-Based transmutation. Record-Based transmuted inverse Exponential distribution is derived and its properties studied. The maximum likelihood estimation procedure is employed to estimate the parameters of the proposed distribution. Finally, an algorithm in R package is developed to carry out the simulation studies.
Summary
Source-checkedPlain-language reading of the full paper, prepared with AI and checked against the text. Each point links to the authors' own words.
Why it matters
- The Inverse Exponential distribution is useful for analyzing lifetime datasets with non-monotone hazard functions, particularly in biological studies and reliability analysis. View evidence ↗
- The standard Exponential distribution is widely used for lifetime data because of its simple structure and constant hazard rate. View evidence ↗
- There is significant current interest in developing new families of probability distributions to better describe real-life phenomena. View evidence ↗
The question
- The study aims to introduce and analyze a new generalization of the inverse exponential distribution called the record based transmuted inverse exponential (RTIE) distribution. View evidence ↗
What they did
- The RTIE distribution is defined using two parameters: theta (𝜃) and p. View evidence ↗
- The authors used the BFGS algorithm via the 'optima' function in R software to perform maximum likelihood estimation (MLE) for the distribution parameters. View evidence ↗
- Simulation studies were conducted by generating 1,000 sets of samples with sizes of 50, 100, and 250. View evidence ↗
What they found
- The RTIE distribution offers greater flexibility than the baseline distribution because of its additional parameter. View evidence ↗
- The hazard function of the RTIE distribution is capable of modeling datasets with both increasing (IFR) and decreasing (DFR) failure rates. View evidence ↗
- For parameters theta=0.5 and p=0.5, the MLE estimates for theta improved from 0.342 (SE 0.054) at n=50 to 0.493 (SE 0.009) at n=250. View evidence ↗
- For parameters theta=1.5 and p=0.8, the MLE estimates for p shifted from 0.761 (SE 0.054) at n=50 to 0.808 (SE 0.021) at n=250. View evidence ↗
- The simulation results indicate that the estimation algorithm is effective across different parameters, and standard errors decrease as the sample size increases. View evidence ↗
What it means
- The authors conclude that the RTIE distribution is a suitable model for datasets exhibiting either decreasing or increasing failure rates. View evidence ↗
Visual summary
1 visualsIllustrations explain the paper; they do not show study data.
RTIE Distribution Concept
AI-generated conceptual illustration (Mathematical probability density functions represented as geometric curves on a coordinate plane). It explains the idea and does not show study data.
View source evidence ↗Figures & tables
From the original paper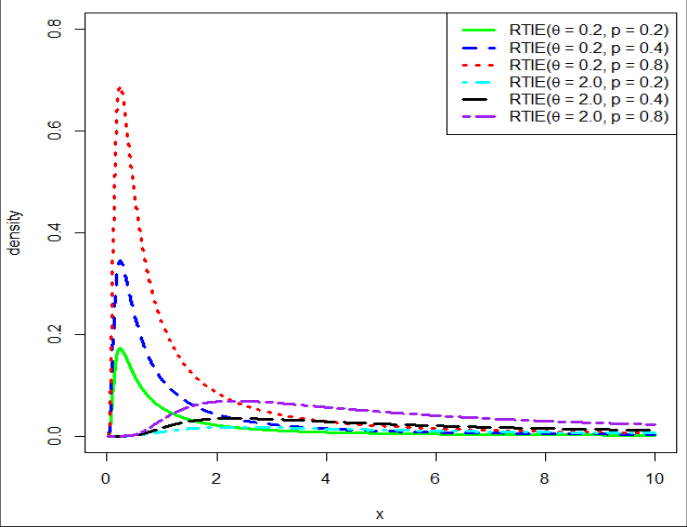 Figure 1
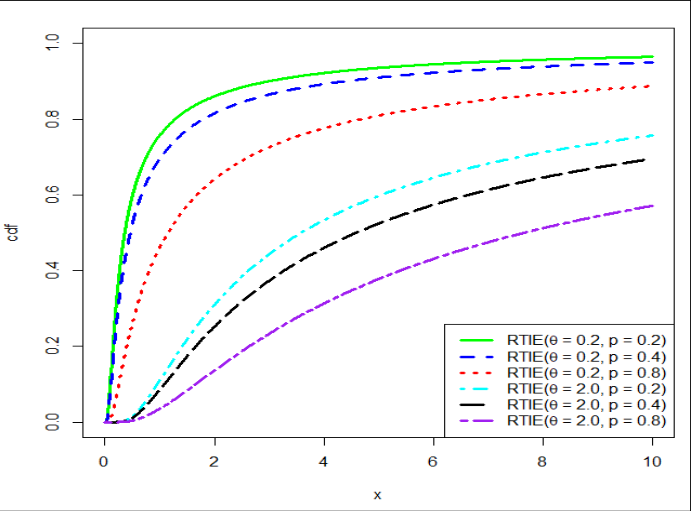 Figure 2
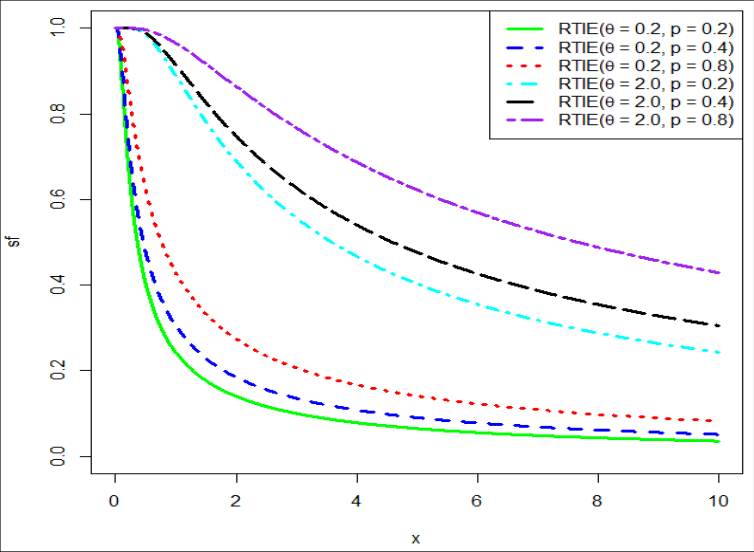 Figure 3
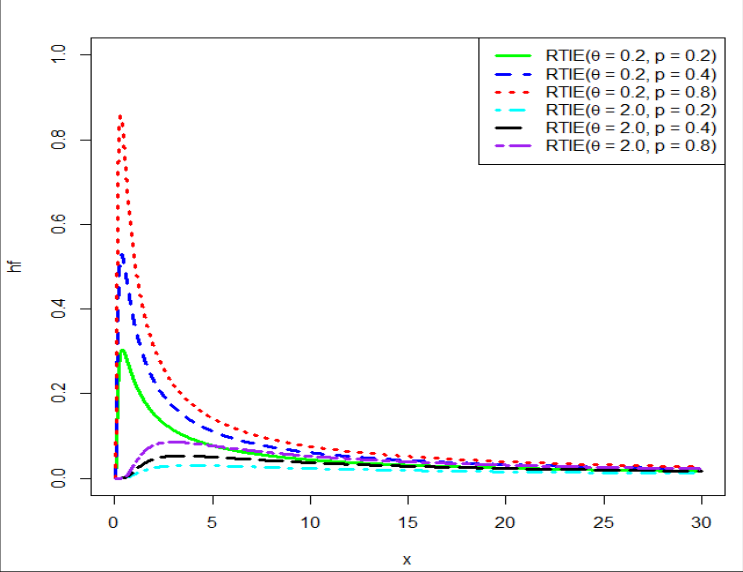 Figure 4
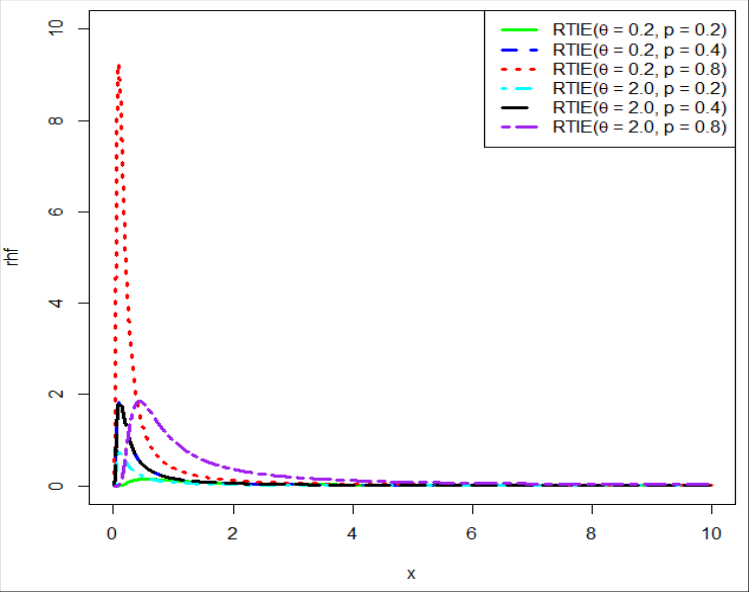 Figure 5
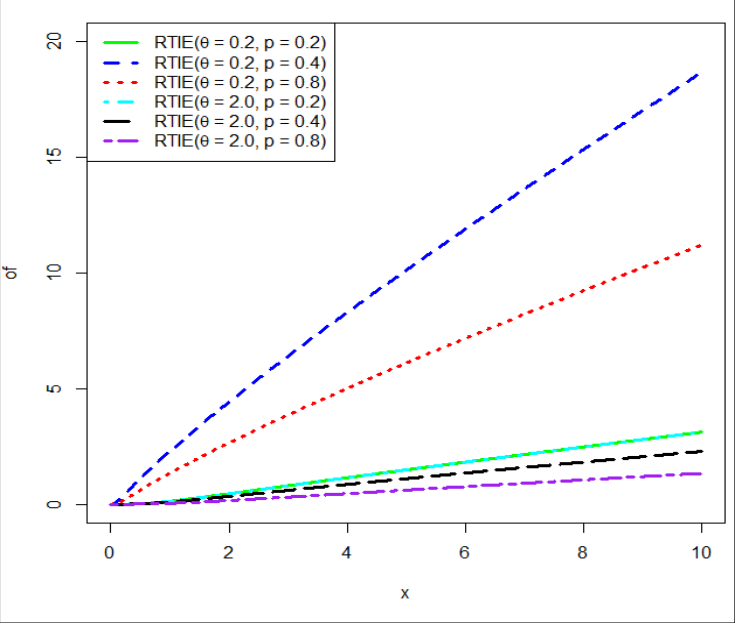 Figure 6
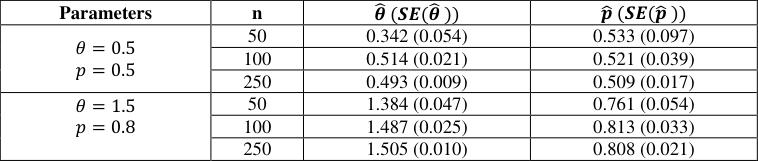 Table 1
Introduction
Exponential distribution is a popular lifetime distribution due to its simple structure and has constant hazard rate. Several generalizations of exponential distributions were introduced so far. For example new extended generalized exponential distribution (Dey et al. (2017) [7] , slash exponential (Punathumparambath (2020) [12] ), Inverse exponential distribution (Keller et al. 1982; Dey, 2007) [10,8] , exponentiated inverted exponential (Fatima and Ahamad, 2017) [9] , generalized inverted exponential (Abouammoh and Alshingiti (2009) [1] and exponentiated generalized inverted exponential (Oguntunde, Adejumo and Balogun, 2014) [11] . The cumulative distribution function (cdf) and probability density function (pdf) of inverse exponential (IE) distribution were respectively given by, 𝐺(𝑥) = 𝑒 -𝜃 𝑥 , 𝑥 ≥ 0, 𝜃 > 0.
Recently there is lot of interest in constructing new family of distributions which describes many real life phenomena. Shaw and Buckley (2007) proposed the transmuted-G (T-G) family of distributions. N. Balakrishnan and M. He (2021) [4] , proposed a family of transmuted distributions based on the theory of records. The Cumulative distribution function (cdf) and probability density function (pdf) of record based transmuted distribution can be respectively given as follows.
Where, 0<p<1, G(x) and g(x) respectively denote the cdf and pdf of the baseline distribution.
Caner Tanış and Buğra Saraçoğlu (2020) [6] studied various properties and applications of the Record based transmuted Weibull (RTW) distribution.
Arshad et al. (2021) [3] introduced Record-Based Transmuted Generalized Linear Exponential Distribution. In this paper we study new generalization of inverse exponential distribution using record based transmutation, referred as record based transmuted inverse exponential distribution.
Record based transmuted Inverse Exponential Distribution
In this section, we introduce the Record based transmuted Inverse exponential distribution (RTIE). The pdf and cdf of record based transmuted inverse Exponential distribution with parameters 𝜃, 𝑝 denoted by RTIE (𝜃, 𝑝 ) are respectively given by 𝑓(x) = ϴx -2 e -θx -1 [1 -p -p log(1 -e -θx -1 )], 𝜃 > 0, 0<p<1, (2.1)
The plot of pdf and cdf of RTIE distribution for various values of the parameters are given below in figure1. As evident from the density function, our method, RTIE, has more flexibility due to its additional parameter and hence the study of statistical properties associated with it are of non-negligible significance.
Reliability measures of Record based Inverse Exponential distribution
In this section we discuss the various reliability measures of RTIE (𝜃, 𝘱). The survival (reliability) function (sf) of RTIE is defined as, S(x) = 1-e -θx -1 -p(1 -e -θx -1 ) log(1 -e -θx -1 ), 𝜃 > 0, 0<p<1, (
The corresponding hazard function (hf) is as follows
1-e -θx -1 -p(1-e -θx -1 ) log(1-e -θx -1 )
, 𝜃 > 0, 0<p<1. From figure 4 we can see that the hazard function of RTIE can be used to model datasets which has decreasing and increasing failure rates, that is DFR and IFR.
The reverse hazard function (rhf) is given as follows, r(x) =
ϴx -2 e -θx -1 [1-p-p-log(1-e -θx -1 )] e -θx -1 + p(1-e -θx -1 ) log(1-e -θx -1 )
, 𝜃 > 0, 0<p<1 (3.3) 1-e -θx -1 -p(1-e -θx -1 ) log(1-e -θx -1 )
Where, W(x) is the Lambert W function which for real number takes the form, 𝑊(𝑥)𝑒 𝑊(𝑥) = 𝑥. Lambert W function is available in statistical softwares, such as R, Matlab, etc. Random sample generation from the RTIE distribution can obtained using the quantile function (qf). The qf can be useful for goodness-of-fit, simulation purposes and computing measures of skewness and kurtosis.
Order Statistics
In this section, we derive the pdf and cdf of r th order statistics from RTIE. Let X 1 , • • •, X n is a random sample from RTIE distribution and X 1:n , • • • , X n:n , denote the corresponding order statistics. Then the probability density function of the r th order statistics is given by,
Then the probability density function of the r th order statistic of RTIE is given by,
ϴx -2 e -θx -1 [1 -p -p log(1 -e -θx -1 )] ∑ (-1) 𝑖 ( 𝑛-𝑟 𝑖 )[ e -θx -1 + p(1 -e -θx -1 ) log(1 -e -θx -1 )]
𝑟+𝑖-1 𝑛-𝑟 𝑖=0 (3.3) Then the cumulative distribution function (cdf) of the r th order statistic is given by
Then the cdf of the r th order statistic of RTIE is given by
We can derive the pdf's and cdf's of first and largest order statistics by substituting r=1 and r=n respectively in equations (3.3) and (3.5).
Maximum Likelihood Estimation
In this section, we discuss the estimation of two unknown parameters Θ = (𝜃, 𝑝) using the maximum likelihood estimation. Let 𝑋 = (𝑋 1 , … , 𝑋 𝑛 ) be independent and identically distributed samples from an RTIE distribution. The log-likelihood function takes the form,
The maximum likelihood estimation can be done using the optima function of the R statistical software, applying the BFGS algorithm in R (R core team 2020) [13] . Estimates of the standard errors were obtained by inverting the numerically differentiated information matrix at the maximum likelihood point.
Simulation
In this section, we illustrate the simulation studies. Now we generate N = 1000 sets of n = 50, 100, 250 samples from the RTIE distribution using algorithm developed in R package. Table 1 gives the estimated value of the parameters using MLE, and standard error (SE) of the estimates. It is clear from Table 1 that the estimation algorithm works satisfactorily for various choices of parameters and the asymptotic standard errors of the maximum likelihood estimators decreases as sample size increases.
| Parameters | n | 𝜽̂ (𝑺𝑬(𝜽̂ )) | 𝒑̂ (𝑺𝑬(𝒑̂ )) |
|---|---|---|---|
| 𝜃= 0.5 𝑝= 0.5 | 50 | 0.342 (0.054) | 0.533 (0.097) |
| 100 | 0.514 (0.021) | 0.521 (0.039) | |
| 250 | 0.493 (0.009) | 0.509 (0.017) | |
| 𝜃= 1.5 𝑝= 0.8 | 50 | 1.384 (0.047) | 0.761 (0.054) |
| 100 | 1.487 (0.025) | 0.813 (0.033) | |
| 250 | 1.505 (0.010) | 0.808 (0.021) |
Table text extracted from the original PDF; superscript letters are shown inline. The original table image is below.
View original table image
Conclusion
In this paper, we introduced a generalization of inverse exponential (IE) based on the record based transmutation introduced by Balakrishnan and He (2021) [4] . We studied various properties of the proposed distributions including reliability measures and order statistics. We discussed the estimation of parameters using maximum likelihood estimation and finally, we illustrated simulation studies using an algorithm developed in R package. Hazard function of RTIE has increasing and decreasing structure and hence can be used to model datasets which have to decrease and increasing failure rates that is DFR and IFR.
Acknowledgement
AcknowledgementsThe author is grateful to the Department of Science and Technology, Science and Engineering Research Board (SERB), Government of India, New Delhi, for financial assistance under Core Research Grand, Project No. CRG/2018/004468.
Figures and tables from the paper
References
13 in the original paper- Abouammoh AM, Alshingiti AM. Reliability estimation of generalized inverted exponential distribution, Journal of Statistical Computation and Simulation. 2009;79(11):1301-1315.
- Akaike H. Information theory and an extension of the maximum likelihood principle, In Breakthroughs in Statistics, eds. Kotz and Johnson, New York: Springer Verlag. 1973;I:610-624.
- Arshad M, Khetan M, Kumar V, Pathak AK. Record-Based Transmuted Generalized Linear Exponential Distribution with Increasing, Decreasing and Bathtub Shaped Failure Rates, ar Xiv. 2107.09316v1. 2022 Jul 26:1-25.
- Burnham K, Anderson D. Model selection and Inference. Springer, New York. 2011 Jan;65(1):23-35.
- Caner Tanış, Buğra Saraçoğlu. On the record-based transmuted model of Balakrishnan and He based on Weibull distribution, Communications in Statistics -Simulation and Computation; c2020. DOI: 10.1080/03610918.2020.1740261.
- Dey S. Inverted exponential distribution as a life distribution model from a Bayesian view point, Data Science Journal. 2017;6:107-113.
- Dey S, Alzaatreh A, Zhang C, Kumar D. A new extension of generalized exponential distribution with application to ozone data. Ozone: Science & Engineering. 2017;39(4):273-285.
- Kawsar Fatima, Ahmad SP. The Exponentiated Inverted Exponential Distribution. Journal of Applied Information Science. 2017;5(1):36-41.
- Keller AZ, Kamath ARR, Perera UD. Reliability analysis of CNC machine tools. Reliability Engineering. 1982;3(6):449-473.
- Oguntunde PE, Adejumo A, Balogun OS. Statistical properties of the exponentiated generalized inverted exponential distribution. Applied Mathematics. 2014;4(2):47-55.
- Punathumparambath B. Slash Exponential distribution: Theory and Applications. Bulletin of Mathematics and Statistics Research. 2020;8(4):38-49.
- Core Team RR. A language and environment for statistical computing. R Foundation for Statistical Computing, Vienna, Austria, 2020. URL https://www.R-project.org.
- Schwarz G. Estimating the dimension of a model, Annals of Statistics. 1978;6(2):461-464.
Cited by 1
From OpenAlex, OpenCitations and reference lists read by Scinovex
- On record-based transmuted X-lindley distribution: Properties and applications ↗
M. Saileshwari, Rajesh Moharana, Kousik Maiti · Journal of Dynamics and Games · 2026
In this paper, a novel record-based transmuted version of the X-Lindley distribution is introduced, and dubbed as the record-based transmuted X-Lindley (RTXL) distribution. The analysis describes several statistical features of the proposed distribution such as moments, stochastic ordering, quantiles and order statistics. Additionally, the reliability features such as the reliability function, hazard rate function, reverse hazard rate function and mean…
❝ 1PDF