
Research article · 2020 · Full text
International Journal of Agriculture Extension and Social DevelopmentInitiatives in surplus F & V Management: Inclusive and entrepreneurial pathways
Volume 3(1) · Pages 30–39
Research areasAgricultural Economics and Practices
Abstract
Author-writtenRational farmers increase production expecting higher profits, but when production exceeds demand, distress sale often results. The abundance of fruit and vegetable production in India gives it the title ‘fruit basket of the world’. This paper focuses on the challenge of perishability of surplus F & V that is multiplied due to suboptimal post-harvest management, inadequate storage and transportation facilities. The goal of the paper is to identify the measures (rather, the lack of them) that can address the aforementioned problem, highlighting the regional variations in good practices of surplus management. The authors focus on the all India data to indicate that states with high production is high but low storage capacity throws open opportunities for specialized intervention in the form of processing businesses. Innovation of new processing technology especially at the farm-level may efficiently utilize a large proportion of underutilized agro-surplus.
Summary
Source-checkedPlain-language reading of the full paper, prepared with AI and checked against the text. Each point links to the authors' own words.
Why it matters
- Fruits and vegetables (F&V) are particularly susceptible to distress sales and waste because of their high perishability. View evidence ↗
- The F&V sector in India faces significant challenges including a lack of skilled labor, insufficient technology, and poor post-harvest management and storage. View evidence ↗
- Food waste contributes to a 'double burden' of malnutrition in society, manifesting as both obesity and death from malnourishment. View evidence ↗
The question
- The study aims to analyze F&V surplus management across Indian states, identify good practices and gaps, and suggest pathways to address these issues. View evidence ↗
What they did
- The research utilized secondary quantitative data from various national and international sources, including the UN, FAO, and several Indian ministries and financial institutions. View evidence ↗
- A quartile distribution analysis was used to identify mismatches between F&V production levels and storage capacities across states. View evidence ↗
- The authors performed a cluster analysis to group states with similar production, storage, and processing burdens, visualizing the results with a dendrogram. View evidence ↗
What they found
- While cold storage has a relatively small supply gap of 9.34%, other critical cold chain infrastructures face shortages of nearly 90%. View evidence ↗
- Despite the potential for temperature-controlled rail transport, 97% of F&V volume is moved by road, with only 3% moved by rail. View evidence ↗
- F&V wastage ranges from 5% to 16%, resulting in a monetary loss of INR 40,811 Crores in 2013, the highest among all agricultural produce in the sector. View evidence ↗
- A major driver of waste is the extremely low level of F&V processing, which accounts for only about 2% of total produce. View evidence ↗
- Storage capacity relative to production varies widely by state, ranging from a high of 55.09% in Uttar Pradesh to a low of 0.25% in Puducherry. View evidence ↗
- Several high-production states (over 100 lakh MT), including West Bengal and Andhra Pradesh, have poor storage capacities of less than 10% of their production. View evidence ↗
- The Indian food processing industry is primarily small-scale, with 90% of enterprises categorized as MSMEs, which limits economies of scale. View evidence ↗
What it means
- The authors recommend implementing primary, first-generation processing at the farm level to reduce the pressure on transportation and storage. View evidence ↗
- The authors suggest creating a cold-chain connected Public Distribution System (PDS) to deliver surplus F&V to undernourished and remote populations. View evidence ↗
Visual summary
3 visualsIllustrations explain the paper; charts are replotted from the paper's own table values.
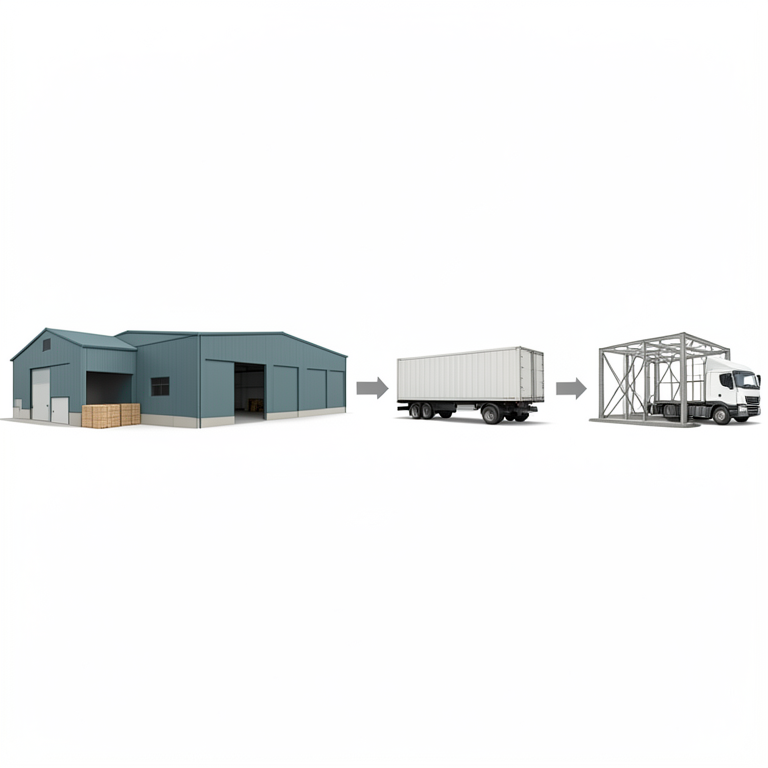
Cold Chain Infrastructure Gap
AI-generated conceptual illustration (Fresh fruits and vegetables in a logistics chain). It explains the idea and does not show study data.
View source evidence ↗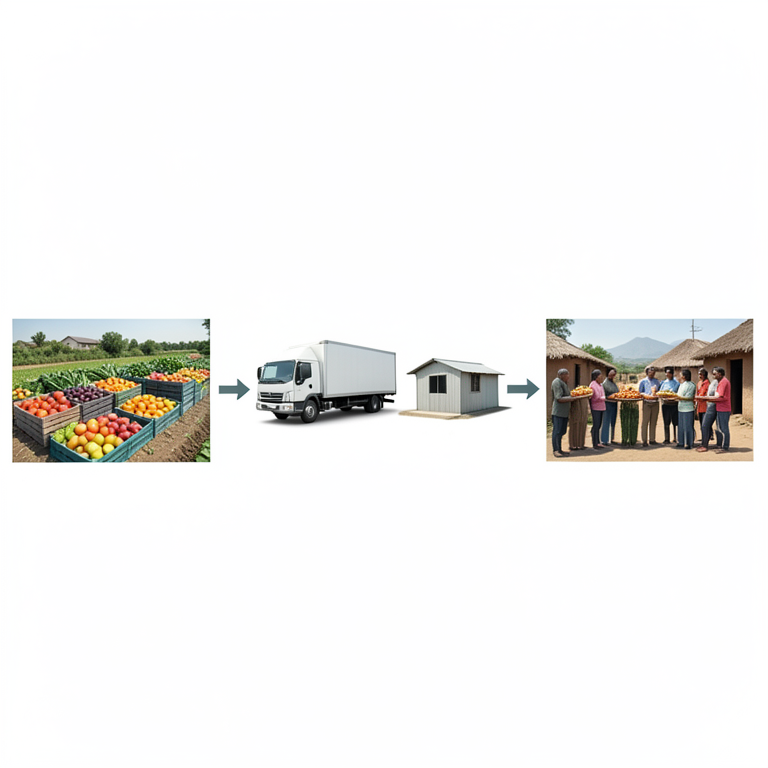
Proposed Social Surplus Pathway
AI-generated conceptual illustration (surplus fruits and vegetables, a refrigerated truck, and a rural village distribution center). It explains the idea and does not show study data.
View source evidence ↗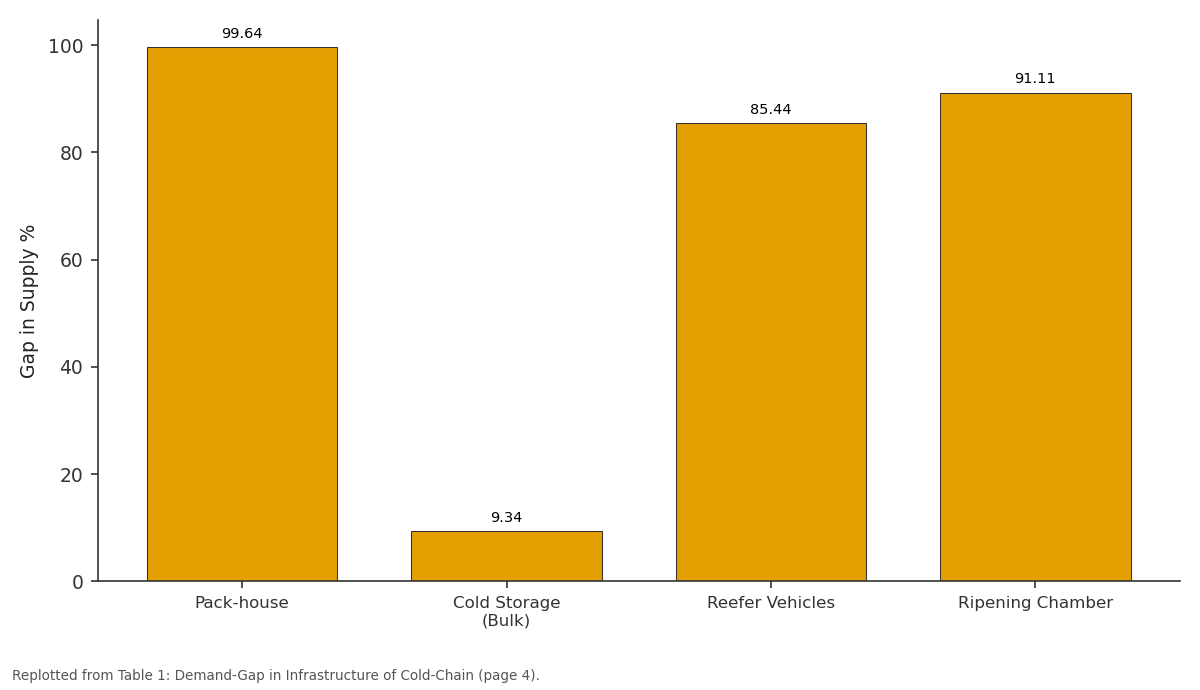
Gap in Supply %: Pack-house vs Cold Storage (Bulk) vs Reefer Vehicles vs Ripening Chamber
Replotted from Table 1 (page 4) of the original paper. Every bar is the paper's own table value.
View source evidence ↗Figures & tables
From the original paper Figure 2
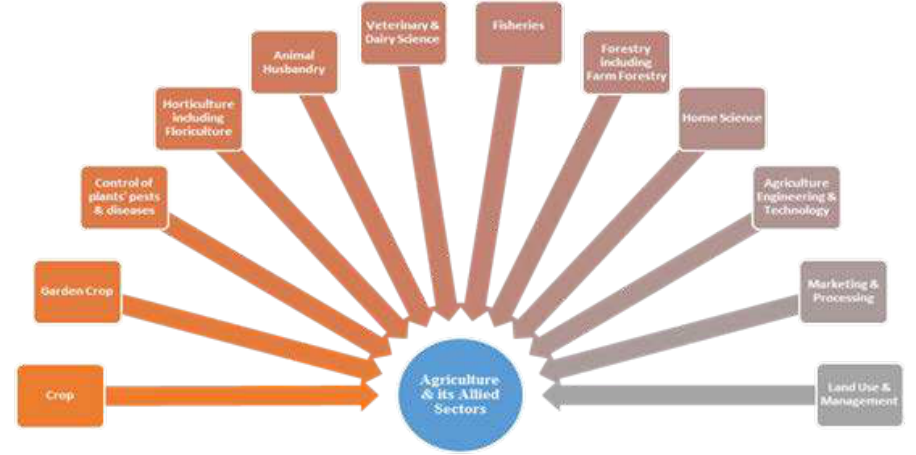 Figure 1
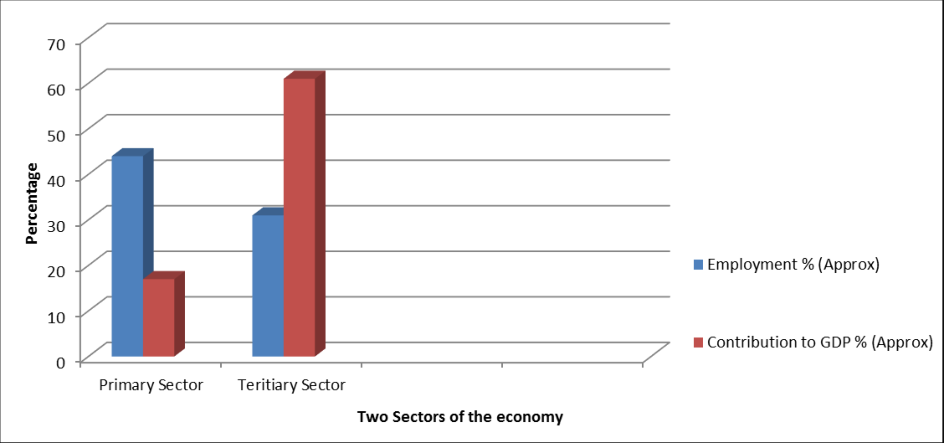 Figure 3
 Table 1
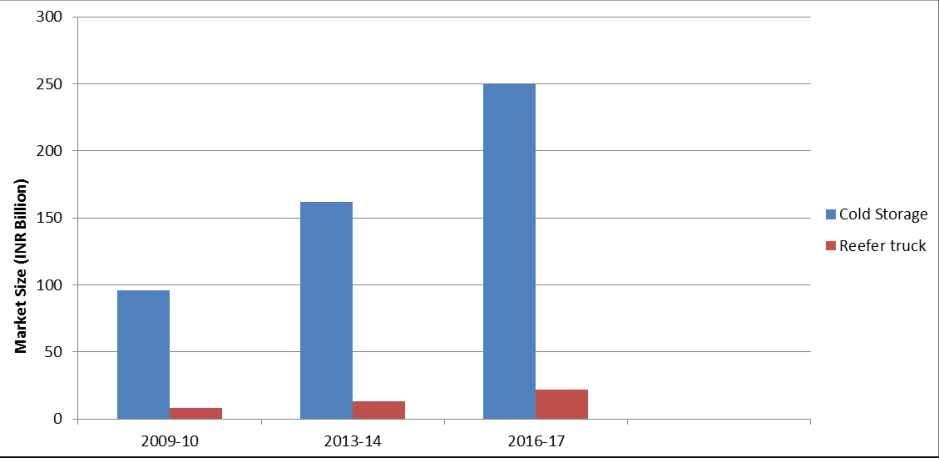 Figure 4
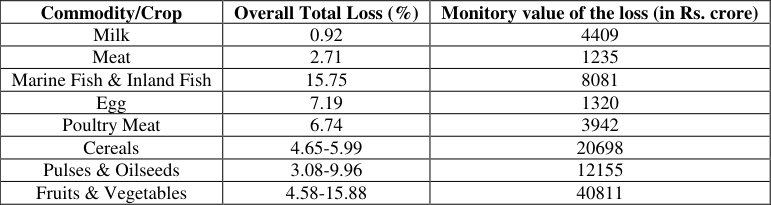 Table 2
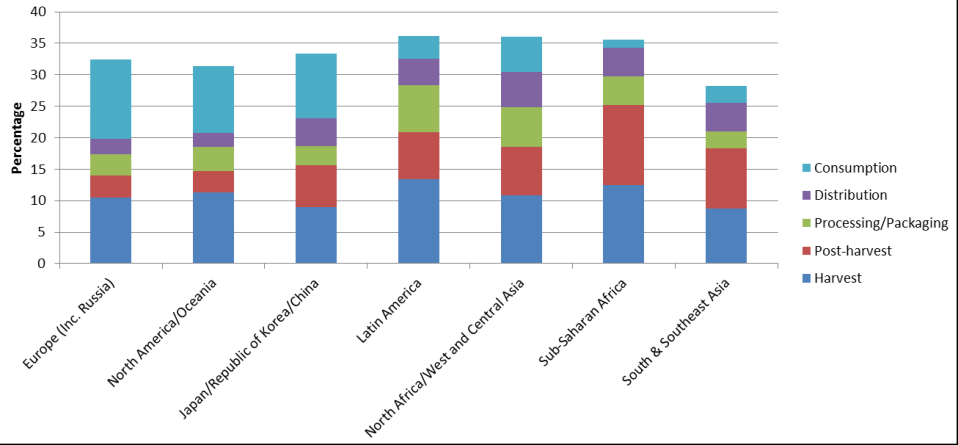 Figure 6
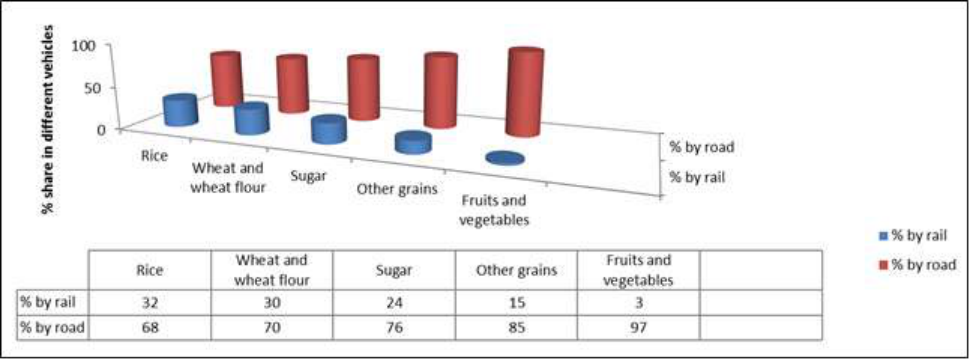 Figure 5
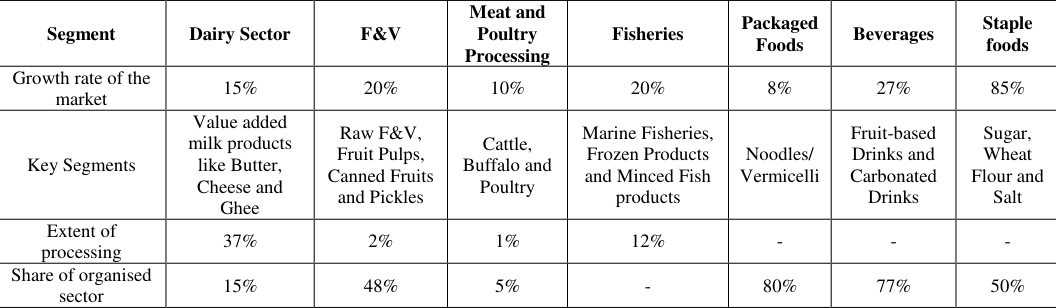 Table 3
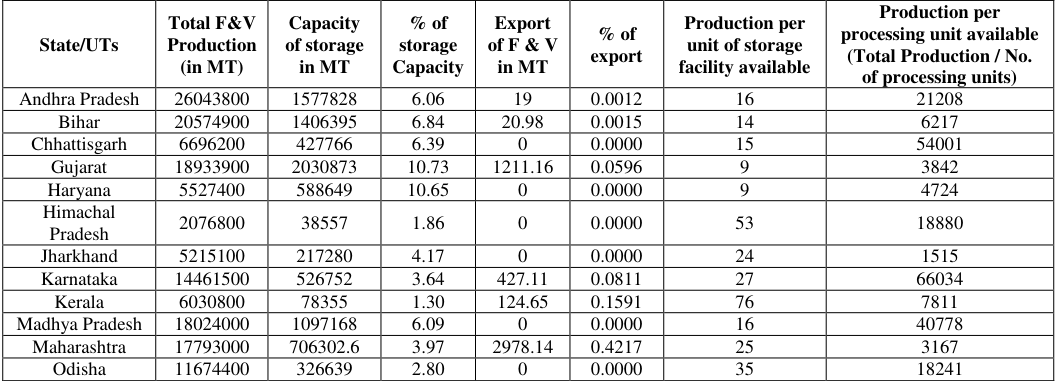 Table 4
 Table 5A
 Table 5A
 Table 5B
 Table 7
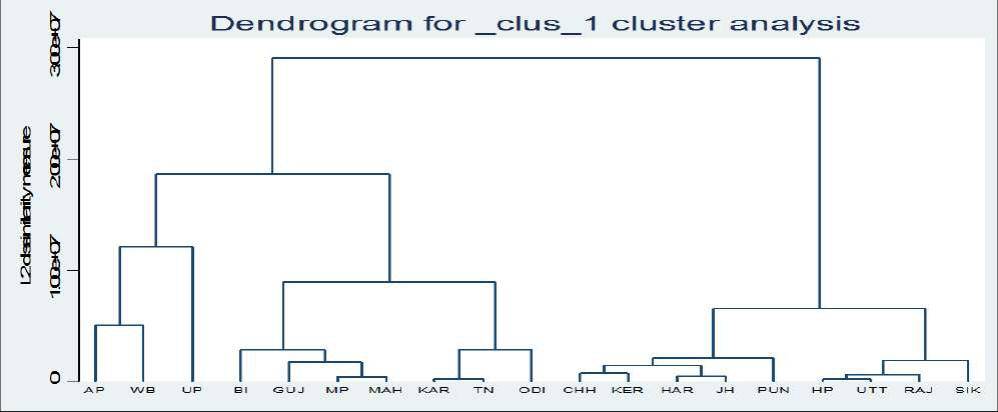 Figure 7
Results
The abundance of fruit and vegetable production in India gives it the title ‘fruit basket of the world’. This paper focuses on the challenge of perishability of surplus F & V that is multiplied due to suboptimal post-harvest management, inadequate storage and transportation facilities. The goal of the paper is to identify the measures (rather, the lack of them) that can address the aforementioned problem, highlighting the regional variations in good practices of surplus management. The authors focus on the all India data to indicate that states with high production is high but low storage capacity throws open opportunities for specialized intervention in the form of processing businesses.
Innovation of new processing technology especially at the farm-level may efficiently utilize a large proportion of underutilized agro-surplus. Keywords: Agro-Surplus, Post-Harvest Management, Cold Chain, Cluster, Food-Processing regarding India’s inability to effectively manage agro- surplus. The challenge of F&V sector is the requirement of crop specific temperature, humidity and gas controlled storage and transport facilities customized according the physiological stage of the crop. Dealing with excess supply of production, India has not gone too far beyond the concept of farm level cold storages, which ultimately leads to a lot of unutilised surplus in the country, amounting to wastage, specifically in case of fruits and vegetables (F & V).
Scarily enough, wasting of food percolates deep into the society through opposing problems of death due to malnourishment and obesity, often referred to as the ‘double burden’ of malnutrition, which is beyond the scope of this paper. The motivation for this study lies in the fact that surplus F&V production in India needs to be optimally managed through adequate storage and processing units. Emphasis is laid on alarming levels of nation-wide inadequacy of agro- surplus management and thereafter, deeper research is done to identify the measures (rather, the lack of them) that can address the aforementioned problem. 1.1 Rationale of Study The rationale of the study is inspired from a host of rich literature in the context of F&V storage and processing in India. Ministry of Food Processing Industries (MoFPI) Report (1999) [1] talks about how our country leads the world production in bananas, mangoes, potatoes and the like, with only 2% being reserved for processing.
This suggests a relatively poor performance in terms of processing compared to the huge potential that the country has in terms of production. The Task Force on Agro Food
Introduction
Following the law of supply, rational farmers increase production in response to high prices, ultimately leading to excess production that causes prices to fall. This leads to either glut in the market resulting from little or no demand for the produce, or surplus in the form of left-over or unsold produce in the local market, both resulting in distress sale at throwaway prices. This phenomenon seems to be more pronounced in those sectors of agriculture where the perishability is higher, namely fruits and vegetables. The proliferating mismatch between demand and supply is due to a time lag between change in price and change of supply, the seriousness of which is often ignored, resulting in magnified mismatches with every passing cycle in the gamut of agriculture which is heterogeneous in terms of seasonality, perishability, marketability and prices.
India is currently referred to as the ‘fruit basket of the world’ due to the magnificent quantities of fruits produced. The country is also a generous producer of vegetables. This paper focuses on the horticultural section of agriculture (Fig 1), including fruits and vegetables (F&V) and excluding floriculture, which is more susceptible to spoilage because of its perishable nature. This sector however is plagued with several obstacles in the forms of lack of skilled labour, insufficient Agri-technology and disorganized post harvest management along with dearth of proper storage and transportation facilities.
In this paper, focus is put on the challenge of perishability of surplus F&V that is multiplied due to disorganised post-harvest management along with dearth of proper storage and transportation facilities. The study is developed on the background of the sad truth 30 production is lost due to faulty harvesting, storage, transportation and distribution. This study also highlighted that the large percentages of losses in F & V production is due to poor post-harvest and marketing logistics including processing units, storage facilities and transportation. This study ends by recommending an integrated growth of the horticulture industry as a whole with special focus on harvest and post- harvest practices with attention on the societal responsibility, as well.
Processing of TIFAC on the sub group on fruits and vegetables report (2003) [2] draws attention to the status of technology in the supply chain of the country. The study put emphasis on a few selected vegetables accounting for about 65% of India’s total production in 2003. It was found that about 25% of the produce was lost only due to inferior practices at the post-harvest level of the value-chain. The report also suggested that in the near future, there is not much possibility of automated machine-oriented harvest of F&V, which would still continue manually.
Gouri Sundaran (2000) [3] in her work also observed that about 35% of F&V Source: Dr. Rajendra Prasad Central Agricultural University Act, 2016 Fig 1: Allied Sectors of Agriculture 1.2 Background of the Study The primary products of agriculture pass through a unique value-chain at every level of its production. The basic structure for an agro-value chain comprises of primary inputs, production, harvest, post-harvest practices, marketing (Fig 2). Broadly we may divide the value-chain as harvest & post-harvest.
In this post-harvest stage the agro-yield has opportunity to be efficiently stored and utilized. Poor infrastructure at the post-harvest level leads to large quantities of poorly managed agro-surplus translating into wastage. Thus, pertaining to the functions of transport and storage facilities, cold-supply chain has a very important role to play. A cold chain is a temperature-controlled supply chain network, with storage and distribution activities carried out in a manner such that the temperature of a product is maintained in a specified range, required to keep it fresh and edible for a much longer period than in normal ambient conditions.
It is important to realize that the entire network of the temperature controlled supply chain consists not only of cold storages but of proper transportation facilities including reefer trucks which are severely in short supply in the country. The supply chain in India is broken and is overburdened with problems like high wastage due to ill managed agro surplus, lack of ample storage, poor modes and infrastructure of transportation, and unnecessary presence of intermediaries. Source: Author’s Own Fig 2: General Agri-value chain 1.3 Objectives of the Study The objectives that the study tries to explore are as follows: • To study the F&V surplus management by the different states of India • To identify states that may be considered as examples of good practices • To identify lacunae in the F&V surplus management • Finally to suggest pathways of addressing the issue 31 The study aims to investigate the nuances in surplus F&V management in India, identify the good practices so that specific intervention may be arrived at that, which will have a spillover effect of academic research on real life practice. It will also address the lacunae and to suggest specific intervention in F&V management, to help potential socio- economic clusters move up the value chain.
Materials And Methods
The data for the paper has been obtained from reliable sources of secondary quantitative data. These include UN National Accounts Statistics data which has been used to compute the contribution of primary versus tertiary sector to India’s GDP, the Food and Agricultural Organisation (FAO), National Horticulture Board, Planning Commission Total Transport System Study, Ministry of Food Processing Industries, Yes Bank-Dutch Embassy collaborative studies on cold supply chain and ASSOCHAM and NABARD’s study on cold chain logistics. Data from handbook of Horticultural Statistics (2014) was used to find the state wise production of F&V in Metric Tonnes and Ministry of Agriculture & Ministry of Food Processing Industries (MoFPI) was used to observe the state wise storage capacity. A simple quartile distribution brought out the stark mismatch among leading F&V producers exhibiting below the required levels of storage capacity.
Therein, a possibility of F&V processing units have been researched upon, to partially compensate for the excess production that turns into wastage, if not stored and transported properly. To delve deeper into the processing units for fruits and vegetables, the Sixth Economic Census of India was referred to. Following the National Industrial Classification (NIC) Codes, the state wise data on the number of F&V processing units were extracted from site of Ministry of Statistics and Programme Implementation (MoSPI). Thereafter, a cluster analysis using State has been performed on the basis of which, a dendrogram has classified the similar kinds of states into each cluster.
A cluster analysis helps to classify Dara objects similar to one another in the same cluster and dissimilar to the objects in other clusters. This analysis helps us prescribe appropriate recommendations for the different states available in terms of F&V processing units. The scope of the research is restricted to the major states of India, the Union Territories and the seven sister states are excluded for the purpose streamlined analysis. 2.1 All India Status and State wise Discourse on Production According to Statist, about 44% of the population was engaged in agriculture in 2016-17 with only 17% contribution to the GDP. [4] As opposed to that, as per the UN National Accounts Statistics data India’s service sector employed only about 31% of the workforce in 2016-17 and contributed to over 60% to the county’s GDP. [5] This large mismatch of results between outputs of each sector in comparison to the employment goes to show that there is heavy underutilization of resources in Indian agriculture (Fig 3). Source: Computed from UN National Accounts Statistics data Fig 3: Employment versus Contribution to GDP in Primary and Tertiary Sectors As per Horticulture Statistics at a Glance 2014 total production of fruits in the year 2013- 14 amounted to 81285.3 MT and vegetables of 162186.6 MT which has been expected to grow further in the years to come. [6] But proper storage facility is yet to rise at a same pace to reduce the post-harvest loss of fruits and vegetables.
The agro- sector continues to be plagued with problems that lead to a repetition of the unutilised agro-surplus cycle all over again. Poor storage and transportation facilities result in post- India’s self sufficiency in terms of agricultural produce is common knowledge to all. The high yields of fruits and vegetables in the country not only help India consume, but also pave way for an attractive export market globally. However, merely high levels of production are not enough to ensure efficiently utilization of the produce through consumption, export and processing.
The backbone of fruits and vegetables production lies in the storage and transportation facilities available in the country. 32 produce for money, lack of logistics connectivity to ensure that their harvest reaches markets in time results in lowering of the farmers’ ability to commercialize and monetize their produce, making it more difficult for perishable agro-food products with a very low shelf-life. Though the availability of cold-storages has increased in the last decade, the country is lagging in all other agro-logistics required to bring the produce from farm to markets (Fig 4). harvest losses annually (Agarwal and Saxena, 2018) [7]. The existing cold supply chain industry in India mainly consists of two fragments temperature controlled vehicles (called reefers) used for transpiration and temperature controlled warehouses (called cold storages) for storing surplus production. The cold supply chain industry is unorganised and there is a dearth of transportation facilities or reefers in comparison to warehouses (Subin R, 2011) [8].
Since a market is the primary medium for farmers to exchange their Source: Report of Committee on World Food Security, FAO Fig 4: Market Size of Cold Chain Industry Alongside, it should be highlighted that the existing cold storage facility is restricted to certain crop types and not assimilated with other crop requirements. India is still far behind in meeting the requirement of integrated pack- houses, reefer trucks and ripening units (Table 1). There is a clear nation-wide gap between the required and the created cold chain infrastructural facilities. It has been reiterated with empirical data that cold-storage is the only facility in the entire cold chain that has received its due importance, with a minimum gap of 9.34%. [9] Beyond that, no other infrastructure has received due importance, with the shortage in all cases being almost 90%.
Table 1: Demand-Gap in Infrastructure of Cold-Chain All India Availability All India Gap (Excess Demand Type of Infrastructure All India Requirement (Demand) (A) (Supply) (B) over supply) (A-B) Gap in Supply % Pack-house 70,080 nos. 249 nos. 69,831 nos. 99.64% Cold Storage (Bulk) 341,64,411MT 31823700MT 32,76,962MT 9.34% Cold Storage (Hub) Total 9,36,251MT 351,00,662 MT Reefer Vehicles 61,826nos. 9000 nos. 52,826 nos. 85.44% Ripening Chamber 9,131nos. 812 nos. 8,319 nos. 91.11% Source: NCCD.2015.AllIndiaCold-chainInfrastructur capacity (Assessment of Status & Gap), Delhi (www.nccd.gov.in) This lack of facilities in the cold supply chain has a more pronounced effect on F&V with its uniquely short shelf-life. Horticulture produce demands sensitive handling and transportation support. In the absence of robust and sustainable logistics mechanisms more than half of fruits and vegetable produce end up as waste even before they arrive in the market (National Horticulture Board, 2014) [10] .It is imperative that the fresh perishables must not be stored close to production centres but moved to demand centers while still young to withstand harsh effects of transportation. The pan-India network of Indian Railways is the optimal and preferred choice for movement of horticultural produce.
Yet, among the top 21 commodities moved by rail and road, about 3% of the total volume of F&V is moved by the railways whereas the remaining 97% is moved by road, despite the fact that specialized temperature controlled transportation is easier to provide by railway than by road [11]. What is more interesting is that rice, wheat flour and other food grains which are relatively less perishable and can withstand harsher temperatures in nature have a higher percentage of rail to road transport (Fig 5). However, the challenges of railway transportation lack of yard facilities to handle perishables like F&V. This data substantiates the fact that unutilised agro-surplus gets converted to agro-wastage primarily because of gaps in 33 infrastructure.
This plentiful production, due to improper transportation, translates into excess supply, causing a fall in the selling price of F&V at the farm level. Figure 6 below shows that for South and Southeast Asia the largest percentage of unutilised agro-surplus happens at the post- harvest level which is a whopping 9.6% of the total surplus. It is almost the same in India because post harvest loss of horticulture produce constitutes between 5-39 per cent of total production [12]. This clearly shows a deficiency in effective storage facilities across countries in South and Southeast Asia in general which India a significant part is of.
Source: Computed from the data available from Planning Commission Total Transport System Study Fig 5: % share of items moved by road and rail Source: CRISIL Research, YES BANK Analysis Fig 6: Distribution of food-waste along the supply chain Furthermore, at the national level, it is visible (Table 2) that due to the different challenges in surplus production management of F & V amounts to wastage ranges from nearly 5% to 16% [13]. This absolute loss in terms of money is also the highest among all agricultural produce in this sector amounting to INR 40,811 Crores in 2013. Table 2: Losses of various agricultural produce in India using 2012-2013 data Commodity/Crop Overall Total Loss (%) Monitory value of the loss (in Rs. crore) Milk 0.92 4409 Meat 2.71 1235 Marine Fish & Inland Fish 15.75 8081 Egg 7.19 1320 Poultry Meat 6.74 3942 Cereals 4.65-5.99 20698 Pulses & Oilseeds 3.08-9.96 12155 Fruits & Vegetables 4.58-15.88 40811 Source: http://www.investmentcommission.in/food_&_agro_ products.htm and KPMG Analyses 34 3.2 The role of fruits & vegetables processing units in India As reported by MoFPI, India is one of the largest producers of a host of agricultural commodities and the second largest consumer market. Currently India is the second largest F&V producer, with a global production of about 259 million MT [14].
| Commodity/Crop | Overall Total Loss (%) | Monitory value of the loss (in Rs. crore) |
|---|---|---|
| Milk | 0.92 | 4409 |
| Meat | 2.71 | 1235 |
| Marine Fish & Inland Fish | 15.75 | 8081 |
| Egg | 7.19 | 1320 |
| Poultry Meat | 6.74 | 3942 |
| Cereals | 4.65-5.99 | 20698 |
| Pulses & Oilseeds | 3.08-9.96 | 12155 |
| Fruits & Vegetables | 4.58-15.88 | 40811 |
Table text extracted from the original PDF; superscript letters are shown inline. The original table image is below.
View original table image
The fruits and vegetables which deserve special mention in terms of India’s production are bananas, papaya, mangoes and guavas, second largest producer of potatoes, green peas, tomatoes, cabbage and cauliflower. One of the fastest growing economies in the world, with attractive investment potential and a knack for modern technology, the country should have performed far better in terms of storage, management in post harvest and processing, as compared to its current level. However, the country witnesses about 5% to 16% wastage in fruits and vegetables every year [13]. A few of the reasons for post harvest wastage in fruits and vegetables are possibly as follows: a) Exogenous factors like injury due to improper handling & transportation or pests attacks on F&V b) Endogenous factors like quality deterioration due to improper storage facilities and extreme temperatures However, another very important reason can be extremely low levels of processing in F&V which stands at about a negligible 2% of the total produce [13] (Table 3).
| Segment | Dairy Sector | F&V | Meat and Poultry Processing | Fisheries | Packaged Foods | Beverages | Staple foods |
|---|---|---|---|---|---|---|---|
| Growth rate of the market | 15% | 20% | 10% | 20% | 8% | 27% | 85% |
| Key Segments | Value added milk products like Butter, Cheese and Ghee | Raw F&V, Fruit Pulps, Canned Fruits and Pickles | Cattle, Buffalo and Poultry | Marine Fisheries, Frozen Products and Minced Fish products | Noodles/ Vermicelli | Fruit-based Drinks and Carbonated Drinks | Sugar, Wheat Flour and Salt |
| Extent of processing | 37% | 2% | 1% | 12% | - | - | - |
| Share of organised sector | 15% | 48% | 5% | - | 80% | 77% | 50% |
Table text extracted from the original PDF; superscript letters are shown inline. The original table image is below.
View original table image
Table 3: Extent of food processing across different agri-sectors in India Meat and Segment Dairy Sector F&V Fisheries Packaged Foods Beverages Staple foods Poultry Processing Growth rate of the market 15% 20% 10% 20% 8% 27% 85% Key Segments Noodles/ Vermicelli Value added milk products like Butter, Cheese and Cattle, Buffalo and Poultry Raw F&V, Fruit Pulps, Canned Fruits and Pickles Marine Fisheries, Frozen Products and Minced Fish products Fruit-based Drinks and Carbonated Drinks Sugar, Wheat Flour and Salt Ghee Extent of processing 37% 2% 1% 12% - - - Share of organised sector 15% 48% 5% - 80% 77% 50% Source: http://www.investmentcommission.in/food_&_agro_products.htm and KPMG Analyses
Results
Going deeper into the analysis, the state wise production and storage capacity give us a clearer picture of the extent of ill management at the post harvest level. Table 4 shows us the state-wise production of F & V in 2012-2013, along with the state-wise storage capacity in cold storages. The total production of fruits in the year 2013-14 amounted to 81285.3 MT and vegetables of 162186.6 MT. Lakshadweep is the UT with the lowest production of 800 MT whereas West Bengal is the highest at 28639300MT of fruits and vegetables [6].
| State/UTs | Total F&V Production (in MT) | Capacity of storage in MT | % of storage Capacity | Export of F & V in MT | % of export | Production per unit of storage facility available | Production per processing unit available (Total Production / No. of processing units) |
|---|---|---|---|---|---|---|---|
| Andhra Pradesh | 26043800 | 1577828 | 6.06 | 19 | 0.0012 | 16 | 21208 |
| Bihar | 20574900 | 1406395 | 6.84 | 20.98 | 0.0015 | 14 | 6217 |
| Chhattisgarh | 6696200 | 427766 | 6.39 | 0 | 0.0000 | 15 | 54001 |
| Gujarat | 18933900 | 2030873 | 10.73 | 1211.16 | 0.0596 | 9 | 3842 |
| Haryana | 5527400 | 588649 | 10.65 | 0 | 0.0000 | 9 | 4724 |
| Himachal Pradesh | 2076800 | 38557 | 1.86 | 0 | 0.0000 | 53 | 18880 |
| Jharkhand | 5215100 | 217280 | 4.17 | 0 | 0.0000 | 24 | 1515 |
| Karnataka | 14461500 | 526752 | 3.64 | 427.11 | 0.0811 | 27 | 66034 |
| Kerala | 6030800 | 78355 | 1.30 | 124.65 | 0.1591 | 76 | 7811 |
| Madhya Pradesh | 18024000 | 1097168 | 6.09 | 0 | 0.0000 | 16 | 40778 |
| Maharashtra | 17793000 | 706302.6 | 3.97 | 2978.14 | 0.4217 | 25 | 3167 |
| Odisha | 11674400 | 326639 | 2.80 | 0 | 0.0000 | 35 | 18241 |
Table text extracted from the original PDF; superscript letters are shown inline. The original table image is below.
View original table image
It can be clearly seen that there is a huge gap in the supply of F&V and the quantity that can be stored successfully. Notwithstanding the quantity being exported and consumed, the quantity of F & V that is actually stored is far less than that which should be stored. The share of F & V export is also negligible compared to the production, with Punjab being the highest exporter at 0.34% of the total produce. From this table it is also visible that the storage capacities vary widely and the highest storage capacity in proportion to its production is in Uttar Pradesh at 55.09% whereas the lowest is in Puducherry at 0.25% Following this, a Quartile wise state list has been calculated to get an understanding about the states which may fall under the special lens of the study, both in terms of excess production and/or un-stored and unutilised agro surplus (Tables 5a & 5b) Table 4: State wise production, storage capacity, export, production available per storage facility and production available per processing unit State/UTs Production per processing unit available (Total Production / No. % of export Total F&V Production (in MT) Capacity of storage in MT % of storage Capacity Export of F & V in MT Production per unit of storage facility available of processing units) Andhra Pradesh 26043800 1577828 6.06 19 0.0012 16 21208 Bihar 20574900 1406395 6.84 20.98 0.0015 14 6217 Chhattisgarh 6696200 427766 6.39 0 0.0000 15 54001 Gujarat 18933900 2030873 10.73 1211.16 0.0596 9 3842 Haryana 5527400 588649 10.65 0 0.0000 9 4724 Himachal Pradesh 2076800 38557 1.86 0 0.0000 53 18880 Jharkhand 5215100 217280 4.17 0 0.0000 24 1515 Karnataka 14461500 526752 3.64 427.11 0.0811 27 66034 Kerala 6030800 78355 1.30 124.65 0.1591 76 7811 Madhya Pradesh 18024000 1097168 6.09 0 0.0000 16 40778 Maharashtra 17793000 706302.6 3.97 2978.14 0.4217 25 3167 Odisha 11674400 326639 2.80 0 0.0000 35 18241 35 Punjab 5285100 2004778 37.93 6758.33 0.3371 2 19943 Rajasthan 1590300 480032 30.18 0 0.0000 3 3167 Sikkim 156500 2000 1.28 0 0.0000 78 31300 Tamilnadu 14597800 295671 2.03 371.73 0.1257 49 3101 Uttar Pradesh 24747700 13633039 55.09 10.05 0.0001 1 3638 Uttarakhand 1865300 84545 4.53 0 0.0000 22 8290 West Bengal 28639300 5901925 20.61 4270.44 0.0724 4 14559 Source: Hand Book on Horticulture Statistics 2014 Table 5a: Quartile Distribution of States on the basis of production Quartile 1 Himachal Pradesh, Jharkhand, Rajasthan, Sikkim, Uttarakhand Quartile 2 Chhattisgarh, Haryana, Kerala, Odisha, Punjab Quartile 3 Karnataka, Madhya Pradesh, Maharashtra, Tamil Nadu Quartile 4 Andhra Pradesh, Bihar, Gujarat, Uttar Pradesh, West Bengal Source: Author’s Own Table 5b: Quartile Distribution of States on the basis of storage capacity Quartile 1 Himachal Pradesh, Jharkhand, Kerala, Sikkim, Uttarakhand Quartile 2 Chhattisgarh, Karnataka, Odisha, Rajasthan, Tamil Nadu Quartile 3 Bihar, Haryana, Madhya Pradesh, Maharashtra, Uttar Pradesh, West Bengal Quartile 4 Andhra Pradesh, Gujarat, Punjab Source: Author’s Own sector, only about 2% of the total F&V production is sent for processing.
F&V processing is considered as a special category under the Government of India regulations. In this context it is necessary to explain the significance of National Industry Classification (NIC) codes in the country. According to both Central Statistical Organisation (CSO) and MoSPI, NICs are essential statistical standards for maintaining a comparable database on the basis of economic activities performed. The feature of comparability and usability of various types of economic data are prerequisites to the process of standardization of a system of classification.
Relevant to this study, the (NIC) Code classifies the manufacturers of F&V processing under NIC ‘103’. It is observed in Table 4 that the yields per unit of processing unit available are very high for most of the states where the burden for processing becomes too heavy. These states include Karnataka, Madhya Pradesh and Chhattisgarh that highlight acute shortage of F&V processing units. It is essential to set up more processing units in these states to not only ease the burden of surplus production, but also to add value to the otherwise surplus agro produce and increase the prospects of marketability of the same.
To delve deeper in to the aspects of F&V processing units, a cluster analysis has been performed on all the states excluding the seven sister states and the Union Territories that has classified every state on the basis of their similarity in terms of production, storage and processing burden (Table 7). A dendrogram (Fig 7) pictorially depicts the grouping of the states. It can be seen here that despite high production, states like Andhra Pradesh, Madhya Pradesh, Tamil Nadu, Bihar, Maharashtra, Karnataka, Odisha and West Bengal, which have more than 100lakh MT of production, have very poor storage capacities (less than 10% of production). On the other hand, states like Punjab and Haryana, produce less, but have considerable storage capacity in comparison to the production levels.
In most of the cases, there is a visible mismatch between the production quantity and storage capacity where the latter falls severely short in proportion to the former. In states such as these, where production is very high but storage capacity is very low, there lies opportunities for growth of F&V processing businesses. Addressing the severe dearth of storage capacity of perishables along with improving transportation ability will help reduce underutilization of surplus agro-production. This is where, processing businesses come into play.
Innovation and development of new processing technology can help address the current issue of agro-surplus resulting in wastage of F&V, especially at the farmers level. The supply-chain of fruits and vegetables (F&V) in the processing industry, which takes the F&V from the farm to the fork is multifaceted and requires delicate and intricate handling. Highly perishable, with a very short shelf-life, F&V tend to spoil quickly if proper care in transportation and storage is not met before delivering to the end consumer. However, it is clearly visible that even though India’s production of F&V is leading, not much attention has been paid to the processing of F&V (Table 2&3).
It can be seen that although F&V have a market growth rate of 20% with nearly 50% being managed by the organized Table 7: State wise Hierarchical Cluster Analysis on the basis of production, storage capacity and processing units Cluster 1 Cluster 2 Cluster 3 Cluster 4 Cluster 5 Andhra Pradesh- Madhya Pradesh – Chhattisgarh Himachal Pradesh- West Bengal Maharashtra Karnataka - Tamil Nadu - Kerala Uttaranchal Uttar Pradesh Gujarat Odisha Haryana-Jharkhand Rajasthan Bihar Punjab Sikkim Source: Author’s Own 36 The dendrogram classifies Andhra Pradesh, Uttar Pradesh and West Bengal into the same cluster as the highest producers of F&V. Although, Andhra Pradesh and West Bengal have very low storage capacity (6% and 20% respectively), it is as high as 55% in Uttar Pradesh, which still falls short of the entire production. This requires strengthening of the entire cold chain to increase storage capacity. Additionally, high productions with low processing implies that there is scope for working on the specifics of better processing units.
There is a major requirement for Andhra Pradesh and West Bengal regarding the expansion of technological intervention in the post- harvest process, for increasing efficiency in activities like sorting and grading of F&V produce. One such example can be the potato sorting and grading machines invented by C- DAC that are yet to receive commercial marketing in Kolkata, West Bengal. The second cluster consisting of Madhya Pradesh, Maharashtra, Bihar and Gujarat have similar characteristics of high production with less than 10% storage capacity and low processing. Madhya Pradesh is noted for its surplus green peas, tomato and onion production, and Maharashtra for onion, grapes and pomegranate production.
Therefore, in this case, organised sector intervention is required for preserving and processing opportunities in form of frozen food,(IQF), canned food, pulp, puree, paste, sauces, snacks, dressings, flakes, dices, dehydration, pickles, juices, slices, chips, jams, jelly, and RTS drinks. Bihar requires special facilities for dehydration and powdering of its huge production of vegetables like onions, mushrooms, etc. and seasonal fruits like litchi. Pack houses and ripening chambers for mango and pomegranate in Gujarat, along with cold chains for onion are the needs of the hour. It is also important to understand that processing at the micro scale including home-based preservation can also go a long way in managing surplus agro-produce and adding value to it.
Such home-based processing industries serve the dual purpose of rejuvenating the rural economy by employment generation of women and also promoting traditional recipes using indigenous spices that have the roots in organic preservation along with promoting cultural bonding. Source: Author’s Own Fig 7: Dendrogram classifying the states into five Clusters
Discussion
5.1 Existing challenges in the F&V processing industries in India The F&V processing industry is overburdened with challenges that remain unaddressed till date. Firstly, ‘scale’ is a key consideration in processing. India’s food processing industry is predominantly small scale, with 90% of the enterprises falling under the MSME category. This prevents the industries from exploiting the economies of scale.
Secondly, a broken value chain and lack of backward linkages with the farmers result in poor quality of F&V production. Thirdly, while processing units mainly are export oriented, there is very little penetration of the processed output in the domestic market, with penetration of processed F&V production at only 10% (IBEF, 2013) [15]. Increased tapping of customer base is required. Fourthly and most importantly, acute shortage of investment incentives in the processing industry result in lack of modern technology and state-of-the-art logistics for an efficient functioning. 5.2 F&V Surplus Management: National & State Initiatives The Government of India takes into consideration the overall F&V sector scenario and details initiatives.
The importance of this issue is within the focus of Ministry of Food Processing Industries (MoFPI). Managing post-harvest yields requires storing and maintaining quality of production simultaneously by minimizing wastage. The purpose of post- harvest management is to increase the shelf life of perishables to the maximum possible extent. One of the key ways in which F&V production can be managed post- harvest, is through the processing industry.
A dynamic and sturdy food processing sector significantly reduces the proportion of wastage simultaneously while adding value to the agricultural produce. It also aids in commercialization and diversification of the agri-sector along with creating job opportunities aplenty. If conducted in an organised and systematic manner, processed food can significantly contribute to export earnings of the country. Attention requires to be drawn to Pradhan Mantri Kisan 37 Sampada Yojana which is a flagship programme of the Indian Government for boosting investment in food processing.
The aim here is to develop modern infrastructure to encourage entrepreneurs for setting up food processing units by linking farmers to processors and markets through an integrated supply chain. Here, each agro processing cluster is mandated to possess basic enabling infrastructure like roads, power supply, etc, core infrastructure like sorting, grading and cold storage facilities, along with at least 5 food processing units with investment of INR 25 Crore and above [16]. Therefore, nationwide, the support of the government has been on the rise in the recent past. Additionally, certain state focused initiatives have also been taken up by the government.
Some of the many state wise initiatives are as follows. In Andhra Pradesh, the State government grants 10% additional subsidy to agro processing units and a 25% airfreight subsidy to encourage export of agro-processed food. The Punjab government has allowed every processing unit to purchase agricultural products directly from the farmers. This exempts them from the web of middlemen.
The necessary exemption is given to them under the Punjab APMC Act. The Madhya Pradesh government declared that no mandi fee would be charged on agricultural produce to be used as raw material for food processing industries even if they are purchased from outside the state. Uttar Pradesh has announced a policy announced for Agriculture Horticulture Development Zones for identified produce grown in geographically contiguous areas, to aid end to end development of horticulture and agricultural produce that is potentially marketable. The objective is to identify the bottlenecks at each stage of the value chain and suggest interventions accordingly.
Karnataka accelerated the development of food processing industries by identifying 11 Agro Climatic Zones ideally suited for cultivation of a variety of flowers, fruits & vegetables, etc. Harnessing these resources to the fullest extent will be ensured to create a value chain for several stakeholders involved, including farmers, processers and end consumers. West Bengal has made considerable effort in reducing distress sale through its supply chain management process of Sufal Bangla. This system ensures through mobile and static retail outlets that the right produce is available at the right time in the right place at the correct price.
The farmers sell their produce at the Krishak Bazars wherefrom the produce reaches the Sufal Bangla retails, which ensures that the farmers are also paid the due price immediately after dropping off their produce. Additionally, agro food parks are being set up in the state and entrepreneurs are being financially backed to set up capital intensive capacities like warehouses, cold storages quality control laboratories and the like. The state is also stepping up its cold chain units dealing in F&V production, some of which are Keventer Agro Ltd, Basukinath Food Processors Pvt. Ltd, Prime Cold Storages Pvt.
Ltd, to name a few.
Conclusion
Several opportunities have opened up in processing in the face of globalization where the consumers are more welcoming to processed food in general. Processing can help in the development of new product, convenience food, beverages and health food. Frozen, canned F&V increase the shelf life of the products whereas pickles, juices, jelly, sauces and pastes and other ways of up-cycling the products add value to the F&V and result in greater commercial profitability. However, none of these can be fully tapped unless greater initiatives are taken by the government and private entrepreneurs alike by emphasizing on processing industry. 6.1 Recommendations The easiest start to managing F&V post harvest is through primary or first generation processing of produce at the farm level.
As a result, even though the scale of production is micro, the pressure for transporting and storing perishables are eased. Besides, it is also pertinent to increase investment opportunities to build better infrastructure for storage and processing to reduce unutilised agro surplus. Moreover, state-of-the-art quality control storing and apex marketing bodies should be associated with the large number of farmers and/or farm level processing units. Additionally, while considering the social aspect of such F&V surplus, it is highly advisable to increase the awareness of farmers about the existence of non-profit food organisations and encouraging the link between the suppliers (the farmers) and the demand (charity organisations) or social enterprises (Food Bank, or Robin Hood Army).
This will ensure sustainability as well as inclusiveness of even the poorest stakeholder, across the value chain. To ensure sustainable pathways of such socially responsible activities it is necessary to design business models so that the loss is not borne by the farmer. A mechanism needs to be designed which will induce the farmer to increase their profitability by voluntarily reporting of surplus quantities. One of the suggested ways is to reduce/prevent surplus creation in the first place by scientifically planning crop types and quantities by farmer and enforcement of required restriction on the price mark up between farmers and retail chains.
Additionally the farmer should not suffer from information asymmetry. Again surpluses if created, can be voluntarily reported (throughout the food chain). This will enable social entrepreneurs or non-profit organisations establish a mechanism by which farmers can report surplus in real time and the technology based information management system may procure these for distribution through cold chain run public distribution system, a la the existing PDS. A cold chain connected PDS will make sure the surplus F&V reach the under nourished and remote sections of under privileged population.
Such a proposal needs a balanced interface of state and technological intervention and entrepreneurial spirit. On the whole, the untapped potential of surplus management is evident in two aspects: the technological advancements following R&D in laboratories that lack the outreach for societal use and commercial marketing; and the technological intervention in the field of processing and cold chain. On the other hand the promotion of small home based enterprises using traditional modes of F&V preservation is also an important avenue for persuasion. It is believed that specific intervention based on Government of India policy of ‘Make in India’, coupled with schemes like integrated cold-chains, forward and backward linkage strengthening food processing, will lead the way for the 38 https://mofpi.nic.in/Schemes/cold-chain.
January, 2020. Indian F & V market to reach global heights.
Acknowledgement
Sincere thanks and gratitude is conveyed to the UGC- UKIERI Project (Phase-III) entitled “Fostering Entrepreneurship for sustainable and inclusive Agri-food Innovation, A Comparative Study of India and the UK”. 9. Reference 1. Government of India Report, ‘Food Processing- Fact sheet’, MOFPI reports, 1999, 01-03. 2. TIFAC Report.
Agro-food processing: technology vision 2020: fruits and vegetables current status and vision. TIFAC report 2000. 3. Sundaran G. Processed tropical fruits – A product profile.
Agricultural and Processed products Export Development Authority (APEDA) Reports, 2006, 2- 29. 4. India: Distribution of the workforce across economic sectors from, 2009 to 2019. https://www.statista.com/statistics/271320/distributio n-of-the-workforce-across-economic-sectors-in-india/ January, 2020. 5. National Accounts Statistics. Analysis of Main Aggregates, 2017. https://unstats.un.org/unsd/nationalaccount/sdPubs/a ma-2017.pdf, January, 2020. 6.
Saxena M.H. Book on Horticulture Statistics, Hand Book on Horticulture Statistics, Government of India ministry of agriculture department of agriculture and cooperation, 2014, 9-10. 7. Agarwal N.R, Saxena A. Supply Chain Management of Indian Agriculture Industry: An exploratory study, Global Journal of enterprise information system. 2018; 10:1. 8.
Subin, Renie. Country: India's cold chain industry. Indo-American Chamber of Commerce, available at https://www.iaccindia.com/userfiles/files/India’s%20 Cold 20. 2011. 9. NCCD.
All India Cold-chain Infrastructure Capacity. Assessment of Status & Gap, Delhi www.nccd.gov.in. 2015. January, 2020. 10. National Horticultural Board.
Nbh.gov.in, 2014. January, 2020 11. Kohli P. Railways mode of Transport for cross- regional Trade of Perishable Agri-produce, National Cold-chain Development (NCCD). 12.
Cold Chain Opportunities in India. https://www.yesbank.in/pdf/indian_organic_sector- vision_2025.pdf. October, 2019. 13. Food Processing Market & Opportunities. https://www.ibef.org/download/Food_Processing_27 0608.pdf. January, 2020. 14.
Ministry of food processing industries report, Fruits and vegetables processing: capacity and Production MOFPI Report, 2001. 15. Agriculture in India. Information about Indian Agriculture & Its Importance. https://www.ibef.org/industry/agriculture-india.aspx. January, 2020 16.
Cold Chain. Ministry of Food Processing Industries GOI. 39
Figures and tables from the paper
| Punjab | 5285100 | 2004778 | 37.93 | 6758.33 | 0.3371 | 2 | 19943 |
|---|---|---|---|---|---|---|---|
| Rajasthan | 1590300 | 480032 | 30.18 | 0 | 0.0000 | 3 | 3167 |
| Sikkim | 156500 | 2000 | 1.28 | 0 | 0.0000 | 78 | 31300 |
| Tamilnadu | 14597800 | 295671 | 2.03 | 371.73 | 0.1257 | 49 | 3101 |
| Uttar Pradesh | 24747700 | 13633039 | 55.09 | 10.05 | 0.0001 | 1 | 3638 |
| Uttarakhand | 1865300 | 84545 | 4.53 | 0 | 0.0000 | 22 | 8290 |
| West Bengal | 28639300 | 5901925 | 20.61 | 4270.44 | 0.0724 | 4 | 14559 |
Table text extracted from the original PDF; superscript letters are shown inline. The original table image is below.
View original table image
References
0 in the original paperCited by 4
From OpenAlex, OpenCitations and reference lists read by Scinovex
- Seafood enzymes and their potential industrial applications ↗
Varsha Likhar, BG Chudasama · Journal of Entomology and Zoology Studies · 2021
Enzymes are key tools in biotechnology and related areas because of their catalytic nature. Accordingly, they have been extensively used in food production and processing for centuries, albeit in a rather empirical manner, which has been superseded by a rational approach in the last decades. In recent years, the focus has been on technical and scientific issues (enzyme formulations, molecular
- Nanotechnology as one of the possible solutions to the problem of civilization or threat to humanity
BH Aliev, NF Kazymov, ZH Aliev, Kh Akhmedova, GM Feyzullaeva, LM Ismailova · International Journal of Research in Agronomy · 2021
Nanomaterial’s and nanotechnologies are used in almost all areas of agriculture: crop production, animal husbandry, poultry farming, fish farming, veterinary medicine, processing industry, agricultural machinery production, etc. The purpose of this article was to review the literature on the use of nanotechnology in agriculture, the risks and safety of using nanotechnology. The current generation of the world of 7.8 billion is expected to reach 8.6 billion in 2030, 9.8 billion in 2050 and 11.2 billion in 2100. This means that food security will require new systems for the production of food, w
- Consumer segmentation of the affordable luxury apparel market in India ↗
Sheena Gupta, Sougata Banerjee · International Journal of Research in Marketing Management and Sales · 2023
Affordable luxury is developing at a rapid pace in a developing country like India. Growing number of HNIs and urban middle-class, which has a penchant for luxury brands, are some of the reasons for the growth of affordable luxury brands. Different consumers purchase these brands to satisfy different needs. Some do it for self-actualisation, some purchase luxury brands for their…
❝ 0PDF - Influence of pre-treatment on functional properties of potato flour ↗
Vaishali Vaishali, Samsher Gautam, Bhoj Raj Singh, Suresh Chandra, Neelash Chauhan · Journal of Pharmacognosy and Phytochemistry · 2020
Potato is the most important tuber crop in the world. It belongs to family Solanaceae and plays an important role in world food security as it is a cheaper and plentiful crop. It is a versatile, carbohydrate-rich food. The pre-treatments on fruit and vegetables before drying in one form or other viz., washing in water, blanching, KMS, sugar, salt either