
Research article · 2020 · Full text
International Journal of Statistics and Applied MathematicsThe relationship between the three major sampling distributions and the normal distribution
Volume 5(5) · Pages 07–11
Research areasAdvanced Measurement and Detection MethodsAdvanced Algorithms and ApplicationsBlasting Impact and Analysis
Abstract
Author-writtenThe chi-square distribution, tdistribution and Fdistribution are the three most important sampling distributions in probability theory and mathematical statistics. They all have a certain relationship with the normal distribution, and they are asymptotically normal under certain conditions. This article first combines the gamma distribution and the moment generating function indicate the correlation properties of the three major sampling distributions and the relationship between the three. Using the relevant functions such as the characteristic function and the central limit theorem to explain that they all converge to the normal distribution under certain conditions. At the same time, they use mathematical software MATLAB to verify.
Summary
Source-checkedPlain-language reading of the full paper, prepared with AI and checked against the text. Each point links to the authors' own words.
Why it matters
- The chi-square, t, and F distributions are fundamental sampling distributions used extensively in probability theory and mathematical statistics. View evidence ↗
- These distributions are critical for statistical inference tasks, including analysis of variance, interval estimation, and hypothesis testing. View evidence ↗
- Understanding how these distributions relate to the normal distribution allows complex distributions to be transformed into a more manageable normal form. View evidence ↗
The question
- The study aims to analyze the connections between the chi-square, t, and F distributions and the normal distribution, proving that they converge to the normal distribution under specific conditions. View evidence ↗
What they did
- The author uses the gamma distribution and moment generating functions to demonstrate the correlation properties and relationships between the three sampling distributions. View evidence ↗
- The convergence to the normal distribution is explained using the central limit theorem and characteristic functions. View evidence ↗
- MATLAB software was employed to numerically verify the mathematical proofs of convergence. View evidence ↗
What they found
- The F-distribution converges to a normal distribution with mean 1 and variance 1/n as both parameters m and n approach infinity. View evidence ↗
- MATLAB visualizations confirm that the chi-square distribution's density function becomes increasingly similar to the normal distribution as n increases. View evidence ↗
What it means
- The authors conclude that the normal distribution can be used to approximate the chi-square, t, and F distributions when the sample size is large. View evidence ↗
- The author suggests that utilizing multiple proof methods for a single property enhances the understanding of the relationships between these distributions. View evidence ↗
Visual summary
1 visualsIllustrations explain the paper; they do not show study data.
Convergence Concept
AI-generated conceptual illustration (mathematical probability distribution curves). It explains the idea and does not show study data.
View source evidence ↗Figures & tables
From the original paper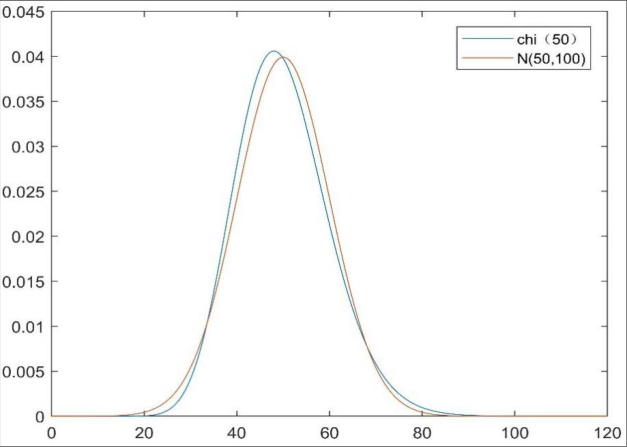 Figure 1
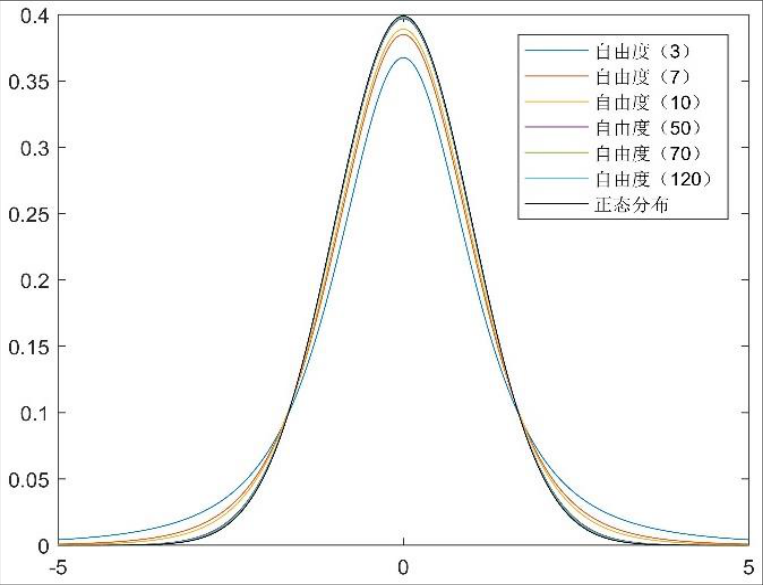 Figure 2
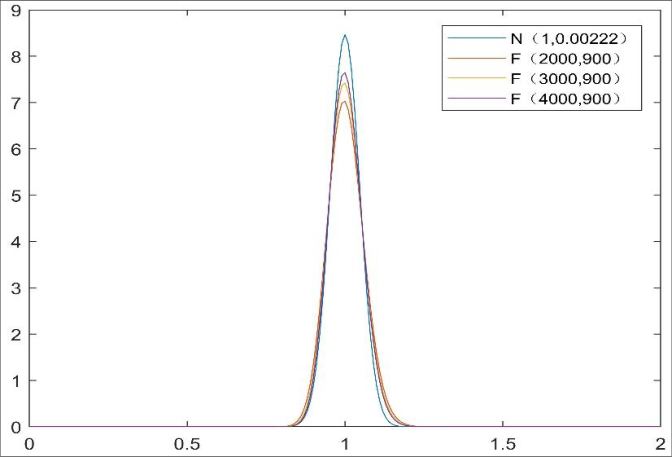 Figure 3
Introduction
The three major sampling distributions occupy an important position in probability theory and mathematical statistics, and are often used in estimation and inference problems such as hypothesis testing, interval estimation, and analysis of variance. They are all evolved from the normal distribution, and finally belong to the normal. However, most of the textbooks do not explain the relationship between the three distributions in detail. This article summarizes and analyzes the three distributions based on the knowledge learned, highlighting their connection with the normal distribution and proving that they are all under certain conditions. Converge to the normal distribution, and perform MATLAB verification at the same time. With such a relationship, some more complex distributions can be transformed into normal distributions that are easy to accept and understand, and it is more convenient to operate.
Preliminary knowledge
If a random variable X follows a gamma distribution with a shape parameter of and a scale parameter of , we record it as 𝑋(𝛼, 𝛽) and its probability density function is 𝑋~𝛤(𝛼,𝛽) then its probability density function is
Where 𝛤(𝛼) is the gamma function 𝛤(𝛼) = ∫ 𝑥 𝛼-1 𝑒 -𝑥 ∞ 0 𝑑𝑥 and the moment generating function of the gamma distribution is 𝑀(𝑡) = ( 𝛽 𝛽-𝑡 ) 𝛼 3. Definition and nature of the three major sampling distributions 3.1 chi-square distribution Definition If 𝑍~𝑁(0,1), 𝑋 = 𝑍 2 then 𝑋obey the chi-square distribution with 1 degree of freedom, denoted as 𝑋~𝜒 [1] 2 .The following uses the moment generating function to analyze the relationship between chi-square distribution and 𝛤 distribution:
The derivative of the distribution function can be obtained:
=
It is not difficult to find that the above formula happens to be the probability density function of 𝛤(
), so 𝑀 𝑋 (𝑡) = (1 -2𝑡) -1 2 , which is written as 𝑋~𝜒 [1] 2 .
Nature 1: Additivity of chi-square distribution
If 𝑍 1 , 𝑍 2 , . . . , 𝑍 𝑛 is an independent random variable, and
, then 𝑋~𝜒 (𝑛) 2 Prove: Using moment generating function and independence be obtained:
), at this time we record as 𝑋~𝜒 (𝑛) 2
Nature 2: Chi-square distribution asymptotically normal distribution When 𝑍 𝑖 2 ~𝜒(1) 2 , we can know 𝑍 𝑖 2 ~𝛤(
), according to the expected variance calculation formula of the gamma distribution, we can get:
According to the central limit theorem, for any x , the distribution function
√𝑉𝑎𝑟(𝑍 𝑖 2 )𝑛 ≤ 𝑥} the following formulas are all established
The theorem states that when n approaches infinity, the random variable
, and because of ∑ 𝑍 𝑖 2 ~𝜒(𝑛) . This formula can be used to solve the values of some of the quartile not listed on the F distribution table ( represents the upper quartile). Nature 4: When x is greater than or equal to zero, F distribution will converge to 𝑁(1, 2 𝑛 ).
Prove When x is greater than or equal to zero, the density function of the F distribution is known as follows: ).
In summary, when n and m tends to infinity, 𝐹(𝑚, 𝑛) converges to 𝑁(1,
𝑛
𝑛
MATLAB drawing verification Fig 3:
The 𝐹 distribution converges to normal distribution
Conclusion
In this paper, through the learned knowledge, with the help of gamma distribution, characteristic function, and central limit theorem, it is proved that the three distributions converge to the normal distribution under certain conditions. It can be seen that the normal distribution plays an important role in mathematical statistics. When the sample size is large, We can use the normal distribution to approximate the three sampling distributions, and use mathematical software to verify. By further summarizing, studying multiple proof methods for one property is very helpful for understanding the relationship between the three distributions.
Figures and tables from the paper
References
4 in the original paper- Sri Guleng. The role of feature function [J] Inner Mongolia Normal University News. 2000; (2):33-37.
- Zeng Zhen, Zhang YU. The relationship between the chi-square distribution, t distribution, F distribution and the normal distribution [J] Journal of Hubei Normal University. 2015; 35(3):62-66.
- Zhou Wei. The relationship between the chi-square distribution, t distribution and F distribution,(Engineering Mathematics [M]. 1992; 8(2):93-95.
- Li Kaican, Meng Zhaoling. Uniform asymptotic normality of the chi-square distribution, t distribution and F distribution [J] Journal of Beijing Institute of Printing Technology. 2004; 12(3):30-33.