
Research article · 2021 · Full text
International Journal of Horticulture and Food ScienceInfluence of maternal breastfeeding practices on the anthropometric status of their infants (0-12 months) in Arochukwu L.G.A Abia State, Nigeria
Volume 3(1) · Pages 39–45 · DOI: 10.33545/26631067.2021.v3.i1a.60 ↗
Research areasBreastfeeding Practices and InfluencesChild Nutrition and Water AccessInfant Nutrition and Health
Abstract
Author-writtenBackground: Breast milk remains the best start to life in all areas of infants’ development. Cow milk is best for cows and human breast milk is best for human babies.Objectives: This study assessed the influence of maternal breastfeeding practices on the anthropometric status of their infant (0-12 months) in Arochukwu L.G.A. Abia State.Methods: A total of 250 mothers were selected using simple random sampling technique. Data on socio-economic/demographic characteristics, knowledge, attitude and practice of mothers towards exclusive breastfeeding, factors that influence maternal breastfeeding. Anthropometric measurements of weight and height were taken using standard procedures. The IBM SPSS version 20 was used to analyze the data. WHO anthro was used to compute anthropometric status of children.Results: About 38.4% of the mothers were aged between 20-24 years. Majority of the mothers (62.5%) were married. About 73.2% of the mothers earned below ₦20, 000 monthly. About 42.4% of mothers exclusively breastfed their babies while about 33.2% of the children were initiated to breast milk within 30 mins after birth. About 42.4% of the mothers breastfed their babies for about 0-6 months before introducing complementary foods. Half of the mothers (53.6%) had a good knowledge on exclusive breastfeeding; 41.2% had poor knowledge, while a few (5.2%) had an excellent knowledge. About 33.6% of the mothers fed their babies with infant formula, while 24.8% fed their babies with breast milk after delivery. Majority (71.2%) fed their children 3-4 times daily. More than half of the infants (56.8%) were stunted, 40.4% were underweight and 15.2% wasted. The prevalence of stunting and wasting was higher in males than in females; wasting was more among 7-9 months old children. Conclusion: The high levels of malnutrition in this study underline the great need for nutrition intervention. Exclusive breastfeeding and timely introduction of appropriate complementary feeding is a key factor in child growth.
Summary
Source-checkedPlain-language reading of the full paper, prepared with AI and checked against the text. Each point links to the authors' own words.
Why it matters
- Breast milk is considered the optimal start for all aspects of an infant's development. View evidence ↗
- Inadequate breastfeeding or premature introduction of bottle and complementary foods can lead to higher infection rates and malnutrition, negatively impacting an infant's physical growth measurements. View evidence ↗
The question
- The study aimed to evaluate how maternal breastfeeding practices affect the anthropometric status of infants aged 0-12 months in Arochukwu L.G.A., Abia State, Nigeria. View evidence ↗
What they did
- The study included 250 mothers and their infants, selected from four communities during immunization days at health centers. View evidence ↗
- Infant anthropometry was measured using a Salter scale for weight, a crown-heel board for length, and non-stretch fiberglass tape for head and mid-upper arm circumference. View evidence ↗
- Nutritional status was classified using WHO (2006) growth standard z-scores for weight-for-age, height-for-age, weight-for-height, and MUAC. View evidence ↗
What they found
- Approximately 42.4% of the mothers in the study practiced exclusive breastfeeding. View evidence ↗
- Regarding knowledge of exclusive breastfeeding, 53.6% of mothers had good knowledge, 41.2% had poor knowledge, and 5.2% had excellent knowledge. View evidence ↗
- The study found high rates of malnutrition: 56.8% of infants were stunted, 40.4% were underweight, and 15.2% were wasted. View evidence ↗
- Malnutrition was more prevalent in males, with stunting at 58.9% (vs 52% in females) and wasting at 16% (vs 14.9% in females). View evidence ↗
- Stunting was particularly severe in the youngest infants, affecting 82.1% of those aged 0-3 months. View evidence ↗
- Wasting was most common among infants aged 7-9 months, occurring in 43.5% of that group. View evidence ↗
- Infants aged 4-6 months had the highest prevalence of being underweight at 88.3%. View evidence ↗
What it means
- The authors conclude that the high levels of malnutrition observed indicate a critical need for nutritional interventions. View evidence ↗
- The authors recommend increasing education for women of reproductive age regarding the importance of exclusive breastfeeding and the subsequent introduction of adequate complementary foods. View evidence ↗
Visual summary
1 visualsIllustrations explain the paper; charts are replotted from the paper's own table values.
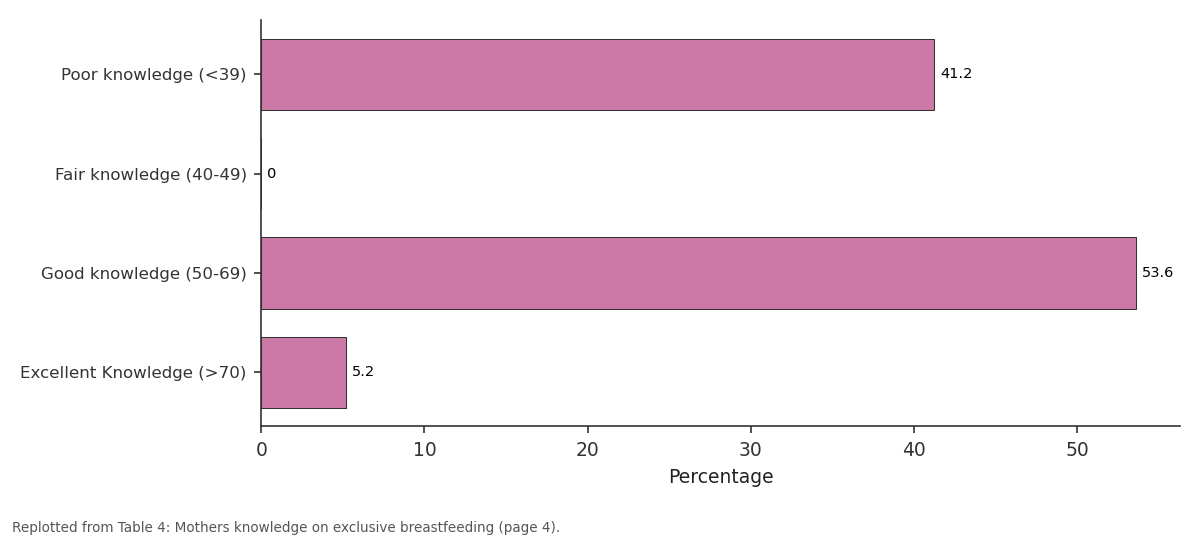
Percentage: Poor knowledge (<39) vs Fair knowledge (40-49) vs Good knowledge (50-69) vs Excellent Knowledge...
Replotted from Table 4 (page 4) of the original paper. Every bar is the paper's own table value.
View source evidence ↗Figures & tables
From the original paper Table 1
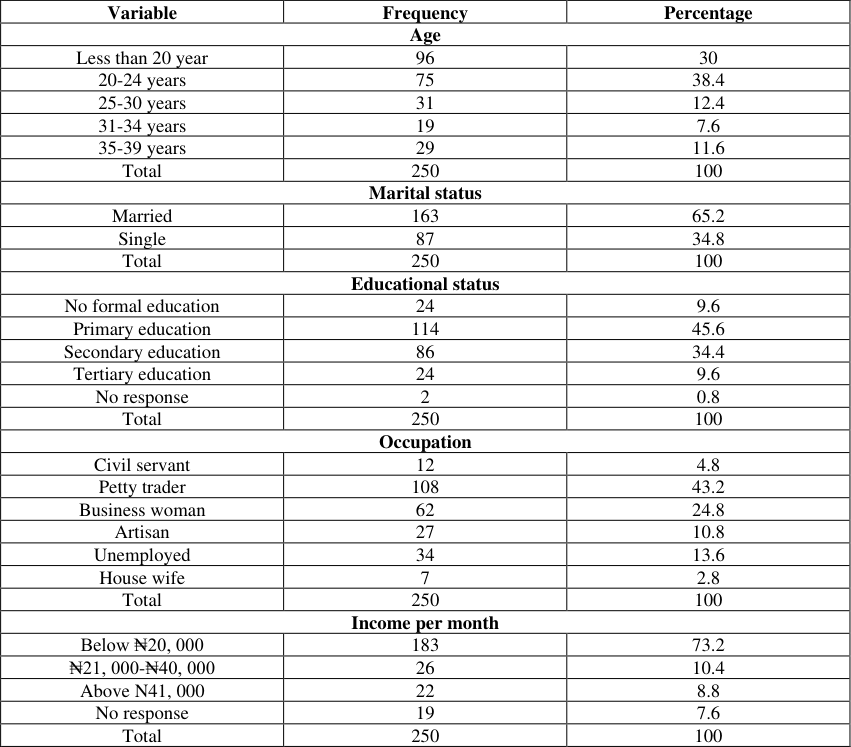 Table 3
 Table 2
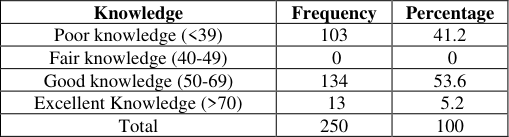 Table 4
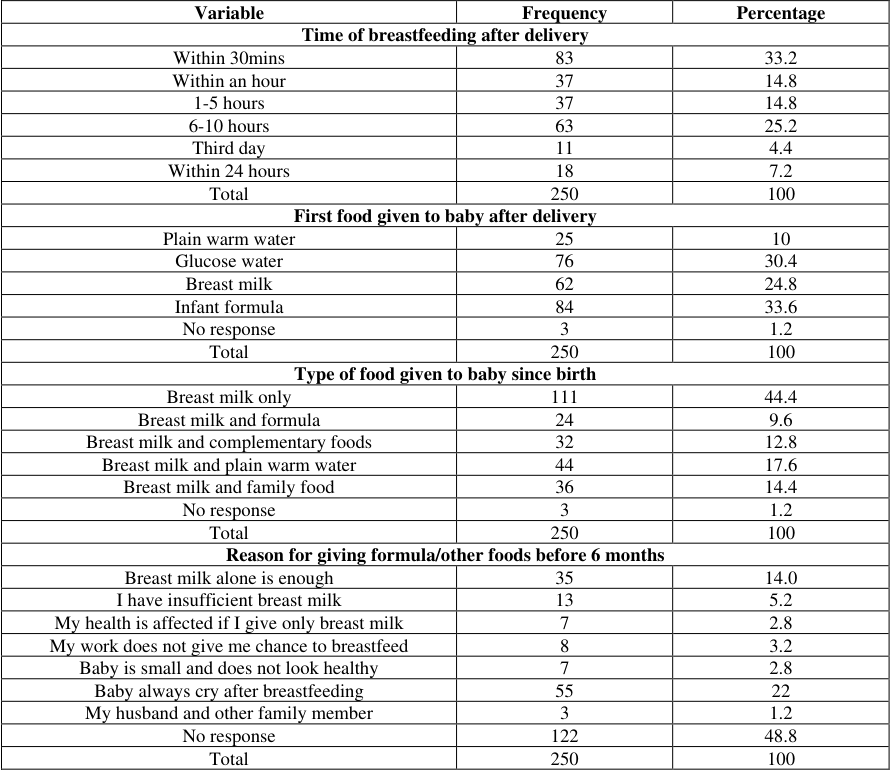 Table 5
 Table 5
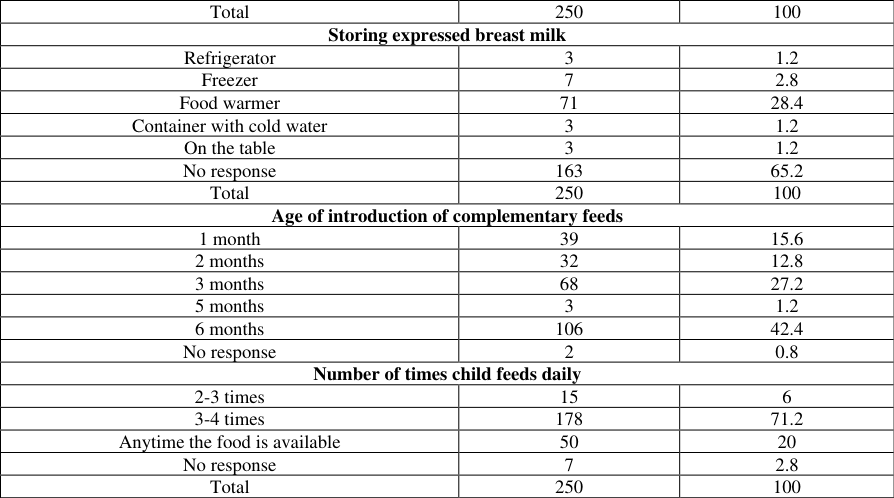 Table 6
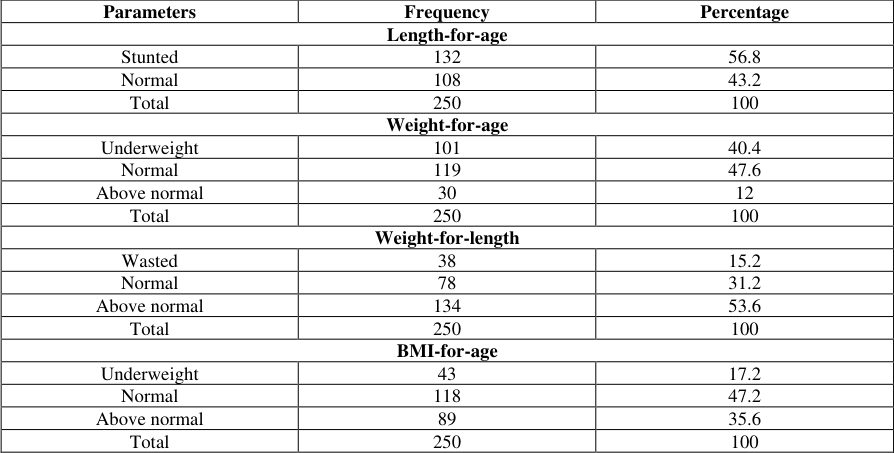 Table 6
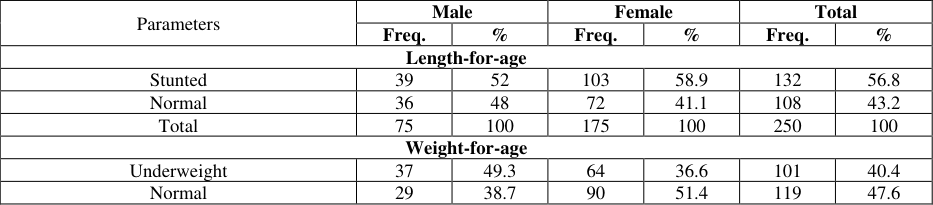 Table 7
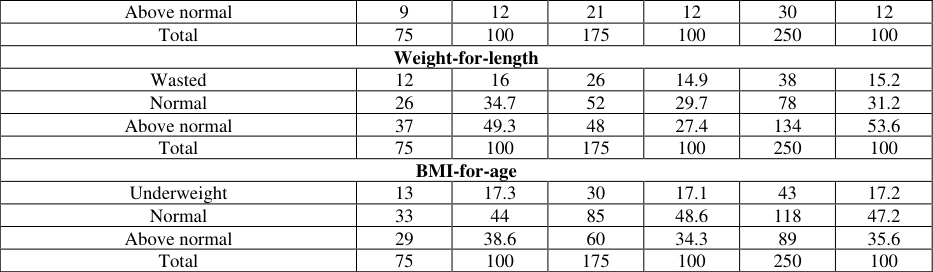 Table 8
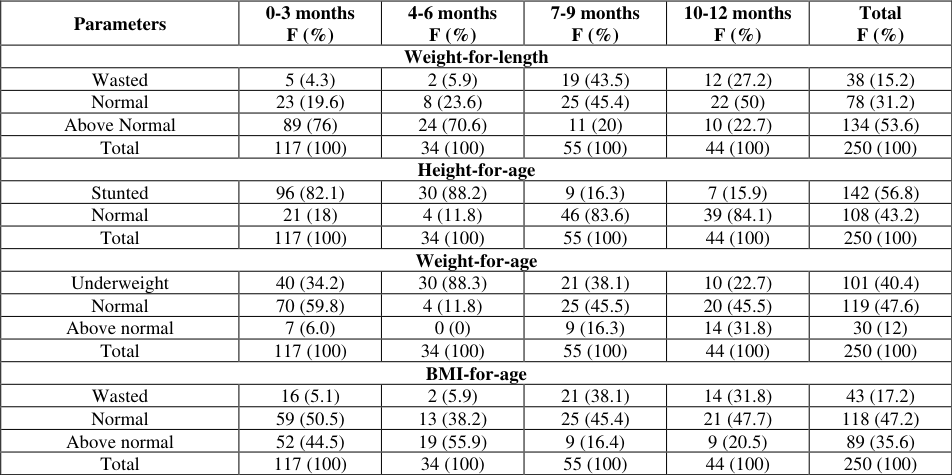 Table 8
Introduction
Breastfeeding is feeding an infant or young child with breast milk directly from human breast. Breastfeeding is an unequal way of providing food for the healthy growth and development of infants. Breastfeeding is very useful both for the child and the mother. For the child, the breast milk is easy to digest; it is the most complete form of nutrition for the infants (WHO, 2007) [15] . Exclusive breastfeeding based on the WHO (2004) [16] definition refers to the practice of feeding only breast milk (including expressed breast milk) for six months. Breastfeeding should be initiated within the first hour after birth. Exclusive breast feeding reduces infant mortality due to common childhood illness such as diarrhea or pneumonia and makes for a quicker recovery during illness. In Nigeria, breastfeeding practices continue to fall well below the WHO/UNICEF recommendations. For instant, current percentage of children who are breastfed exclusively in Nigeria is 17% (UNICEF, 2015) [14] . Various factors associated with sub-optional breastfeeding practices have been identified in various settings; these include maternal characteristics such as age, mental status, occupation, educational level, antenatal and maternity health care; partner or friend family, fear of inadequate milk supply (UNICEF, 2008) [12] . Successful breastfeeding requires adequate nutrition, rest and support of all who care about the well-being of mother and infants. Breast milk remains the best start to life in all areas of infant development (UNICEF, 2008) [12] . Breast milk alone is the ideal nourishment for infants for the first 6 month of life, providing all the nutrients including vitamins and minerals an infant needs at this period of life.
Human milk contains many immunological agents that protect infants against variety of infections. Poor infant feeding practices particularly inadequate breastfeeding or early shift to bottle and complementary feeding is associated with high rate of infection and malnutrition resulting in undesirable anthropometric profile in infants and children. Anthropometric measurements are useful criteria for assessing nutritional status. It is one of the simplest and cost effective methods of assessment of growth and development especially in infants and children. Anthropometric measurements are concerned with the measurements of the variation of physical dimensions. Certainly, physical dimensions of the body are much influenced by nutrition particularly in the rapid growing period of infancy (Kamla, 2005) [6] . Anthropometry has become the conventional practical tool for evaluating the nutritional status of infants and children in Nigeria. The global initiative to promote exclusive breastfeeding is still a concern in Nigeria. Thus this paper focused on the influence of maternal breastfeeding practices on the anthropometric status of their infants (0-12 months) in Arochukwu L.G.A Abia State, Nigeria.
Materials and Methods
Materials and Methods
Study design
The study was a cross sectional survey designed to establish influence of maternal breastfeeding practices on the anthropometric status of their infants (0-12 months).
Study area
This research was carried out in Arochukwu Local Government Area of Abia State. The local government headquarters is in Arochukwu which is a small town located at the Southern end of Abia State, Nigeria. The Local Government Area comprises of four communities and 88 autonomous villages making up Arochukwu L.G.A.
Sample population
The study comprised the infants and their mothers attending health centers in Arochukwu Local Government Area of Abia State.
Sample size
The sample size was calculated using the formula; Z = Standard normal deviate which is 1.96 for 95% confidence interval. P = Percentage of nursing mothers practicing exclusive breastfeeding. P will be taken to be 17% (UNICEF, 2015) [14] . X = Width of confidence or required precision levels taken to be 5%. n = Sample size.
Sample size was rounded up to 250 to make up for dropouts and incorrectly filled questionnaires.
Sampling and sample technique
There are four communities in Arochukwu. Purposive sampling technique was used to select 250 children and their mothers from the four communities on their immunization days at their health care centers.
Data collection
Pretested, validated questionnaires were administered to consenting women by trained interviewers during post natal clinic sessions in the selected health centers. The questionnaire contained questions on socio-demographic characteristics of the women, personal data, knowledge and practice of mothers towards breastfeeding, factors that affect maternal breastfeeding and infant anthropometry. The children were weighed using the special child weighing scale (Salter scale). The scale's balance indicator was checked to ensure that the scale was balanced. The child was undressed with the help of the mother\care-giver. The child was laid safely in the centre of the weighing scale. The reading was taken to the nearest 0.1kg and recorded. The recumbent length was obtained using a crown-heel length board. Shoes, stockings and hats were removed and heirs flatten. The child was laid flat on his back on the measuring board; the child's head was located at the end with fixed headpiece and the child's eyes facing upwards. The child's trunk and legs were aligned. Both legs were extended by placing one hand on the knees to obtain full extension. The foot piece was brought firmly against the child's heels, pointing the toes upwards. The reading was taken to the nearest 0.1cm and recorded. The Head circumference was obtained using a non-stretch fibre glass tape. The child was made to sit on the mother's lap to hold the child's head still. A non-stretch fibre glass tape was placed horizontally around the head at a level just above the eyeball (supralorbital), the ears and the prominent bulge at the back of the head. The tape was tightened over the fore-head but not to compress soft tissues. Then the reading was taken to the nearest 0.1cm and then recorded. Mid upper arm circumference (MUAC) was obtained by Sitting the child on the mother's lap, the child was undressed. The left hand was removed and hanged freely. A non-stretch fibre glass tape was placed around the left arm midway between the acromion process of the scapula and the olecranon process of the ulna. The reading was taken to the nearest 0.1cm and recorded.
Data and statistical analysis
The classification of the children into MUAC, weight-forage, height-for-age and weight-for-height anthropometric indicator was calculated using z-scores by WHO (2006) growth standard. The variables were coded as; Knowledge was scored and categorized using grades as shown below: Information gathered from the questionnaire was coded and entered into the computer using Statistical package for the social sciences (SPSS), version 20. A descriptive statistical method such as frequency and percentage was used to analyze data on socio-economic, knowledge, attitude and feeding practices. Pearson's correlation coefficient was used to determine relationship between the parental knowledge, attitude and feeding practices and nutritional status of the children.
Result
Table 3 shows the socio-economic characteristics of mothers. About 30% of the mothers were less than 20 years, 38.4% were between 20-24 years while 12.4% were between 25-30 years. Most of the women (64.2%) were married while the remaining 34.8% were single. About a quarter of the women (45.6%) had primary education as their highest educational qualification, while 34.4% had secondary education only. Only a few (9.8%) had tertiary education. Furthermore, 43.2% of the women were petty traders while 24.8% and 13.6% were business women and unemployed respectively. More than half of the women (73.2%) earned below ₦20, 000 per month, 10.8% earned between ₦21, 000-₦40, 000 per month, while a few (8.8%) earned above ₦40, 000 per month. Table 4 shows the knowledge on exclusive breastfeeding by the mothers. Half of the mothers (53.6%) had a good knowledge on exclusive breastfeeding; about a quarter (41.2%) had poor knowledge, while a few (5.2%) had an excellent knowledge on exclusive breastfeeding. Table 5 shows the mothers' practices on exclusive breastfeeding. About 33.2% breastfed their baby within 30mins after delivery, 25.2% within 6-10 hours after delivery, 14.8% within 1-5 hours, 7.2% within 24 hours. About 33.6% of the mothers said infant formula was the first food they fed their baby after delivery, 30.4% gave glucose water, while 10% gave plain warm water. About 44.4% of the mothers said they have continued giving only breast milk to their babies, 17.6% said breast milk and plain warm water, 14.4% said breast milk and family food and a few (9.6%) said breast milk and formula. However, 22% of the mothers said the reason of giving formula and other foods before 6 months is because their babies always cries after breastfeeding. About 38% of the women expressed their breast milk when they left home for some hours, 16.8% use family food while 10.4% gave infant formula to their children when left for some hours at home. Furthermore, 28.4% of the women that used expressed breast milk stored the expressed breast milk using a food warmer while 2.8% used freezer. The results further showed that about 42.4% of the women introduced other foods to their babies from 6 months and above, 27.2% at 3 months and 15.6% at 1 month. Thirty-six percent of the women breastfed their children for 12-13 months. Majority of the women (71.2%) fed their children 3-4 times daily. Table 7 shows the anthropometric measurement of the children by sex. The prevalence of stunting was higher in males (58.9%) than females (52%). The result also revealed that the prevalence of wasting was higher in males (16%) than in females (14.9%). Also, 40.4% of the children which comprised of 49.3% males and 36.6% females were underweight. Furthermore, the result revealed that 17.3% males and 17.1% females were underweight going by their BMI-for-age. Table 8 shows the anthropometric measurements of the infants by age. Majority of the infants (76%) between the ages of 0-3 months had above normal weight for their length, while 43.5% of them between 7-9 months were wasted. In their height-for-age z-scores, majority (82.1%) of the infants between the ages of 0-3 months were stunted. About 34.2% of the infants between 0-3 months and 4-6 months (88.2%) were underweight. About 50.5% of infants between 0-3 months that had normal BMI-for-age.
| Parameters | 0-3 months F (%) | 4-6 months F (%) | 7-9 months F (%) | 10-12 months F (%) | Total F (%) |
|---|---|---|---|---|---|
| Weight-for-length | |||||
| Wasted | 5 (4.3) | 2 (5.9) | 19 (43.5) | 12 (27.2) | 38 (15.2) |
| Normal | 23 (19.6) | 8 (23.6) | 25 (45.4) | 22 (50) | 78 (31.2) |
| Above Normal | 89 (76) | 24 (70.6) | 11 (20) | 10 (22.7) | 134 (53.6) |
| Total | 117 (100) | 34 (100) | 55 (100) | 44 (100) | 250 (100) |
| Height-for-age | |||||
| Stunted | 96 (82.1) | 30 (88.2) | 9 (16.3) | 7 (15.9) | 142 (56.8) |
| Normal | 21 (18) | 4 (11.8) | 46 (83.6) | 39 (84.1) | 108 (43.2) |
| Total | 117 (100) | 34 (100) | 55 (100) | 44 (100) | 250 (100) |
| Weight-for-age | |||||
| Underweight | 40 (34.2) | 30 (88.3) | 21 (38.1) | 10 (22.7) | 101 (40.4) |
| Normal | 70 (59.8) | 4 (11.8) | 25 (45.5) | 20 (45.5) | 119 (47.6) |
| Above normal | 7 (6.0) | 0 (0) | 9 (16.3) | 14 (31.8) | 30 (12) |
| Total | 117 (100) | 34 (100) | 55 (100) | 44 (100) | 250 (100) |
| BMI-for-age | |||||
| Wasted | 16 (5.1) | 2 (5.9) | 21 (38.1) | 14 (31.8) | 43 (17.2) |
| Normal | 59 (50.5) | 13 (38.2) | 25 (45.4) | 21 (47.7) | 118 (47.2) |
| Above normal | 52 (44.5) | 19 (55.9) | 9 (16.4) | 9 (20.5) | 89 (35.6) |
| Total | 117 (100) | 34 (100) | 55 (100) | 44 (100) | 250 (100) |
Table text extracted from the original PDF; superscript letters are shown inline. The original table image is below.
View original table image
| Above normal | 9 | 12 | 21 | 12 | 30 | 12 |
|---|---|---|---|---|---|---|
| Total | 75 | 100 | 175 | 100 | 250 | 100 |
| Weight-for-length | ||||||
| Wasted | 12 | 16 | 26 | 14.9 | 38 | 15.2 |
| Normal | 26 | 34.7 | 52 | 29.7 | 78 | 31.2 |
| Above normal | 37 | 49.3 | 48 | 27.4 | 134 | 53.6 |
| Total | 75 | 100 | 175 | 100 | 250 | 100 |
| BMI-for-age | ||||||
| Underweight | 13 | 17.3 | 30 | 17.1 | 43 | 17.2 |
| Normal | 33 | 44 | 85 | 48.6 | 118 | 47.2 |
| Above normal | 29 | 38.6 | 60 | 34.3 | 89 | 35.6 |
| Total | 75 | 100 | 175 | 100 | 250 | 100 |
Table text extracted from the original PDF; superscript letters are shown inline. The original table image is below.
View original table image
| Parameters | Male | — | Female | — | Total | — |
|---|---|---|---|---|---|---|
| Freq. | % | Freq. | % | Freq. | % | |
| Length-for-age | ||||||
| Stunted | 39 | 52 | 103 | 58.9 | 132 | 56.8 |
| Normal | 36 | 48 | 72 | 41.1 | 108 | 43.2 |
| Total | 75 | 100 | 175 | 100 | 250 | 100 |
| Weight-for-age | ||||||
| Underweight | 37 | 49.3 | 64 | 36.6 | 101 | 40.4 |
| Normal | 29 | 38.7 | 90 | 51.4 | 119 | 47.6 |
Table text extracted from the original PDF; superscript letters are shown inline. The original table image is below.
View original table image
| Variable | Frequency | Percentage |
|---|---|---|
| Method of feeding when baby is left at home | ||
| Infant formula | 26 | 10.4 |
| Expressed breast milk | 95 | 38 |
| Pap and other cereal gruel | 37 | 14.8 |
| Family food | 42 | 16.8 |
| No response | 50 | 20 |
Table text extracted from the original PDF; superscript letters are shown inline. The original table image is below.
View original table image
| Variable | Frequency | Percentage |
|---|---|---|
| Time of breastfeeding after delivery | ||
| Within 30mins | 83 | 33.2 |
| Within an hour | 37 | 14.8 |
| 1-5 hours | 37 | 14.8 |
| 6-10 hours | 63 | 25.2 |
| Third day | 11 | 4.4 |
| Within 24 hours | 18 | 7.2 |
| Total | 250 | 100 |
| First food given to baby after delivery | ||
| Plain warm water | 25 | 10 |
| Glucose water | 76 | 30.4 |
| Breast milk | 62 | 24.8 |
| Infant formula | 84 | 33.6 |
| No response | 3 | 1.2 |
| Total | 250 | 100 |
| Type of food given to baby since birth | ||
| Breast milk only | 111 | 44.4 |
| Breast milk and formula | 24 | 9.6 |
| Breast milk and complementary foods | 32 | 12.8 |
| Breast milk and plain warm water | 44 | 17.6 |
| Breast milk and family food | 36 | 14.4 |
| No response | 3 | 1.2 |
| Total | 250 | 100 |
| Reason for giving formula/other foods before 6 months | ||
| Breast milk alone is enough | 35 | 14.0 |
| I have insufficient breast milk | 13 | 5.2 |
| My health is affected if I give only breast milk | 7 | 2.8 |
| My work does not give me chance to breastfeed | 8 | 3.2 |
| Baby is small and does not look healthy | 7 | 2.8 |
| Baby always cry after breastfeeding | 55 | 22 |
| My husband and other family member | 3 | 1.2 |
| No response | 122 | 48.8 |
| Total | 250 | 100 |
Table text extracted from the original PDF; superscript letters are shown inline. The original table image is below.
View original table image
| Knowledge | Frequency | Percentage |
|---|---|---|
| Poor knowledge (<39) | 103 | 41.2 |
| Fair knowledge (40-49) | 0 | 0 |
| Good knowledge (50-69) | 134 | 53.6 |
| Excellent Knowledge (>70) | 13 | 5.2 |
| Total | 250 | 100 |
Table text extracted from the original PDF; superscript letters are shown inline. The original table image is below.
View original table image
| Variable | Frequency | Percentage |
|---|---|---|
| Age | ||
| Less than 20 year | 96 | 30 |
| 20-24 years | 75 | 38.4 |
| 25-30 years | 31 | 12.4 |
| 31-34 years | 19 | 7.6 |
| 35-39 years | 29 | 11.6 |
| Total | 250 | 100 |
| Marital status | ||
| Married | 163 | 65.2 |
| Single | 87 | 34.8 |
| Total | 250 | 100 |
| Educational status | ||
| No formal education | 24 | 9.6 |
| Primary education | 114 | 45.6 |
| Secondary education | 86 | 34.4 |
| Tertiary education | 24 | 9.6 |
| No response | 2 | 0.8 |
| Total | 250 | 100 |
| Occupation | ||
| Civil servant | 12 | 4.8 |
| Petty trader | 108 | 43.2 |
| Business woman | 62 | 24.8 |
| Artisan | 27 | 10.8 |
| Unemployed | 34 | 13.6 |
| House wife | 7 | 2.8 |
| Total | 250 | 100 |
| Income per month | ||
| Below ₦20, 000 | 183 | 73.2 |
| ₦21, 000-₦40, 000 | 26 | 10.4 |
| Above N41, 000 | 22 | 8.8 |
| No response | 19 | 7.6 |
| Total | 250 | 100 |
Table text extracted from the original PDF; superscript letters are shown inline. The original table image is below.
View original table image
Discussion
Most of the mothers were less than 24 years. It could be that the study area was made up of younger adults, and this is in line with a study by Mohidul et al. (2013) [8] where majority of mothers were aged 20-30 years. This further indicates the peak of fertility, and the age at which ladies commonly marry. Majority of the women had primary education as their highest education followed by secondary education. This shows that the respondents mostly had some level of formal education. Educated mothers are mostly employed and are more likely to mixed feed than exclusively breastfeed in the first six months of their child's life. Most women in this study were into petty trading and business. Mohidul et al. (2013) [8] pointed out that maternal employment may not be a constraint to child care, because mothers modified their work patterns to attend to their young children's need; but their employment status could influence child's feeding. More than half of the women (73.2%) earned below ₦20, 000 per month. This study is consistent with the findings of Ene-Obong et al. (2010) [5] .
Half of the mothers (53.6%) had a good knowledge of exclusive breastfeeding; about a quarter (41.2%) had poor knowledge of exclusive breastfeeding. This result did not support the 19.2% reported by Mo Oche and Amed. (2011) [7] in Plateau State. Poor knowledge of exclusive breastfeeding is a great barrier to the practice of exclusive breastfeeding. The perceived poor knowledge of respondents on exclusive breastfeeding could partly be attributed to the quality of information transferred to them, not all health care providers have enough knowledge about breastfeeding to inform or help women who are encountering difficulties. About 33.2% breastfed their baby within 30mins after delivery, while 14.8% breastfed within 1-5 hours after delivery. A similar finding was reported in a study of lactating mothers in Ile Ife Osun State, Nigeria where more than 50% of the lactating mothers said the time of initiation of breast milk after delivery was within 30mins (Ojofeitimi, 2000) [10] . The importance of breast feeding initiation within 30 minutes of delivery cannot be overemphasized. It has been shown to reduce neonatal morbidity and mortality. About 44.4% of the mothers said they have been giving only breast milk to their babies. This indicates that 44.4% of the women practiced exclusive breastfeeding. About 38% of the women expressed their milk for their babies to be fed when they were not at home. Expressing breast milk is important when direct breastfeeding of the baby from the mother is not possible either because the mother is away from the baby or in some health cases (Safaa, 2012) [11] . About 42.4% of the women introduced other foods to their babies from 6 months and above. This perceived time of introduction of complementary food could be attributed to their knowledge, practice and attitude of exclusive breastfeeding. This is in line with the UNICEF (2009) [13] recommendation that breast milk alone is the ideal nourishment for infant for the first six months of life because it provides all the nutrients including vitamins and minerals an infant needs. One third of the women breastfed their children for 12-13 months. This result is in contrast with Eman, et al. (2016) on the study among working class lactating women in Enugu which showed that 50% of the respondents did not breastfeed up to one year. Optimal breastfeeding for 2 years and beyond provides comforts, enhances child spacing and survival (UNICEF, 2009) [13] . Majority of the women fed their children 3-4 times daily. WHO (2004) [16] suggested that children between 6-8 months and 9-11 months be fed 2-3 times and 3-4 times, respectively. More than half of the infants (56.8%) were stunted. The prevalence of stunting reported in this study was higher than 43% and 41% prevalence reported in Nigeria by NDHS (2013) and UNICEF (2009) [13] respectively. About 40.4% of the infants were underweight, 15.2% wasted. This result was similar to NDHS. (2013); this could be attributed to unhealthy feeding practices by their mothers, thus affecting their healthy growth and development. The finding of this study was comparable with 14% wasting recorded among under-five children in Nigeria by UNICEF (2009) [13] . Prevalence of stunting and underweight in this study was high compared to the report by Ekerette and Olukemi. (2016) [3] . The prevalence of stunting was higher in males than females. In agreement with this study, Danjin and Dawud. (2015) [2] in a study among children 0-12 months in Gombe, Nigeria found that prevalence of stunting was more among the male children compared to the females. The prevalence of wasting was higher in males than in females; this was slightly lower than that reported by Ene-Obong et al. (2010) [5] . Adequate nutrition during infancy and early childhood is essential to ensure the growth, health, and development of children. The low prevalence of wasting among 0-3 months and 4-6 months children in this study concurred with the report by Danjin and Dawud (2015) [2] . High prevalence of wasting among 7-9 months old children in this study could be due to the type of complementary foods given to them as breast milk alone cannot sustain then. Majority (82.1%) of the infants within the age of 0-3 months were stunted. Level of stunting at this age in month could be regarded a serious public health problem; it is noteworthy that children who are deprived of nutrients for healthy growth are also deprived of nutrients for healthy brain development and healthy immune systems (Amsalu and Tigabu, 2008) [1] . Infants between 4-6 months were the most underweight; the observed underweight status of the infants at this age could be attributed to early introduction of complementary food by their care givers.
Conclusion
The high levels of under-nutrition in this study points to the need for nutrition intervention. Exclusive breast feeding and timely introduction of appropriate complementary feeding is a key factor in child growth and development. The assessment of nutritional status showed that many children were stunted, wasted, and underweight and this may be as a result of poor feeding, inadequate complementary feeding practices and poor economic status of their parents. There is need for more education focused on women of reproductive age on the importance of exclusive breastfeeding, followed by adequate complementary feeding.
Figures and tables from the paper
| z scores | Height for age | Weight for age | Weight for height | BMI for age |
|---|---|---|---|---|
| 3 | Excessive tall | Obese | Obese | Obese |
| 2 | Normal | Overweight | Overweight | Overweight |
| 1 | Normal | At risk | At risk | At risk |
| 0 | Normal | Normal | Normal | Normal |
| -1 | Normal | Normal | Normal | Normal |
| -2 | Stunted | Underweight | Wasted | Underweight |
| -3 | Severely Stunted | Severely underweight | Severely wasted | Severely underweight |
Table text extracted from the original PDF; superscript letters are shown inline. The original table image is below.
View original table image
| Total | 250 | 100 |
|---|---|---|
| Storing expressed breast milk | ||
| Refrigerator | 3 | 1.2 |
| Freezer | 7 | 2.8 |
| Food warmer | 71 | 28.4 |
| Container with cold water | 3 | 1.2 |
| On the table | 3 | 1.2 |
| No response | 163 | 65.2 |
| Total | 250 | 100 |
| Age of introduction of complementary feeds | ||
| 1 month | 39 | 15.6 |
| 2 months | 32 | 12.8 |
| 3 months | 68 | 27.2 |
| 5 months | 3 | 1.2 |
| 6 months | 106 | 42.4 |
| No response | 2 | 0.8 |
| Number of times child feeds daily | ||
| 2-3 times | 15 | 6 |
| 3-4 times | 178 | 71.2 |
| Anytime the food is available | 50 | 20 |
| No response | 7 | 2.8 |
| Total | 250 | 100 |
Table text extracted from the original PDF; superscript letters are shown inline. The original table image is below.
View original table image
| Parameters | Frequency | Percentage |
|---|---|---|
| Length-for-age | ||
| Stunted | 132 | 56.8 |
| Normal | 108 | 43.2 |
| Total | 250 | 100 |
| Weight-for-age | ||
| Underweight | 101 | 40.4 |
| Normal | 119 | 47.6 |
| Above normal | 30 | 12 |
| Total | 250 | 100 |
| Weight-for-length | ||
| Wasted | 38 | 15.2 |
| Normal | 78 | 31.2 |
| Above normal | 134 | 53.6 |
| Total | 250 | 100 |
| BMI-for-age | ||
| Underweight | 43 | 17.2 |
| Normal | 118 | 47.2 |
| Above normal | 89 | 35.6 |
| Total | 250 | 100 |
Table text extracted from the original PDF; superscript letters are shown inline. The original table image is below.
View original table image
References
16 in the original paper- Amsalu S, Tigabu Z. Risk factors for severe acute malnutrition in children under the age of five: A casecontrol study. Ethiopian J Health Develop 2008;1:2125.
- Danjin M, Dawud NU. A survey of nutritional status of children 0-12 months in specialist hospital Gombe, Nigeria. CHRISMED J Health Res 2015;13(2):109114.
- Ekerette EU, Olukemi KA. Complementary feeding practices among mothers and nutritional status of infants in Akpabuyo Area, Cross River State Nigeria 2016;5(1):2073.
- Eman SM, Eman RG, Eptesam EH. Knowledge, Attitude, and Practices of Breastfeeding and Weaning Among Mothers of Children up to 2 Years Old in a Rural Area in El-Minia Governorate, Egypt. Journal of Family Medical Prime Care 2014;3(2):136-140.
- Ene-Obong HN, Davidson GI, Mbah BO, Akah NN. Effect of Mother's Characteristics and Infant Feeding Practices on the Nutritional Status of Children (0-2 years) in a Rural Community in Enugu State, Nigeria 2010, 32-35.
- Kamla R. Anthropometric measurement of Kashmiri Pandit infants. Institute of Home Science, University of Jammu, India 2005;7(2):149-151.
- MO Oche AS, Amed M. Knowledge and practice of EBF in Kwara, Nigeria. Africa Health Science 2011;11(3):518-523.
- Mohidul I, Shahinur R, Kamruzzaman Mominul I, Abdus S. Effect of maternal status and breastfeeding practices on infant nutritional status -a cross sectional study in the south-west region of Bangladesh; The Pan African Medical Journal 2013;16:139.
- Nigeria Demography and Health Survey (NDHS). National Population Commission Federal Republic of Nigeria 2008.
- Ojofeitimi EO. Breastfeeding practices in urban and rural health centre in Ile Ife, Nigeria. Nutrition and Health 2000;4:119-125.
- Safaa A, Mohamed K, Asmaa G, Mohamed EM, Mohamed EM, Abdel K. Knowledge and practices of working mother about breastfeeding and weaning in Assiut city, Egypt. Life Science J 2012;9(1):803-808.
- UNICEF. Maternal and newborn health in Nigeria: Developing strategies to accelerate Progress. The State of World's Children 2008, 19-22.
- UNICEF. The State of the World′s children, United Nations Publication 2009. www.unicef2009/org/sow.
- United Nation Children Fund (UNICEF). State of the World's Children 2015.
- WHO. World Health Organization releases New Child Growth Standard 2007. www.whoint/nutrition/topic/childgrowth.
- WHO. Promoting proper feeding for infants and young children 2004.
Cited by 1
From OpenAlex, OpenCitations and reference lists read by Scinovex
- Assessment of breastfeeding practice of mothers and the Nutritional status of infants (0–12 months) in Ife North Local Government Area, Osun State, Nigeria ↗
Olanike O. Balogun, Olajumoke Precious Olaniran, Precious I Ogunniyi · World Nutrition · 2024
BackgroundAccording to UNICEF, annually 5.4 million Nigerian children are not exclusively breastfed, worsening the nation's chronic malnutrition issue.ObjectiveThis study evaluated the breastfeeding knowledge and practices of mothers and the anthropometric status of breastfed infants in Ife North Local Government Area, Osun State, Nigeria.MethodsIn a community-based cross-sectional study, a multi-staged sampling technique was used to recruit 380 women with infants 0–12…
❝ 0PDF