
Research article · 2019 · Full text
International Journal of Research in AgronomyInfluence of socio-economic characteristics on rural farmers’ food consumption in Ogun state
Volume 2(1) · Pages 17–22 · DOI: 10.33545/2618060x.2019.v2.i1a.13 ↗
Research areasUnemployment and Economic Growth
Abstract
Author-writtenThe study analysed influence of socio-economic characteristics on farmers’ food consumption in Yewa North Local Government Area of Ogun State with a view to providing policy information toward enhancing the nutritional status of Nigeria. The prevalent problem of hunger and malnutrition in developing countries like Nigeria necessitates the development of goals to reduce the number of chronically undernourished people. The challenge of many countries of the world is the problem of food and nutrition security. The survey was achieved through cross sectional data that was collected by employing stratified random sampling on the socio-economic characteristics and consumption expenditure of 120 sampled households of which only 112 questionnaires were relevant for the analysis using descriptive and regression techniques. This study confirmed that 76.8% of the household farmers had average income below N30,000 per month. The household farmer’s expenditure was N4,961.24 and per capital average expenditure was N925.605. This revealed that the level of poverty in the study area is very abnormal and needs urgent attention. Based on these findings, it was recommended that appropriate, achievable and attainable poverty alleviation/income enhancing programmes should be put in place and that income should be redistributed in favour of low-income group to benefit the identified demographic groups which should also be extended to all Nigerians especially the low-income earners.
Summary
Source-checkedPlain-language reading of the full paper, prepared with AI and checked against the text. Each point links to the authors' own words.
Why it matters
- Hunger and malnutrition are widespread problems in developing nations such as Nigeria, creating a need for goals to reduce chronic undernourishment. View evidence ↗
- Food insecurity in Nigeria is both quantitative (shortage of food) and qualitative (lack of essential nutrients like proteins, fats, and vitamins). View evidence ↗
- The quality and quantity of food consumed by households directly impact their health and economic well-being, which subsequently affects overall economic productivity. View evidence ↗
The question
- The study aimed to determine how socio-economic characteristics influence food expenditure among rural farming households in the Yewa North Local Government Area of Ogun State, Nigeria. View evidence ↗
What they did
- Researchers used stratified random sampling to collect cross-sectional data from 120 households, with 112 relevant questionnaires used for the final analysis. View evidence ↗
- Data analysis was performed using descriptive statistics and a Tobit probability regression model to determine the effect of socio-economic characteristics on consumption. View evidence ↗
What they found
- A significant majority (76.8%) of the surveyed household farmers earned an average monthly income of less than N30,000. View evidence ↗
- The average total monthly food expenditure per household was N4,961.24, with a per capita expenditure of approximately N925.605. View evidence ↗
- Food expenditure was dominated by energy-giving foods (54.18%), followed by proteins (32.19%) and vegetables/fruits (13.63%). View evidence ↗
- The Tobit regression analysis indicated that income had a significant negative influence on food expenditure. View evidence ↗
- Increased household size had a positive effect on expenditure for all food items, with significant effects specifically for cassava, cocoyam, and yam flour. View evidence ↗
- Gender did not significantly affect total food expenditure, except for energy-giving foods, where female household heads spent less than male household heads. View evidence ↗
- Education significantly impacted expenditure on animal protein, plant protein, yam flour, and energy-giving foods, but not on vegetables or cereals. View evidence ↗
What it means
- The authors recommend implementing achievable poverty alleviation and income-enhancing programs, including redistributing income to benefit low-income groups. View evidence ↗
- The authors conclude that poor infrastructure, including lack of electricity, credit access, and nutritional knowledge, hinders the attainment of food security for both male and female household heads. View evidence ↗
Visual summary
1 visualsIllustrations explain the paper; they do not show study data.
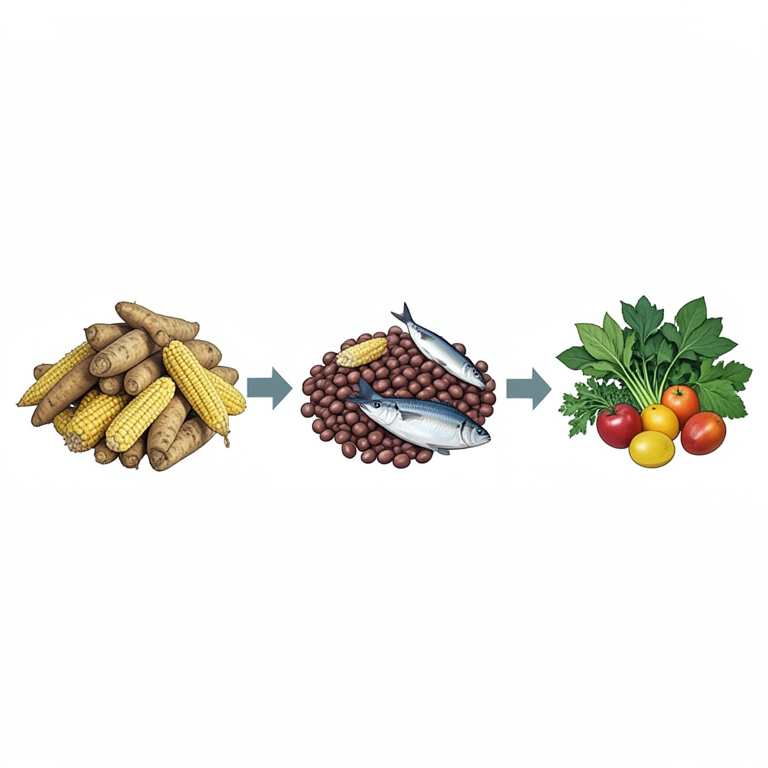
Food Expenditure Distribution
AI-generated conceptual illustration (Rural Nigerian food staples (cassava, maize, beans, fish, leafy greens, and tropical fruits)). It explains the idea and does not show study data.
View source evidence ↗Figures & tables
From the original paper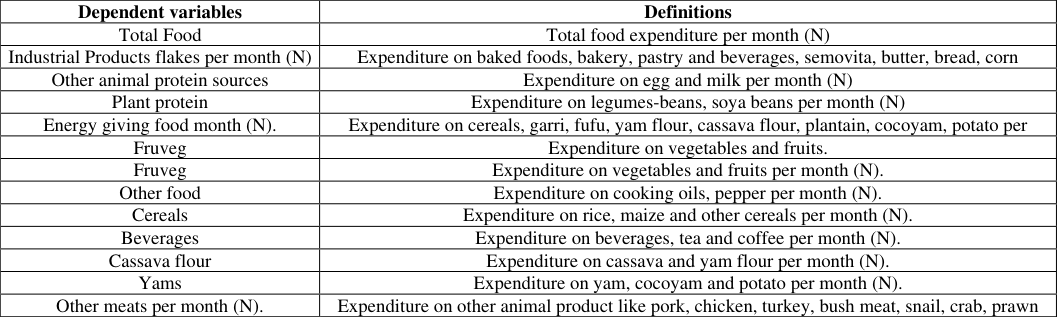 Table 1
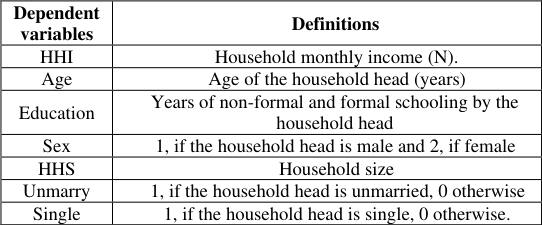 Table 2
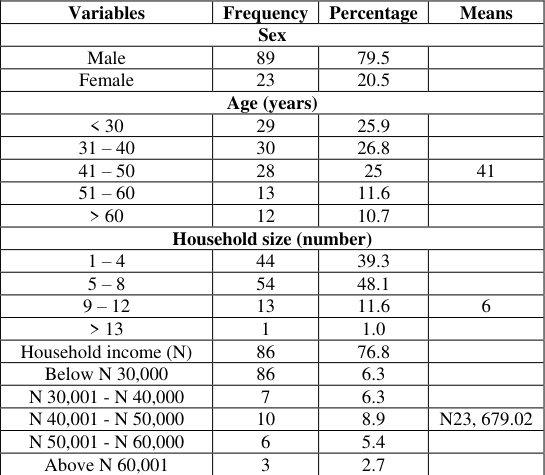 Table 3
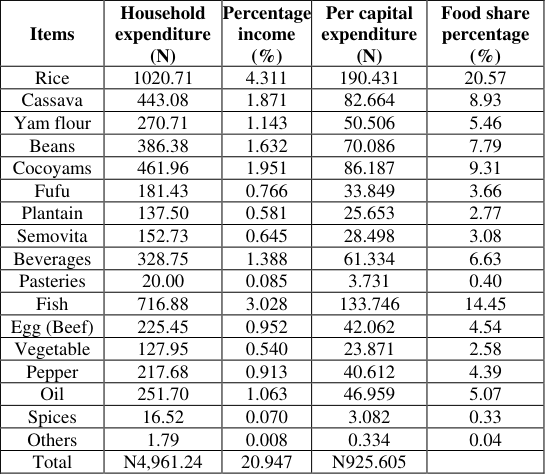 Table 5
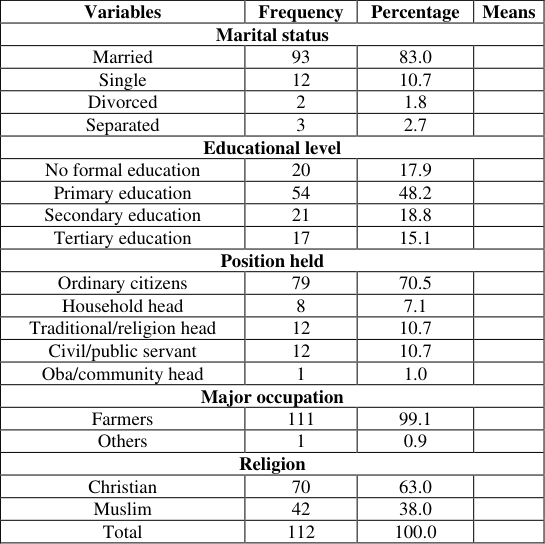 Table 4
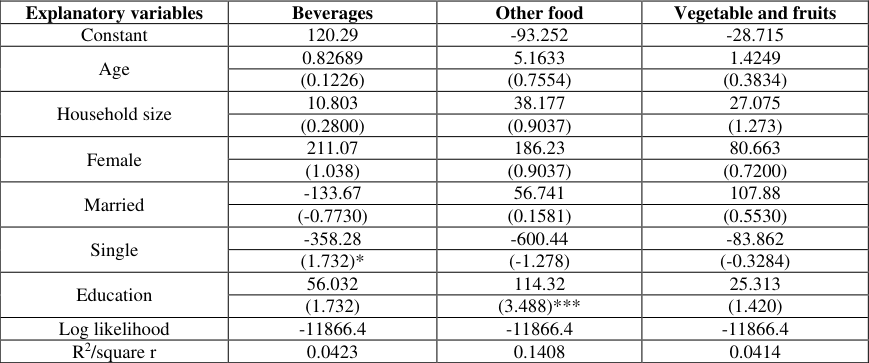 Table 6
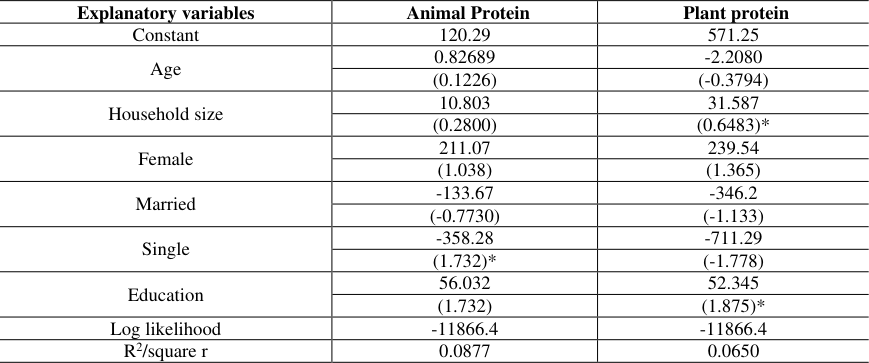 Table 7
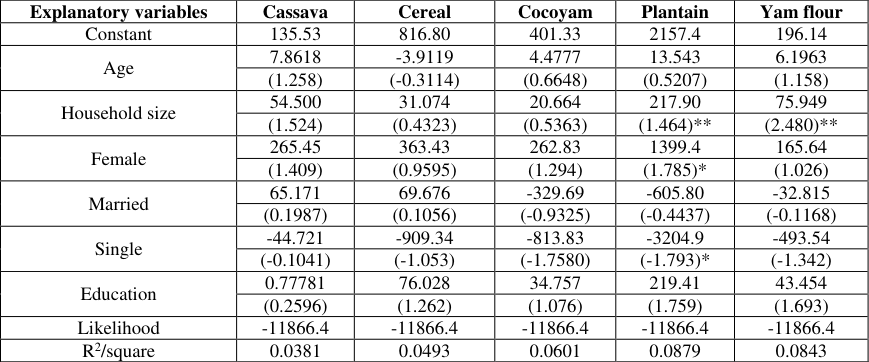 Table 8
Introduction
Food insecurity has become acute (very serious and severe) in Nigeria as increasing number of people are finding it difficult to meet their requirement as well as the nutritional quality of their food intake such as protein, fat, minerals. Food insecurity in Nigeria and many other developing countries is both quantitative and qualitative. The qualitative aspect relates to the inadequacy of food supply to meet the qualitative requirement of consumer in terms of basic nutrients such as protein, fats and oils and essentials vitamins (Olayide, 1998) [9] . The quantitative dimension involves the shortage of the right types of food needed by the body to provide balance diet. Recent nutritional research has led to the development of measuring malnutrition in terms of two energy intake rather than insufficient protein or vitamins intake alone. Energy is provided through carbohydrates, fats, and oil, protein, minerals and of course water. A nutritionally adequate diet is one in which all the necessary nutrients are included in sufficient amounts to meet body needs. These body needs will vary according to the type of activity engaged in, although nutritionists are in agreement as to precisely what human need are under a given set of conditions for maintenance of body functions, growth and activity. The Food and Agricultural Organisation has estimated that the daily protein in takes in Nigeria is 58.8g per caput about 20% less than the minimum level recommended by the organization, thus this low level of protein consumption posed a problem. (Olayide, 1998) [9] reported that protein supply from various food items was estimated to about 58.7% per caput per day as against the minimum 65g per day for an adult. Records of per capital protein intake in Nigeria that 51.7g of protein is taken daily on average out of which only 8.6 is from animal, hence against 35g of daily requirement. The situation is different in developed countries where the protein intake per capital is about 90g with more than 65g of it from animal source. For several reasons food consumption is of interest to the Nigerian economy. First, the volume of food consumed by rural farming households by far represents a large proportion of aggregate from output. This being so, the pattern of food consumption exerts a decisive influence on the level and composition of total agricultural output produced. Second, the quantity and quality of food consumed by households affect their health and economic well-being and these in turn have significant repercussions on the general level of economic activities and productivity. Despite, government efforts to increase food production through the introduction of special agricultural projects in conjunction with the World Bank and other related Agricultural Development Projects (ADPs) such as; Agricultural Development Projects (ADPs) in 1975, Operation Feed the Nation (OFN) in 1976, Green Revolution in 1980, Directorate for Food, Road and Rural Infrastructure (DFRRI) including development policies, like Structural Adjustment Programme, Better Life Programme and Family Support Programme, yet the Nigerian economy still pose the problem of under-nutrition and malnutrition to average Nigerian consumer. An indispensable input in the formulation of food nutrition policy and even in the orientation of agricultural and general economic development plans is information on food consumption pattern of the people. Unfortunately, this information has not always been available and empirical studies of food consumption pattern in the country (e.g. Anthoni and Oni, 1999) [2] have been sparse.
Problem statement
Food security is a fundamental objective of development policy and also a measure of its success. Achieving food security is still a major problem for households in most rural areas of Nigeria, therefore, the associated symptoms of food crisis are found throughout the country, though with differences based on occupation, agro-ecological, socio-economic factors and rural versus urban location (Olarinde and Kuponiyi, 2005) [8] . Durojaiye and Olubanjo (1987) [4] affirmed that food crisis in Nigeria, has two dimensions. First, there is a calorie deficiency in the amount of calories available per person per day and this is short of the requirement, while the second dimension constitutes a much more serious problem which relates to the inability of the available food to supply sufficient nutrient to meet the needs of the body. With this undernourishments and malnutrition, the manifestations of the two dimensions, respectively continue to exist side by side in Nigeria. This situation makes imperative the need to formulate a comprehensive food nutrition policy for the country and to continuously reviewed (Durojaiye and Olubanjo, 1987) [4] .
Objectives of the study
The broad objectives of this study were to determine the influence of socio-economic characteristics of the rural farming household on food expenditure with a focus on income groups among the households in Yewa North Local Government Area, a typical rural town in Ogun State, Nigeria. The specific objectives were; determine the socio-economic characteristics of the households in the study area; determine the per capital household food expenditure according to income group; examine the effect of socio-economic factors on food expenditure of the household in the study area and estimate the marginal propensity to consume for different food items
Research methodology Study area
Research methodology Study area
Data collection and sampling technique
Primary data were collected for the study. A cross-sectional survey of arable crop farmers from the study area was conducted by random selection. The study area was selected for its predominance in arable crops production e.g. rice, maize, yam, cassava, potato, vegetables to mention few. The sampled farmers were selected by a stratified random sampling technique. The Local Government Area was divided into eight (08) strata based on the existing political wards in the area. From each stratum, one (01) adjourning village were randomly selected and 15 households farmers were randomly selected from each village in the stratum making a sample size of one hundred and twenty households (120), the communities were Ayetoro, Ibooro, Ibese, Igbogila, Igan Okoto, Ijoun, Igan Alade and Sala-Orile. However, subsequent data analysis was based on complete responses from one hundred and fourteen (112) farmers.
Method of data analysis
Descriptive statistics such means, standard errors, percentages and frequency table etc., Tobit probability model and regression techniques were employed in the analyses of the study data. The Tobit model was fitted to determine the effect of socioeconomic characteristics on the household consumption. The model was fitted because a number of households reported zero expenditure for some food item and Tobit model proved satisfactory for the stated purposes of this study. The model is specified as;
Where N is the number of observations, Yi is the dependent variable, Xi is a vector of explanatory variables, is a vector of unknown coefficients, while u is an independently distributed error term assumed to be normally distributed with zero mean and constant variance σ 2 (McDonald and Moffit, 1980) [6] .
Mathematically, the empirical model for the study is given by;
Where: yik is the i th household's monthly expenditure on the k th food commodity (or total food); Xij is the value of the j th explanatory variable in the i th household. The operational definitions of the variables in the model are presented in the table below. The parameters of the model were estimated using the Tobit regression procedure in SHAZAM econometric software professional edition). The tobit procedure in SHAZAM is a maximum likelihood estimation of parameters of a transformed model I t = X't α = X't (β/σ) in which the expected value of the latent variable associated with the dependent variable of the original model
White, Wrong and Bates, 2001) [12] . A typical result of tobit regression procedure in SHAZAM generates estimates of the normalized coefficients, α with the associated standard errors and t values as well as standard error of estimate, σ. It also provides among others estimates of the original regression coefficients (β = σα), the predicted probability of Y > limit (p = F(X'α)), the expected value of Y, E(Y), given the average X(1); as well as elasticity of E(Y) for the K th variable, evaluated at the sample means, e k , which Whistler, White, Wrong and Bates (2001) [12] reported is computer as:
Where Y E is the expectation of Y estimated at the mean values as YE = σ (X'α) F(X'α), F is the cumulative normal distribution function and f is the normal density function. While the marginal effect of an explanatory variable is not part of a typical SHAZAM's output, Whistler, White, Wrong and Bates (2001) [12] , observed that this may be computed as;
While several statistics and table were generated from the regression, this study presents only the regression coefficients and the associated asymptotic z-statistics. The marginal effects were estimated, based on equation 4, for an average household as β F(x'α). Other relevant statistics presented includes the predicted probability of a positive expenditure (i.e. y > limit) and expected level of expenditure on each commodity.
Results and Discussion
This chapter presents the analysis, interpretation and discussion of the data collected from the field survey undertaken in April, 2008. It discusses the results and findings that emanated from the use of descriptive statistics such as frequency, percentages, mean, standard deviation, standard errors and Tobit regression analysis. Table 4 and 5 presents the socio-economic characteristics of the respondents. The distribution of farmers by sex revealed that 79.5 percent of the farmers are male while the female farmers are 20.5 percent only. This implies that majority of the farmers are men while the women contributes a less significant role. Majority 78.0% of the respondents' falls within the age category of <30 and 50 and the mean age is 41 years. This implies that majority of the respondents are in their active age. The large percentage (48.2%) of the respondents had between 5 and 8 and the mean household size is 6. This implies that they have more dependent who feed from their low income. Also the large percentage of (76.8%) of the respondents had low income below N30.000.00. It depicts that the level of poverty in the area is very high and it needs government urgent attention. 83.0 percent are while 10.7% are single, 1.8 percent are divorced, 1.8 percent are widowed and 2.7 percent are separated. This implies that majority of the respondent had family responsibility. It also suggested that they would be desirous of opportunities that could be explored towards increasing their income earning capacity and improving their standard of living. 48.0% of the respondent had primary school education, and 17.9 percent of the respondents had no formal education, which shows that the level of education among the farmers is low. 79.0 percent of the respondents are ordinary citizen in the community while 8 percent are only household head, 12.0 percent are religion head, 12.0 percent are just civil servant and public servant and 1.0 percent is Oba or community head. The result shows that majority (70.5%) of the respondents are ordinary citizens, which implies that they are more recognized and significant in the community. 99.1 percent of the respondents are mainly farmers while 0.9 percent are not farmers. The implication of this is that the community is agrarian in nature and thereby, concentration should be given to them to ease their farming system. Majority 63.0% of the respondents are Christians while others (38.0%) are Muslim. Per capita food expenditure of total food and individual food items are presented in Table 6. The results showed that the total food expenditure is N4, 961.24. The proportion of the food for energy giving food, protein and vegetable fruits in total food expenditures are 54.18%, 32.19% and 13.63 respectively. Per capita food expenditure is about N925.605 which implies that an individual in the sample expended on food per month. The per capita expenditure on energy giving food is very high. A relatively small amount was expended on fruit and vegetables per month. Summarily, the results indicate that the sampled households consumed higher quantity of carbohydrates (energy giving) and relatively small amount of vitamins. This reveals that the level of poverty in the study area is very high and needs government urgent attention.
| Explanatory variables | Beverages | Other food | Vegetable and fruits |
|---|---|---|---|
| Constant | 120.29 | -93.252 | -28.715 |
| Age | 0.82689 | 5.1633 | 1.4249 |
| (0.1226) | (0.7554) | (0.3834) | |
| Household size | 10.803 | 38.177 | 27.075 |
| (0.2800) | (0.9037) | (1.273) | |
| Female | 211.07 | 186.23 | 80.663 |
| (1.038) | (0.9037) | (0.7200) | |
| Married | -133.67 | 56.741 | 107.88 |
| (-0.7730) | (0.1581) | (0.5530) | |
| Single | -358.28 | -600.44 | -83.862 |
| (1.732)* | (-1.278) | (-0.3284) | |
| Education | 56.032 | 114.32 | 25.313 |
| (1.732) | (3.488)*** | (1.420) | |
| Log likelihood | -11866.4 | -11866.4 | -11866.4 |
| R2/square r | 0.0423 | 0.1408 | 0.0414 |
Table text extracted from the original PDF; superscript letters are shown inline. The original table image is below.
View original table image
| Variables | Frequency | Percentage | Means |
|---|---|---|---|
| Marital status | |||
| Married | 93 | 83.0 | |
| Single | 12 | 10.7 | |
| Divorced | 2 | 1.8 | |
| Separated | 3 | 2.7 | |
| Educational level | |||
| No formal education | 20 | 17.9 | |
| Primary education | 54 | 48.2 | |
| Secondary education | 21 | 18.8 | |
| Tertiary education | 17 | 15.1 | |
| Position held | |||
| Ordinary citizens | 79 | 70.5 | |
| Household head | 8 | 7.1 | |
| Traditional/religion head | 12 | 10.7 | |
| Civil/public servant | 12 | 10.7 | |
| Oba/community head | 1 | 1.0 | |
| Major occupation | |||
| Farmers | 111 | 99.1 | |
| Others | 1 | 0.9 | |
| Religion | |||
| Christian | 70 | 63.0 | |
| Muslim | 42 | 38.0 | |
| Total | 112 | 100.0 |
Table text extracted from the original PDF; superscript letters are shown inline. The original table image is below.
View original table image
Tobit regression analysis for food expenditure
The result from this regression analysis as it is being presented in Table 7, 8 and 9 below. The result explained the effect of socio-economic characteristics (marital status, household size, sex, education level, age and household income) on food items. The estimates of Tobit regression parameters for each food items/groups as well as on total food expenditure. Income was indicated to have exercised negative and significant influence on expenditure. Age has significant effect on the consumption of the food items as well as on income. This was negative in cereal, non-food expenditure, protein and all the rest were positive. The household size has positive effect on all the food items and a significant effect on yam flour, cocoyam, and cassava. The essence of this result is that consumption expenditure on energy giving food, the coefficient of the household size is positive inline with all. The table shows that as household size increases, all the food item for energy giving food also increases. The household size has significant impact on protein and vegetables with a positive value which means that as household size increases, the consumption expenditure on fruit and vegetables increases. In case of industrial products (such as semovita, baked food, and beverages) and other foods, household size does not have any significant effect but on semovita and baked food it had positive value which signify that as household size increases, these food consumption expenditures also increases. The significant of sex and marital status on the consumption expenditure on the food commodity except energy giving food, non-food expenditure and total income, revealed that much of energy food are consumed by both single and married. Where the single consumed less of animal protein, cassava, cereal, cocoyam, protein, vegetable and yam flour, the married consume more of these commodities. In the case of sex, it has no significance effect on total food expenditure except on energy giving food and food expenditure. It also revealed that total expenditure of female household head on food in less than that of female household head. In the same vein, women expenditure on food items is less than that of their male counterpart who is household heads. This is not unexpected because on the average the income of male who is household head is higher than their female counterpart. This result corroborates the findings of Babalola (1978). Education has significant impact on animal protein, energy giving food, other food, plant protein and yam flour but its effect is not significant on vegetable, beverages, cassava, cereal and nonfood expenditure. Though education has significant effect on animal protein sources (such as egg and milk) and other (such as turkey, chicken pork, bush meat and snail) which are considered as the food for elite in the society in not significant, nevertheless the result indicates increases in other animal protein sources and other meat consumption with the level of education. For educated household, in the sample expenditure on processed foods such as bakery products and dairy products and beverages and those food that cab be quickly prepared (i.e. fast foods) like eggs, bread etc. increases with higher level of education compared to the natural or raw foods that tend to take more time to prepare like garri, fufu, beans and cassava flour.
| Explanatory variables | Animal Protein | Plant protein |
|---|---|---|
| Constant | 120.29 | 571.25 |
| Age | 0.82689 | -2.2080 |
| (0.1226) | (-0.3794) | |
| Household size | 10.803 | 31.587 |
| (0.2800) | (0.6483)* | |
| Female | 211.07 | 239.54 |
| (1.038) | (1.365) | |
| Married | -133.67 | -346.2 |
| (-0.7730) | (-1.133) | |
| Single | -358.28 | -711.29 |
| (1.732)* | (-1.778) | |
| Education | 56.032 | 52.345 |
| (1.732) | (1.875)* | |
| Log likelihood | -11866.4 | -11866.4 |
| R2/square r | 0.0877 | 0.0650 |
Table text extracted from the original PDF; superscript letters are shown inline. The original table image is below.
View original table image
Conclusion
The conclusions were based on the attainment of the objectives of the study. In order to attain household food and nutrition security, majority of the males and females heads of households engaged in both agricultural and non-agricultural activity while some are involved in multiple activities. Nevertheless, they are still poor and majority of the female heads of household had no formal education and this majority made decision on food consumption in the household. However, household food availability in the study area is average, while members have occasional access to food and consumption of nutritious food culminating into chronic food and nutrition insecurity in the study area. Infrastructural facility often posed constraints to both female heads and male heads of household in their struggle to attain food and nutrition security. This include lack of constant supply of electricity, lack of knowledge of nutritious food, lack of access to credit facility to engage in small business, lack of appropriate technology for processing storage and preservation, lack of money to purchase pesticides, lack of portable water, problem of unemployment, reliance on crude farm inputs, such as hoe, cutlass, poor maintenance of road, poor health facility, unavailability of pesticides, high cost of petroleum product like petrol, kerosene and diesel, high cost of food items, high cost of agricultural inputs, inadequate extension reach out and inadequate supply of fertilizer. Importantly, both the female and male heads of household are aware of the importance of food and nutrition security attainment. However, they are indifference to its attainment and they have lost confidence in the government, therefore, it appears they do not rely on government for provision of these facilities. The study revealed a significant relationship existing, (i) only in religion affiliation, household size, (ii) no significant difference between income, (iii) between activities contributed by both household gender heads, (iv) between the extent to which household gender heads are confronted with constraints in the process of ascertaining household food and nutrition security and (v) between attitudes of gender heads to provision of food and nutrition security and level of food and nutrition security. The study revealed also that, in considering household food availability determinant, number of years spend in school, marital status, income per month by wife, age and income per month by children are the most discriminating variables and are therefore important variables to be considered in any study. The household accessibility (income) determinant could also be considered by the following most discriminating variables, these are income from non-agricultural activities and agricultural activities. It has also been established in this study that variables like household size, number of years spend in school, Cosmo politeness, income from both agricultural and non-agricultural activities and income by wife are the most important and relevant variable to be considered when measuring household food consumption.
Recommendations
Based on the findings of the study, the following recommendations are proffered: 1. Government should increase trade flows, which will generate rural income by encouraging the establishment of cottage industries and the survival of the existing ones. 2. Government should increase financial flows via agricultural export and influence price in domestic market, which will go a long way to affect dietary pattern and food production in the rural area. Government should make and implement price policy that will promote food and nutrition security in the country. 3. There should be adequate funding of research at all times to cause advances in our transport system and generic engineering that will enable more micronutrient rich there to be achieved thereby facilitating agricultural. 4. The non-governmental organization should also support in the funding of rural communities. 5. There should be free access to credit facility combine with support services such as improve input delivery and provision of employment for the people by the government.
Figures and tables from the paper
| Dependent variables | Definitions |
|---|---|
| Total Food | Total food expenditure per month (N) |
| Industrial Products flakes per month (N) | Expenditure on baked foods, bakery, pastry and beverages, semovita, butter, bread, corn |
| Other animal protein sources | Expenditure on egg and milk per month (N) |
| Plant protein | Expenditure on legumes-beans, soya beans per month (N) |
| Energy giving food month (N). | Expenditure on cereals, garri, fufu, yam flour, cassava flour, plantain, cocoyam, potato per |
| Fruveg | Expenditure on vegetables and fruits. |
| Fruveg | Expenditure on vegetables and fruits per month (N). |
| Other food | Expenditure on cooking oils, pepper per month (N). |
| Cereals | Expenditure on rice, maize and other cereals per month (N). |
| Beverages | Expenditure on beverages, tea and coffee per month (N). |
| Cassava flour | Expenditure on cassava and yam flour per month (N). |
| Yams | Expenditure on yam, cocoyam and potato per month (N). |
| Other meats per month (N). | Expenditure on other animal product like pork, chicken, turkey, bush meat, snail, crab, prawn |
Table text extracted from the original PDF; superscript letters are shown inline. The original table image is below.
View original table image
| Dependent variables | Definitions |
|---|---|
| HHI | Household monthly income (N). |
| Age | Age of the household head (years) |
| Education | Years of non-formal and formal schooling by the household head |
| Sex | 1, if the household head is male and 2, if female |
| HHS | Household size |
| Unmarry | 1, if the household head is unmarried, 0 otherwise |
| Single | 1, if the household head is single, 0 otherwise. |
Table text extracted from the original PDF; superscript letters are shown inline. The original table image is below.
View original table image
| Variables | Frequency | Percentage | Means |
|---|---|---|---|
| Sex | |||
| Male | 89 | 79.5 | |
| Female | 23 | 20.5 | |
| Age (years) | |||
| < 30 | 29 | 25.9 | |
| 31 – 40 | 30 | 26.8 | |
| 41 – 50 | 28 | 25 | 41 |
| 51 – 60 | 13 | 11.6 | |
| > 60 | 12 | 10.7 | |
| Household size (number) | |||
| 1 – 4 | 44 | 39.3 | |
| 5 – 8 | 54 | 48.1 | |
| 9 – 12 | 13 | 11.6 | 6 |
| > 13 | 1 | 1.0 | |
| Household income (N) | 86 | 76.8 | |
| Below N 30,000 | 86 | 6.3 | |
| N 30,001 - N 40,000 | 7 | 6.3 | |
| N 40,001 - N 50,000 | 10 | 8.9 | N23, 679.02 |
| N 50,001 - N 60,000 | 6 | 5.4 | |
| Above N 60,001 | 3 | 2.7 |
Table text extracted from the original PDF; superscript letters are shown inline. The original table image is below.
View original table image
| Items | Household expenditure (N) | Percentage income (%) | Per capital expenditure (N) | Food share percentage (%) |
|---|---|---|---|---|
| Rice | 1020.71 | 4.311 | 190.431 | 20.57 |
| Cassava | 443.08 | 1.871 | 82.664 | 8.93 |
| Yam flour | 270.71 | 1.143 | 50.506 | 5.46 |
| Beans | 386.38 | 1.632 | 70.086 | 7.79 |
| Cocoyams | 461.96 | 1.951 | 86.187 | 9.31 |
| Fufu | 181.43 | 0.766 | 33.849 | 3.66 |
| Plantain | 137.50 | 0.581 | 25.653 | 2.77 |
| Semovita | 152.73 | 0.645 | 28.498 | 3.08 |
| Beverages | 328.75 | 1.388 | 61.334 | 6.63 |
| Pasteries | 20.00 | 0.085 | 3.731 | 0.40 |
| Fish | 716.88 | 3.028 | 133.746 | 14.45 |
| Egg (Beef) | 225.45 | 0.952 | 42.062 | 4.54 |
| Vegetable | 127.95 | 0.540 | 23.871 | 2.58 |
| Pepper | 217.68 | 0.913 | 40.612 | 4.39 |
| Oil | 251.70 | 1.063 | 46.959 | 5.07 |
| Spices | 16.52 | 0.070 | 3.082 | 0.33 |
| Others | 1.79 | 0.008 | 0.334 | 0.04 |
| Total | N4,961.24 | 20.947 | N925.605 |
Table text extracted from the original PDF; superscript letters are shown inline. The original table image is below.
View original table image
| Explanatory variables | Cassava | Cereal | Cocoyam | Plantain | Yam flour |
|---|---|---|---|---|---|
| Constant | 135.53 | 816.80 | 401.33 | 2157.4 | 196.14 |
| Age | 7.8618 | -3.9119 | 4.4777 | 13.543 | 6.1963 |
| (1.258) | (-0.3114) | (0.6648) | (0.5207) | (1.158) | |
| Household size | 54.500 | 31.074 | 20.664 | 217.90 | 75.949 |
| (1.524) | (0.4323) | (0.5363) | (1.464)** | (2.480)** | |
| Female | 265.45 | 363.43 | 262.83 | 1399.4 | 165.64 |
| (1.409) | (0.9595) | (1.294) | (1.785)* | (1.026) | |
| Married | 65.171 | 69.676 | -329.69 | -605.80 | -32.815 |
| (0.1987) | (0.1056) | (-0.9325) | (-0.4437) | (-0.1168) | |
| Single | -44.721 | -909.34 | -813.83 | -3204.9 | -493.54 |
| (-0.1041) | (-1.053) | (-1.7580) | (-1.793)* | (-1.342) | |
| Education | 0.77781 | 76.028 | 34.757 | 219.41 | 43.454 |
| (0.2596) | (1.262) | (1.076) | (1.759) | (1.693) | |
| Likelihood | -11866.4 | -11866.4 | -11866.4 | -11866.4 | -11866.4 |
| R2/square | 0.0381 | 0.0493 | 0.0601 | 0.0879 | 0.0843 |
Table text extracted from the original PDF; superscript letters are shown inline. The original table image is below.
View original table image
References
11 in the original paper- Adesimi AA, Ladipo OO. Pattern and intertemporal comparison of household food expenditure in an African semi-urban center: A case study of Ile-Ife, Department of Agricultural Economics, Obafemi Awolowo University, Ife, 1997.
- Anthonio BO, Oni SA. An empirical analysis of food consumption in Nigeria: A case study of Ibadan city. The Nigeria Journal of Economics and Social Studies. 1999; 11(1):17-24.
- Babalola AA. Effect of income on food consumption in Ado-Ekiti, Ondo State 'Unpublished B. Sc. Dissertation. Department of Agricultural Economics, University of Ibadan, Nigeria, 1999.
- Durojaiye BO, Olubanjo OO. Socio-Demographic factor, income distribution and food consumption pattern in rural Nigeria: The case of Ago-Iwoye and its implications. The Nigeria Journal of Rural and Communication Development. 1987; I(I):1-14.
- Food and Agricultural World Health Organisation/ United Nations University. Energy protein requirements. Report of a joint FAO/WHO/UNU, expert consultation. Technical report series 72.1 Geneva, WHO 1985, 1999.
- McDonal JF, Mofitt RA. The uses of Tobit analysis: Review of Economics and Statistics. 1980; 62:318-321.
- Olarinde LO, Kuponiyi FA. Rural livelihood and food consumption patterns among household in Oyo State, Nigeria. Implication for food security and poverty eradication in a deregulated economy. Journal of Social Sciences. 2005; 11(2):127-132.
- Olayide SO. Future food needs of Nigeria. Processing FAO/NDRD. 1998.
- Oni SA, Anthonio QBO. An empirical analysis of food consumption in Nigeria. A case study of Ibadan city. The Nigerian Journal of Economic and Social Studies, 1974, 11(1).
- Rimal AP, Fletcher SM, McWatters KH. Nutrition consideration in food selection. International Food and Agribusiness Management Review 3, 2001, 55-70.
- Whitsltler D, White KJ, Wrong SD, Bates D. SHAZAM Econometric software -User reference manual. Version 9. North West Econometrics Vancouver, B. C. Canada, 528P, 2001.
Cited by 3
From OpenAlex, OpenCitations and reference lists read by Scinovex
- Rural Farmers’ Readiness to Access Information from the National Farmers Helpline Centre, National Agriculture Extension and Research Liaison Services ABU Zaria, Kaduna State, Nigeria ↗
Mohammed Bawuro Bashir, Augustine Anthony Ndaghu, Aliyu Umar Faruk, Jamila Abdulkadir Abubakar, Mark Tikwe Kyaru, Ishaya Peter · Journal of Agricultural Extension · 2022
The study investigated rural farmers’ readiness to access agricultural information from the National Farmers Helpline Centre NAERLS, ABU Zaria. The specific objectives were to describe the socio-economic characteristics of Nigerian rural farmers, identify the major agricultural information accessed by rural farmers from the National Farmers Helpline Centre and identify the various constraints faced by Nigerian rural farmers in accessing agricultural…
❝ 3PDF - India’s agriculture: Issues and priorities
Nazeerudin, BM Rajani Kanth · International Journal of Agriculture and Food Science · 2023
Indian agriculture employs the largest share of the workforce – about 42 percent in 2019 – though its share in overall gross domestic product (GDP) is only 16.5 percent. India is still largely a rural economy with 66 percent of the country’s population living in rural areas (World Bank, 2019) and agriculture continues to be the mainstay of a large segment of this section of the population. Agriculture is also important for consumers, as an average Indian household spends about 45 percent of its expenditure on food. 1 Moreover, given that India is going to be the most populous country, surpassi
- New economic reforms and livelihood transition of tribal women: A case study of Arunachal Pradesh ↗
Shasana Yomso · International journal of applied research · 2020
Tribal economy in India has been witnessing substantial changes since the colonial period. After 1990s with the onset of neoliberal policy the whole approach to tribal development experienced a drastic change. Tribal economy fell into the hands of the market and private enterprises including corporate capitalists. Emphasis was given on the entry of private capital in tune with the process
❝ 0Found by Scinovex