
Research article · 2020 · Full text
International Journal of Research in AgronomyProduction economics and technology adoption of spring rice at Eastern Chitwan of Nepal
Volume 3(1) · Pages 13–18 · DOI: 10.33545/2618060x.2020.v3.i1a.25 ↗
Research areasAgricultural Economics and Practices
Abstract
Author-writtenThis study was conducted to know the production economics and modern agro-technology adoption by the farmers of the Eastern Chitwan who grow spring rice prior to main season rice. Altogether 48 samples were taken by simple random sampling technique which includes 24 from Rapti municipality and other 24 from Khairahani municipality. Survey method was used to collect primary information through a semi-structured interview schedule. The analysis showed that the average age of the household head was 43.62 and 53.29 in Rapti and Khairahani municipality respectively. Insect pest, storage and disease infestation were top three major problems reported by the farmers of Rapti municipality whereas disease infestation, insect pest and labour scarcity were of Khairahani municipality The average production cost and average net return per ha in Rapti municipality were found Rs. 99099 ± 6147 and Rs. 110546±4293 respectively and in Khairahani municipality was Rs. 86349 ± 3885 and Rs. 104420±4958 respectively. The average benefit-cost ratio of the spring rice was found higher in Khairahani municipality (1.26) than in Rapti municipality (1.15) indicating the more efficient production practice in Khairahani municipality. The Technology of soil testing, herbicide application, zinc dose and mechanical harvesting were significantly influenced by the location whereas education, gender and training received had not significantly influenced the age of seedling, herbicide application, seed replacement, NPK dose, zinc dose, seed rate, mechanical harvesting and mechanical threshing.
Summary
Source-checkedPlain-language reading of the full paper, prepared with AI and checked against the text. Each point links to the authors' own words.
Why it matters
- Rice is the most critical cereal crop for Nepal's economy, contributing 7% to the national GDP. View evidence ↗
- In the Chitwan region, spring rice exhibits higher productivity compared to monsoon rice, which produces 3.49 t ha-1. View evidence ↗
- Despite available irrigation and high-yielding varieties, rice production remains stagnant due to poor land management and limited access to technology. View evidence ↗
The question
- The study aimed to evaluate the production economics and the adoption of modern agricultural technologies among spring rice farmers in Eastern Chitwan. View evidence ↗
What they did
- The researchers used simple random sampling to select 48 farmers, split equally between Rapti and Khairahani municipalities. View evidence ↗
- Primary data were collected using a survey method involving semi-structured interviews. View evidence ↗
- Data were analyzed using Microsoft Excel and SPSS version 20, focusing primarily on descriptive methods. View evidence ↗
What they found
- The primary challenges differed by location: Rapti farmers cited insect pests, storage, and disease, while Khairahani farmers cited disease, insect pests, and labor scarcity. View evidence ↗
- Average production costs per hectare were higher in Rapti municipality (Rs 99,099 ± 6,147) than in Khairahani municipality (Rs 86,349 ± 3,885). View evidence ↗
- Khairahani municipality showed more efficient production with a benefit-cost ratio of 1.26, compared to 1.15 in Rapti municipality. View evidence ↗
- The adoption of soil testing, herbicide application, zinc dosing, and mechanical harvesting was significantly affected by the farmer's location. View evidence ↗
- Factors such as gender, education, and training did not significantly influence the adoption of most measured technologies, including NPK dose and seed replacement. View evidence ↗
What it means
- The authors conclude that spring rice production can be improved by addressing pests, diseases, storage, and labor scarcity, while expanding the production area requires better irrigation management. View evidence ↗
Visual summary
2 visualsIllustrations explain the paper; charts are replotted from the paper's own table values.
Determinants of Technology Adoption
AI-generated conceptual illustration (Spring rice plants in a field in Eastern Chitwan, Nepal). It explains the idea and does not show study data.
View source evidence ↗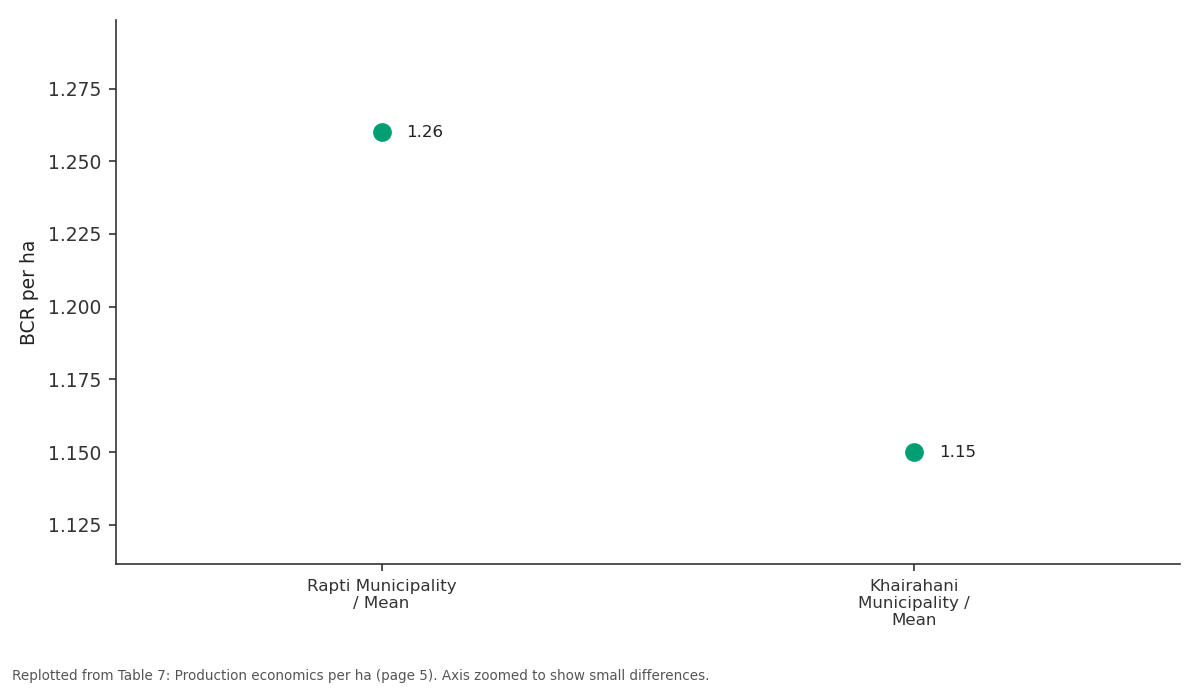
BCR per ha: Rapti Municipality /... vs Khairahani Municipality...
Replotted from Table 7 (page 5) of the original paper. Every bar is the paper's own table value.
View source evidence ↗Figures & tables
From the original paper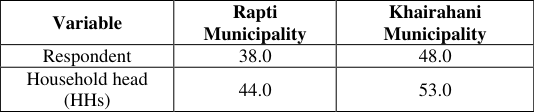 Table 1
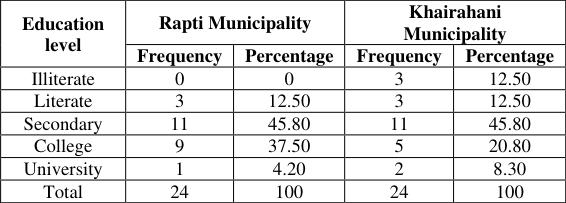 Table 2
 Table 3
 Table 4
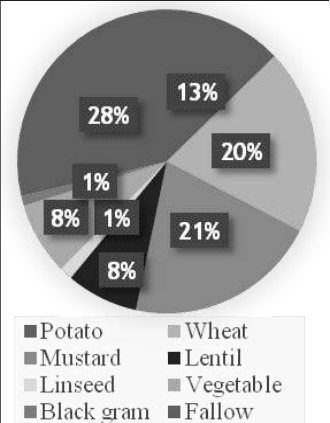 Figure 1
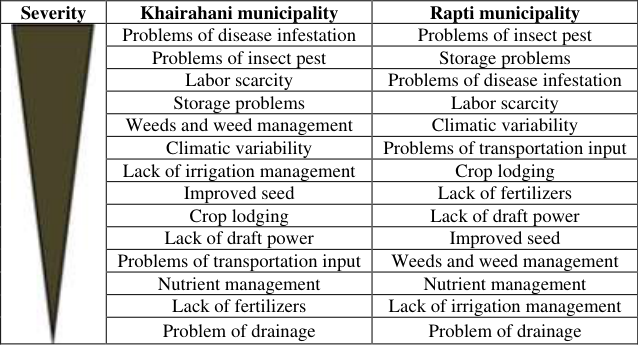 Table 5
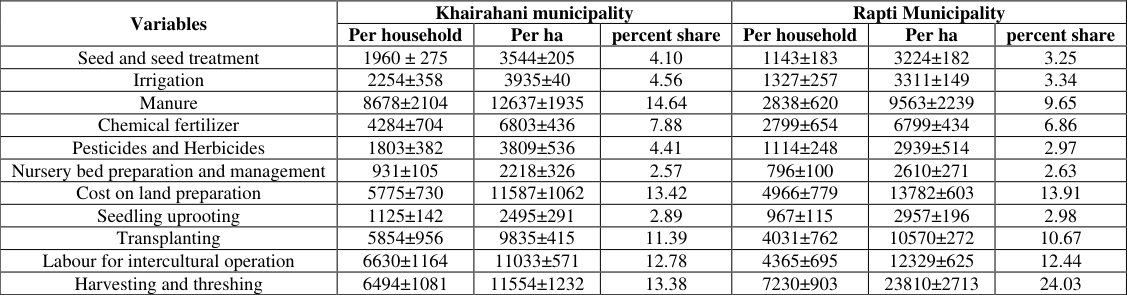 Table 6
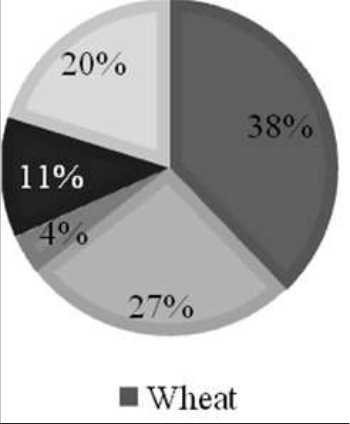 Figure 2
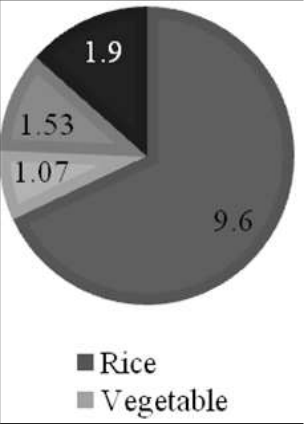 Figure 2
 Table 7
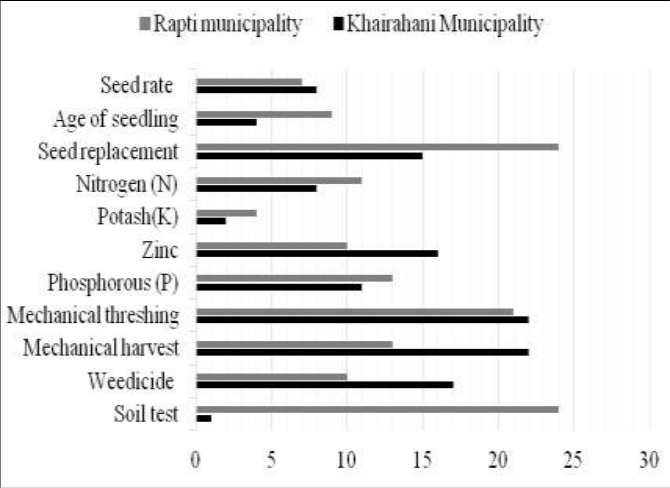 Figure 3
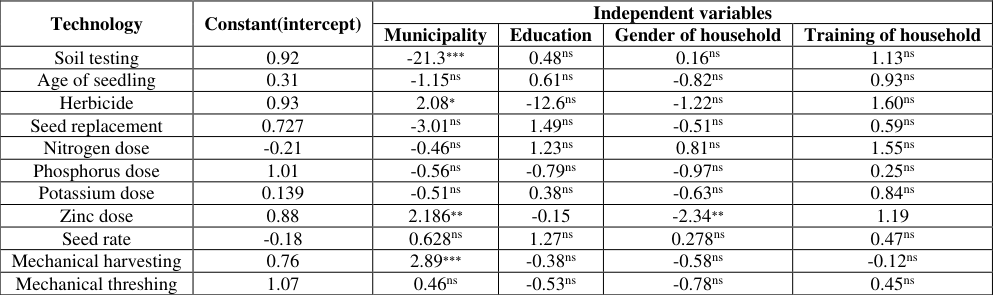 Table 8
Introduction
Rice is the most important cereal crops in agriculture and economy of Nepal contributing 7 percent to GDP. Among the cereals, rice comes first contributing about 42 percent of the total area under food crops of 1.36 million ha. It is the widely produced crop with 53percent of total edible cereal production and about 18percent to Agricultural Gross Domestic Product (AGDP) in the country. About 75 percent of the working population is engaged in rice farming for at least six months of the year with the production of about 4.29 million Mt. ton. (MoAD, 2016) [8] . It is grown in three agro-ecological zones, namely the Terai and Inner Terai (67 to 900 masl), mid-hills (1000 to 1500) masl and high hills-1500 to 3050. About 69.7 percent of the total rice area is located in the flat plains of Terai. The mid-hills and high hills occupy only about 25.8 percent and 4.4 percent, respectively. About 92 percent of rice area falls under main (Barkhe) season while 7 percent is under spring (Chaite) season. Boro rice and Bhadaiya rice is also practiced in few districts of Terai occupying less than 1percent of the total area (CDD, 2015) [3] . Spring rice is sown in the last week of February to the first week of March and follows transplanting of 30-40 days old seedlings. The month of transplanting coincides with the Nepali month "Chaitra" and so is named as Chaite rice. This crop also needs assured irrigation from various sources. The coverage area of spring rice for mountain, hill and Terai is found to be 5.48, 24.85 and 69.67 percent, respectively. The crop is also called "Hiunde" rice as it is sown in winter months (first to second week of February) (CDD, 2015) [3] . In Chitwan 29,700 ha is covered by monsoon rice and 4600 ha is covered by spring rice (4000 ha in eastern Chitwan and 500 in western Chitwan.) The total production of spring rice is 20,240 tons. with the productivity of 4.4 t ha -1 . The productivity of spring rice in Chitwan is higher in comparison to monsoon rice which is only 3.49 t ha -1 (DADO, 2016) [4] . Spring paddy is resistant to many diseases and pests besides being more efficient in terms of lesser quantity of loss percentage during production. Around 11 varieties of spring paddy have already been released for the Terai, inner Terai and river basins areas and similar climatic regions (Spring paddy to mega rice yield). According to the District Agricultural Office (DAO), spring paddy used to be the second most important crop in the district. Many farmers used to plant spring paddy on the fields in Madi, known as the district's grain basket, which lies near the Tinau River. More than 50 percent of the farmers around Rampur, Jhadewa, Arun River, Purba River, Lamdi River, Argali and Nisdi River used to cultivate spring paddy because there was adequate water for irrigation. Currently, only about 10 percent of the farmers plant spring paddy. The government has come up with schemes in the past to expand the acreage of spring paddy by 200,000 hectares in a bid to increase output and make the country self-reliant in food grain.Most farmers do not prefer spring paddy as it bears a larger grain. However, it has higher productivity than regular paddy. According to a governmental source, the productivity of spring paddy is 4 tonnes per hectare compared to 3.17 tonnes for regular paddy. Despite of being the major rice producer, Chitwan still lags the maximum production up to its potentiality. The average productivity of irrigated rice of Chitwan district is 3.47 t ha -1 whereas average national productivity is 3.887 t ha -1 (Krishi Diary, 2074) [5] . In spite having all other requirements for successful rice cultivation like irrigation facility and high yielding variety, land management and access technologies still resulting the stagnant production in rice. Farmers are still following traditional methods. They have not been able to upgrade themselves regarding spring rice cultivation techniques. Chitwan is potent for increasing its rice productivity if the proper method for its cultivation is disseminated among the farmer. This study will browse actual problem related with low adoption of two season paddy cultivation after adoption of suitable practices in the farmer field. The major objective of this study was to study the spring rice production system of eastern area of Chitwan. To reach this focal mission, the following specific objectives were considered. To determine production cost, return and benefit of spring rice, To identify problem of production of spring rice in study area, To calculate level of technology adoption of spring rice production and its determinants.
Research Methodology 2.1 Selection of study area
The site of study was the area of Eastern Chitwan which includes two municipalities (Khairahani and Rapti). Khairahani municipality is a block of rice under PMAMP program and Rapti municipality is an area where Mega rice project was launched in 2073/2074. The target populations were farmer from this area who grows spring rice along with main season rice.
Study design
Rice growers of Chitwan district of Nepal was study population. Altogether 48 respondents comparing 24 from rice block and other 24 from area of mega rice project. Questionnaires were prepared and selected households were interviewed with semi structured questionnaire for surveyor superiority. Method used was Random Sampling Method.
Sources of data and techniques for data collection 2.3.1 Primary data
The primary data were collected through conducting household surveys, key informant survey and focus group discussion.
These data were supplemented by the information obtained through household survey and consultation with university experts.
Secondary data
Secondary data
Data analysis technique
The information collected from the field was coded first and entered into the computer. Data entry and analysis was done by using computer software packages like the Statistical Package for Social Science (SPSS) version 20 and Microsoft Excel.
Collected data were analyzed by more descriptive than inferential method. Cross tabulation, comparison of mean, frequency, percentage, chart, graph and indexing were done to draw conclusion.
Results and discussion
The results and discussion included production cost summary, factors affecting the technology adoption and constraints related to spring rice production in two different municipalities.
Socio-economic and demographic information 3.1.1 Age of respondents and household head
The average age of both respondents and household head was higher in Khairahani Municipality i.e. 48 and 53 respectively, than in Rapti municipality i.e. 38 and 44 respectively.
Education status of household head
The education level was devised into five major categories. Majority of the household head in both the municipalities had attained the secondary level of education i.e. 45.80 percent. The literacy rate of Rapti municipality was found 100 percent and that of Khairahani municipality was 87.50. These figures are higher than the district average i.e. 73.98 percent and the national average i.e. 66.25 percent (CBS, 2011) [2]
Household size
The average household size in both the Municipality was found higher than the national average which is 4.7 (CBS, 2011) [2] . Majority of the household size were from the age group 15-60 in both the Municipality followed by the age group 0-15 and age group 60 and above. The mean household size for age group 15-60 is 4.08 ± 0.46 in Rapti Municipality and 4.00 ± 0.28 in Khairahani Municipality which is higher than the national average 3.58 (CBS, 2011) [2] .
Family labor force for agricultural and nonagricultural activities
Family size is an important variable that determine the supply of labor to the farm operations. The average family size of the study area was found 5.6 and 6.3 in Rapti Municipality and Khairahani Municipality respectively which is higher than district average of 4.38 and national average of 4.38 (CBS, 2011) [2] . Average number of economically active family members was found similar in both the Municipality whereas average economically active family members in agricultural activities was found 2.6 in Rapti Municipality and 3.54 in Khairahani Municipality.
Cropping pattern
Cropping pattern
Production Economics 3.4.1 Production cost summary per ha
The average production cost per ha was found higher in Rapti municipality (Rs 99099 ± 6147) than in Khairahani municipality (Rs 86349 ± 3885). These figures are higher than the national average i.e. Rs 64967.72 (Krishi Diary, 2074) [5] . Cost for harvesting and threshing shared highest share in Rapti municipality (24.03 percent) due to manual harvesting and threshing followed by cost on land preparation (13.91 percent), labor cost on intercultural operation (12.44 percent) of spring rice cultivation. Cost on manure shared highest amount in Khairahani municipality (14.64 percent) followed by cost on land preparation (13.42 percent) and cost on harvesting and threshing (13.38 percent).
Production economics per ha
The average production cost per ha was found higher in Khairahani municipality (Rs 99099 ± 6147) than in Rapti municipality (Rs 86349 ± 3885). Similarly the average net returns per ha in Rapti municipality (Rs 104420) which is lower than Khairahani municipality (Rs 110546). These figures are higher than the national average i.e. average production cost Rs 64967.72 and average net return Rs 81273.45 (Krishi Diary, 2074) [5] . In both municipality B:C ratio was higher than 1.00 and higher in Rapti Municipality as compared to Khairahani Municipality.
Factors affecting technologies adoption
The linear relationship between the adoption of recommended technologies and independent variables was sown in Table 8. Technology of soil testing, herbicide application, zinc dose and mechanical harvesting were significantly influenced by the location while age of seedling, seed replacement, NPK dose, seed rate and mechanical threshing were not influenced by the location. In the same way education, gender and training received had not influenced the adoption of age of seedling, herbicide application, seed replacement, NPK dose, zinc dose, seed rate, mechanical harvesting and mechanical threshing. It was found that the gender of household head had significantly influenced the adoption of zinc dose. This result contrast with the (Lionberger, 1960) [6] who stated that education was positively associated with the adoption of recommended practices. Especially more than eight years of schooling was found almost always associated with higher adoption rates and (Mathur, 1996) [7] who stated that training is an important part of the extension strategy followed in the entire agricultural development projects and with this there is better performance of the farmers.
| Technology | Constant(intercept) | Independent variables | — | — | — |
|---|---|---|---|---|---|
| Municipality | Education | Gender of household | Training of household | ||
| Soil testing | 0.92 | -21.3⁎⁎⁎ | 0.48ns | 0.16ns | 1.13ns |
| Age of seedling | 0.31 | -1.15ns | 0.61ns | -0.82ns | 0.93ns |
| Herbicide | 0.93 | 2.08⁎ | -12.6ns | -1.22ns | 1.60ns |
| Seed replacement | 0.727 | -3.01ns | 1.49ns | -0.51ns | 0.59ns |
| Nitrogen dose | -0.21 | -0.46ns | 1.23ns | 0.81ns | 1.55ns |
| Phosphorus dose | 1.01 | -0.56ns | -0.79ns | -0.97ns | 0.25ns |
| Potassium dose | 0.139 | -0.51ns | 0.38ns | -0.63ns | 0.84ns |
| Zinc dose | 0.88 | 2.186⁎⁎ | -0.15 | -2.34⁎⁎ | 1.19 |
| Seed rate | -0.18 | 0.628ns | 1.27ns | 0.278ns | 0.47ns |
| Mechanical harvesting | 0.76 | 2.89⁎⁎⁎ | -0.38ns | -0.58ns | -0.12ns |
| Mechanical threshing | 1.07 | 0.46ns | -0.53ns | -0.78ns | 0.45ns |
Table text extracted from the original PDF; superscript letters are shown inline. The original table image is below.
View original table image
Conclusion
Majority of the farmers involved in agriculture in both the municipalities were of economically active aged group. The average land holding was found higher in both study site in comparison to the national scenario. The benefit cost ratio of spring rice cultivation was found higher in Khairahani municipality and lower in Rapti municipality in comparison to national scenario. The factors affecting the technology adoption was site specific rather than the gender, education of household head and participation on training. The production of spring rice cultivation can further be increased by addressing the problems of disease and pest, storage and labor scarcity whereas the production area can be increased by managing the proper irrigation facilities.
Figures and tables from the paper
| Variable | Rapti Municipality | Khairahani Municipality |
|---|---|---|
| Respondent | 38.0 | 48.0 |
| Household head (HHs) | 44.0 | 53.0 |
Table text extracted from the original PDF; superscript letters are shown inline. The original table image is below.
View original table image
| Education level | Rapti Municipality | — | Khairahani Municipality | — |
|---|---|---|---|---|
| Frequency | Percentage | Frequency | Percentage | |
| Illiterate | 0 | 0 | 3 | 12.50 |
| Literate | 3 | 12.50 | 3 | 12.50 |
| Secondary | 11 | 45.80 | 11 | 45.80 |
| College | 9 | 37.50 | 5 | 20.80 |
| University | 1 | 4.20 | 2 | 8.30 |
| Total | 24 | 100 | 24 | 100 |
Table text extracted from the original PDF; superscript letters are shown inline. The original table image is below.
View original table image
| Age categories | Rapti Municipality | — | — | Khairahani Municipality | — | — |
|---|---|---|---|---|---|---|
| Female | Male | Total | Female | Male | Total | |
| Mean ± SE | Mean ± SE | Mean ± SE | Mean ± SE | Mean ± SE | Mean ± SE | |
| <15 years | 0.63±0.20 | 0.88 ± 0.24 | 1.50±0.39 | 0.63±0.19 | 0.79±0.13 | 1.42±0.23 |
| 15-60 years | 2.00±0.25 | 2.08±0.27 | 4.08±0.46 | 2.00±0.16 | 2.00±0.17 | 4.00±0.28 |
| ≥ 60 years | 0.33±0.10 | 0.38±0.10 | 0.71±0.19 | 0.00±0.00 | 0.25±0.09 | 0.25±0.09 |
| Total | 2.96±0.42 | 3.33±0.50 | 6.29±0.86 | 2.63±0.31 | 3.04±0.23 | 5.67±0.45 |
Table text extracted from the original PDF; superscript letters are shown inline. The original table image is below.
View original table image
| Variables | Rapti Municipality | Khairahani Municipality |
|---|---|---|
| Average family size | 5.6 | 6.3 |
| Average number of economically active family members | 4 | 4.08 |
| Average economically active family members in agricultural activities | 2.6 | 3.54 |
| Average economically active family members in non-agricultural activities | 1.4 | 0.54 |
Table text extracted from the original PDF; superscript letters are shown inline. The original table image is below.
View original table image
| Severity | Khairahani municipality | Rapti municipality |
|---|---|---|
| Problems of disease infestation | Problems of insect pest | |
| Problems of insect pest | Storage problems | |
| Labor scarcity | Problems of disease infestation | |
| Storage problems | Labor scarcity | |
| Weeds and weed management | Climatic variability | |
| Climatic variability | Problems of transportation input | |
| Lack of irrigation management | Crop lodging | |
| Improved seed | Lack of fertilizers | |
| Crop lodging | Lack of draft power | |
| Lack of draft power | Improved seed | |
| Problems of transportation input | Weeds and weed management | |
| Nutrient management | Nutrient management | |
| Lack of fertilizers | Lack of irrigation management | |
| Problem of drainage | Problem of drainage |
Table text extracted from the original PDF; superscript letters are shown inline. The original table image is below.
View original table image
| Variables | Khairahani municipality | — | — | Rapti Municipality | — | — |
|---|---|---|---|---|---|---|
| Per household | Per ha | percent share | Per household | Per ha | percent share | |
| Seed and seed treatment | 1960 ± 275 | 3544±205 | 4.10 | 1143±183 | 3224±182 | 3.25 |
| Irrigation | 2254±358 | 3935±40 | 4.56 | 1327±257 | 3311±149 | 3.34 |
| Manure | 8678±2104 | 12637±1935 | 14.64 | 2838±620 | 9563±2239 | 9.65 |
| Chemical fertilizer | 4284±704 | 6803±436 | 7.88 | 2799±654 | 6799±434 | 6.86 |
| Pesticides and Herbicides | 1803±382 | 3809±536 | 4.41 | 1114±248 | 2939±514 | 2.97 |
| Nursery bed preparation and management | 931±105 | 2218±326 | 2.57 | 796±100 | 2610±271 | 2.63 |
| Cost on land preparation | 5775±730 | 11587±1062 | 13.42 | 4966±779 | 13782±603 | 13.91 |
| Seedling uprooting | 1125±142 | 2495±291 | 2.89 | 967±115 | 2957±196 | 2.98 |
| Transplanting | 5854±956 | 9835±415 | 11.39 | 4031±762 | 10570±272 | 10.67 |
| Labour for intercultural operation | 6630±1164 | 11033±571 | 12.78 | 4365±695 | 12329±625 | 12.44 |
| Harvesting and threshing | 6494±1081 | 11554±1232 | 13.38 | 7230±903 | 23810±2713 | 24.03 |
Table text extracted from the original PDF; superscript letters are shown inline. The original table image is below.
View original table image
| Variable | Rapti Municipality | — | Khairahani Municipality | — |
|---|---|---|---|---|
| Mean | SE | Mean | SE | |
| Total cost of production per ha | 86349 | 3885 | 99099 | 6147 |
| Total return per ha | 104420 | 4958 | 110546 | 4293 |
| Net return per ha | 18072 | 5791 | 11447 | 3468 |
| BCR per ha | 1.26 | 0.08 | 1.15 | 0.03 |
Table text extracted from the original PDF; superscript letters are shown inline. The original table image is below.
View original table image
References
8 in the original paper- CBS. National Sample Census of Agriculture. Kathmandu, Nepal: National Planning Commission Secretariat, Central Bureau of Statistics, 2001.
- CBS. Statistical pocket book of Nepal. Kathmandu, Nepal: National planning Commission Secretariat, Central Bureau of Statistics, 2011.
- CDD. Rice Varietal Mapping in Nepal implication for Development And Adoption. Hariharbhawan: Ministry of Agriculture Development, 2015.
- DADO. Chitwan Agriculture Diary. bharatpur: DADO, 2016.
- Krishi Diary. Kathmandu: Argriculture information and communication center, 2074.
- Lionberger RF. Adoption of new ideas and practices. Iowa State: Iowa State of University Press, 1960.
- Mathur PN. Experimental Learning Cycle. New Delhi: Jain Brothers, 1996.
- MoAD. Statistical Information and Nepalese Agriculture. Singhdurbar, Kathmandu, Nepal: Agri Statistics Section, Agribusiness Promotion and Statistics Division, Ministry of Agriculture Development, 2016.
Cited by 11
From OpenAlex, OpenCitations and reference lists read by Scinovex
- How Profitable and Energy-Efficient Is Nepal’s Crop Production? A Case Study of Spring Rice Production in Jhapa District ↗
Padam Prasad Paudel, Dharma Raj Pokhrel, Sajan Koirala, Lalan Baitha, Dae Hyun Kim, Sagar Kafle · Journal of Biosystems Engineering · 2021
❝ 10 - Comparative Economics of Main Season and Spring Rice Production in Kanchanpur District, Nepal ↗
Ritu Bhatt, Raj Kumar Adhikari, Reshma Karki, S. P. Khanal, Sachita Rajbhandari · Cognizance Journal of Multidisciplinary Studies · 2024
Rice is the major staple food crop in Nepal which has been growing in two different seasons mainly June/July – October/November as main season rice (MSR) whereas during February/March – June/July as spring rice (SR). A comparative economic analysis of MSR and SR production in Kanchanpur district Nepal was conducted during March to July 2023. A total of 120 rice-growing…
❝ 2PDF - VARIETAL PERFORMANCE OF SPRING RICE SEEDLINGS AGAINST COLD STRESS IN WESTERN TERAI OF NEPAL ↗
Monika Parajuli, Ishan Gautam, Pravin Kumar Mishra, Prakash Ghimire · Reviews In Food And Agriculture · 2022
Rice is an important commodity in Nepalese agriculture occupying 1.46-million-hectare area, where 92% area falls under main (Barkhe) season and 7% under spring (Chaite) season. Among various constraints for spring rice seedling raising, cold stress during early seedling establishment is the major one. To address the problem, an on-station trial entitled “varietal performance of spring rice seedlings against cold stress…
❝ 2PDF - Varietal evaluation of spring rice (Oryza sativa L.) genotypes in Kanchanpur, Nepal ↗
Biru Chaudhary, Tek Raj Bhatt, Pramod Gyawali · Archives of Agriculture and Environmental Science · 2023
A field experiment was carried out on spring rice in the rabi season of 2022 from February 3 to July 4 with an aim to identify the most suitable spring rice cultivar in Kanchanpur, Nepal. The experiment was laid out in Randomized Complete Block Design (RCBD) with three replications and eight treatments. The treatments were eight spring rice genotypes: one…
❝ 1PDF - Effect of Different Methods and Planting Density on the Growth and Yield of Spring Rice at Tikapur, Kailali ↗
Raksha Sharma, Niranjan K. Kushwaha, Kumar Gupta, Naresh Joshi, Pramo Kumar Sah · Far Western Review · 2023
A field experiment was conducted at Agronomy farm, Far Western University, Tikapur-1 to study the effect of different planting methods and density on yield of spring rice variety (chaite-4), when sown a month earlier than normal time. The research was laid out in randomized complete block design (RCBD) with seven treatments and three replications during Feb-June, 2022. The treatments consisted…
❝ 1PDF - Millet: The future rice ↗
Sarita Mishra · International Journal of Home Science · 2022
Millet is one of the cereal grain belongs to grass family. Its widely consumed in developing countries and in India. Millet Millet is a rich source of nutrition. The food products and beverages made out of them have many health benefits. “Different types of millets have their own specialties. Sorghum grain is completely gluten-free and rich in iron, protein and
- Ecological and ethnobotanical values of weeds found in the spring rice fields in Chitwan, Nepal ↗
Niraj Prakash Joshi · Ethnobotany Research and Applications · 2021
Background: The reliance of human beings on plants for different purposes such as medicine, fodder, fuel, and shelter is fading away, primarily, due to increasing dominance of market economy globally in the recent decades. Ethnobotanical study, especially that of weeds, is playing a crucial role in establishing the relationship between weeds and people, thereby documenting important uses of such weeds.…
❝ 1PDF - Evaluation of rice production and productivity marketing system in small producer farmers in Ethiopia
Yalew Teshome · International Journal of Agriculture and Nutrition · 2021
Ethiopia is emerging as an important rice growing country in Eastern Africa. However, there are several constraints which drastically affect rice production and its marketing system under smallholder farmer’s condition. This study aimed at examining the socioeconomic determinants of rice production and marketing in low producer farmers in the study area. A sample of 160 rice producer and 50 traders were interviewed using structured questionnaire. The result of the study showed that sex of household head is positive and statically significant in explaining rice production at 5% significant leve
- Agronomic performance and farmers' preferences of twelve spring rice genotypes under participatory approach at Kailali, Nepal ↗
Nabin Ghimire, Samikshya Pandit, Raksha Sharma, Sima Lamichhane, Shreya Tiwari, Badal Subedi · Archives of Agriculture and Environmental Science · 2024
The purpose of this paper was to assess the agronomic performance and farmers’ preferences of spring rice genotypes in collaboration with farmers. This experiment was conducted from February to June, 2023 at Khaira, Bhajani Municipality in Farmer’s Field School. The experiment was laid out in Randomized Complete Block Design (RCBD), with three replications, testing twelve rice varieties involving 37 small…
❝ 0PDF - Study of quantitative traits locis for grain characters in double haploid population of Rice ↗
Dudhare, SK Mishra · South Asian Journal of Agricultural Sciences · 2021
A double haploid mapping population consisting of 75 lines of a cross between the irrigated indica variety IR64 and the upland japonica variety Azucena was used in the present experiment. The complete set of double haploid lines along with parents was evaluated under two sets of conditions, 1. Transplanted with water stress and 2. Transplanted with no stress over two
❝ 0Found by Scinovex - Review of garlic cultivation under zero tillage in rice straw mulch (Allium sativum)
Bipin Koirala, Raja Babu Chaudhary · International Journal of Horticulture and Food Science · 2021
Garlic botanically known as Allium sativum is the second most widely used crop of genus Allium after onion (Allium cepa). It belongs to family Alliaceae. It is used as spice and condiments. The edible part of the garlic is its underground stem, which is composed of number of smaller bulbs which is known as cloves. It is a cool season crop. Cool and humid climate is required for vegetative growth and relatively dry period for bulb formation. It can be grown in variety of soil pH ranging 5-7. Garlic has been being cultivated from long time ago but the productivity is very low due to lack of bett