
Research article · 2020 · Full text
International Journal of Statistics and Applied MathematicsWind speed prediction analysis using Rayleigh distribution
Volume 5(1) · Pages 24–27
Research areasWind Energy Research and DevelopmentWind and Air Flow StudiesAerodynamics and Fluid Dynamics Research
Abstract
Author-writtenTwo parameter Rayleigh distribution is considered for prediction analysis of quantiles at extreme upper and lower tail areas of the distribution. Four methods of estimation of the parameters namely, probability weighted moment (PWM), method of maximum likelihood (MLE), method of moment (MM), and ordinary least square method (OLS) are illustrated. The Rayleigh distribution is fitted to monthly averages and monthly maximum wind speed data in Oman by each of these four estimation methods. Theoretical quantiles at various probabilities were estimated by each of these method and were compared with empirical quantiles. The mean absolute error (MAE) and mean squared errors (MSE) of the fit due to each method were worked out. It is concluded that the two parameter Rayleigh distribution can best be fitted by probability weighted moment (PWM) method.
Summary
Source-checkedPlain-language reading of the full paper, prepared with AI and checked against the text. Each point links to the authors' own words.
Why it matters
- Wind energy is a valuable resource for electricity generation because it is environmentally friendly and does not disrupt natural processes. View evidence ↗
- Accurately determining the probability distribution of wind speed is critical for estimating the wind energy potential of a specific region. View evidence ↗
- The Rayleigh distribution is widely accepted and used in specialized research to describe wind speed frequency curves. View evidence ↗
The question
- The study aims to evaluate different methods for estimating quantiles, specifically focusing on extreme quantiles, rather than selecting a new probability model. View evidence ↗
What they did
- The researchers compared four parameter estimation methods: probability weighted moment (PWM), maximum likelihood (MLE), method of moment (MM), and ordinary least square (OLS). View evidence ↗
- The analysis used a sample size of 384 monthly wind speed records from Muscat, Oman, spanning 31 years from 1980 to 2011, measured in knots. View evidence ↗
- The Rayleigh distribution was applied to both monthly average and monthly maximum wind speed data. View evidence ↗
- The accuracy of the fits was evaluated using mean absolute error (MAE) and mean squared errors (MSE). View evidence ↗
What they found
- The maximum wind speed data had a mean of 27.89, a variance of 42.23, and a standard deviation of 6.50. View evidence ↗
- The average monthly wind speed data had a mean of 5.46 and a variance of 2.56. View evidence ↗
- Using the PWM method for maximum wind speed, the 99% quantile was estimated at 44.58 and the 1% quantile at 17.47. View evidence ↗
- Using the PWM method for mean wind speed, the 99% quantile was estimated at 9.072 and the 1% quantile at 3.20. View evidence ↗
- The probability weighted moment (PWM) method was ranked as the best for fitting the Rayleigh distribution to both mean and maximum monthly wind speeds. View evidence ↗
What it means
- The authors conclude that the PWM method is superior for predicting extreme quantiles of the Rayleigh distribution and recommend its use over the maximum likelihood method. View evidence ↗
Visual summary
2 visualsIllustrations explain the paper; charts are replotted from the paper's own table values.
Comparison of Estimation Methods
AI-generated conceptual illustration (Anemometer on a weather station tower in a windy landscape). It explains the idea and does not show study data.
View source evidence ↗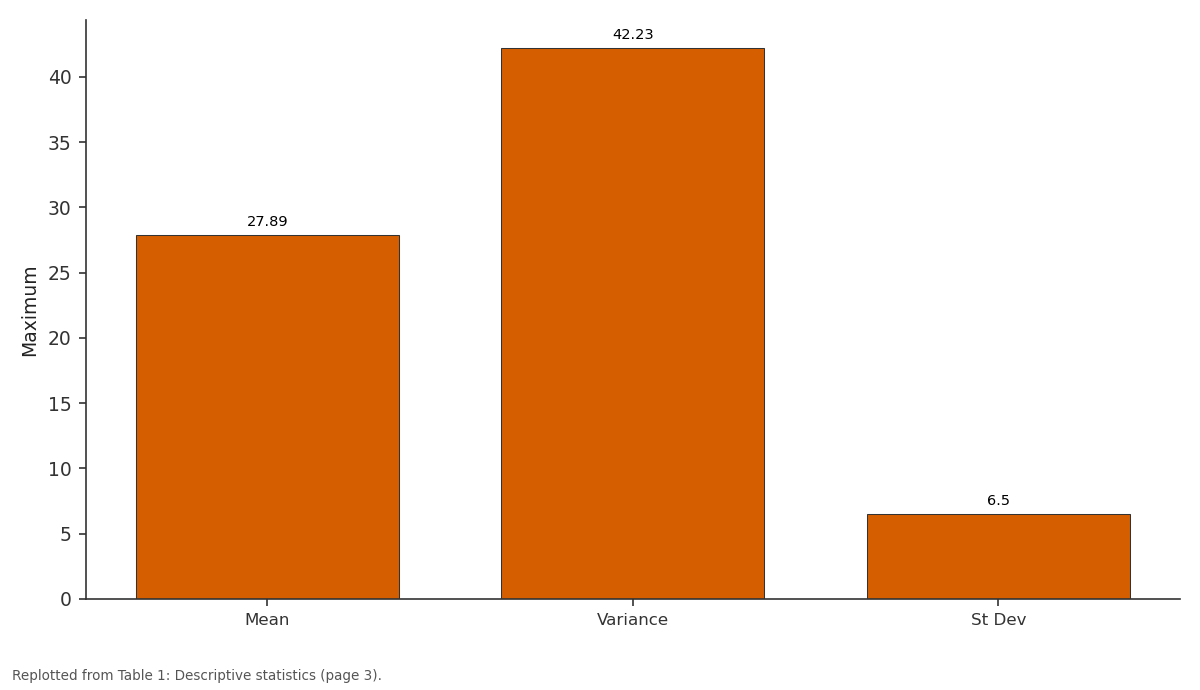
Maximum: Mean vs Variance vs St Dev
Replotted from Table 1 (page 3) of the original paper. Every bar is the paper's own table value.
View source evidence ↗Figures & tables
From the original paper Table 1
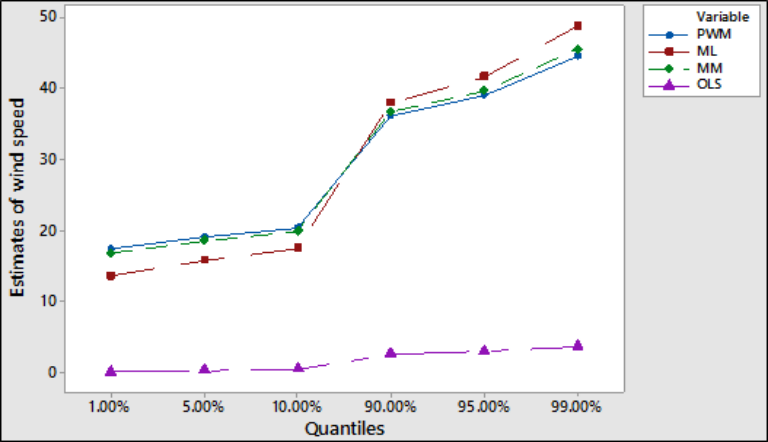 Figure 1
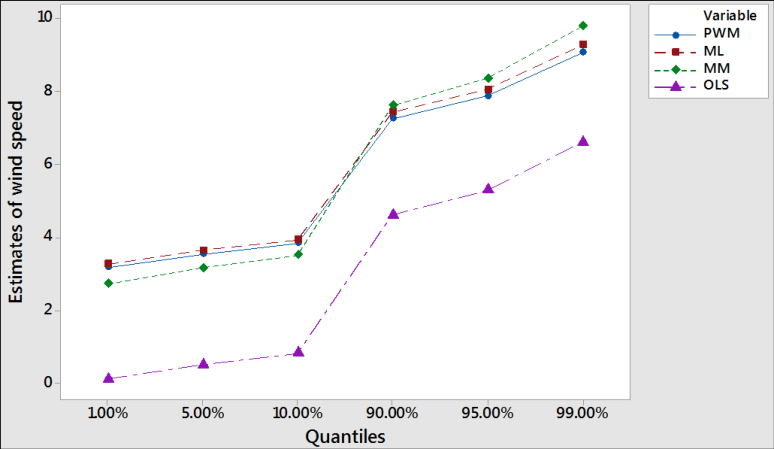 Figure 2
Introduction
Wind, that is moving air, possesses some kinetic energy due to its high speed. Wind is a result of the solar energy, as heating of land results in movement of air. Wind energy can be harnessed and used for generating electricity. The main advantage of wind energy is that harnessing it doesn't disrupt natural processes or harm the environment, unlike a lot of other energy sources. To generate electricity on a large scale, a number of windmills are set up over a large area, called a wind energy farm. Such areas need a wind speed of 15kmph [1] . Many studies have found that wind speed is the most significant parameter of wind power. Thus, an accurate determination of the probability distribution of wind speed is an important parameter to measure before estimating the wind energy potential over a particular region. Analysis of wind speed distribution is very important to evaluate the wind potential and the economic feasibility. There are several of distribution functions to describe a wind speed frequency curve but the Rayleigh distribution is the most broadly used and accepted in the specialized research journal [2,3,4] . Most of the studies on wind speed modeling consider various functional forms of the probability models using maximum likelihood method of estimation. Very little attempts were made to take inro account more recent methods of estimation such as probability weighted moment (PWM) However this study focus on the methods of estimation of the quantiles rather than the choice of the model in particular in estimating the extreme quantiles.
Review of Literature
There are extensive studies on wind speed data modeling in energy literature e.g. [5,6,7] Some of these investigation related to the choice of a probability density function are reviewed below. Tanate Chaichana et al. [6] described some statistical probability distribution functions (pdf) which have been used to measure wind power and energy potential of Saint Martin's Island situated at 13 kilometers apart from the southern-most tip of Bangladesh. They compared some well-known statistical probability density functions (pdf) namely, Normal distribution, Weibull distribution, Gamma distribution, and Rayleigh distribution. Their performance test revealed that, Weibull probability distribution proved to be the best distribution function for the wind power estimation and analysis.
Rayleigh distribution follows Weibull density in this research. Fatema [5] studied the use of Rayleigh, Inverse Weibull (IW), Burr Type III, Extreme Value (EV), Gamma, Inverse Gamma (IG), Marshall-Olkin extended Lindley (MOEL), generalized Extreme Value (GEV) and exponentiated Weibull (EW) distributions as alternatives to Weibull. Mahyoub H. Al Buhairi [7] investigated the wind energy modeling potential of Weibull and the Rayleigh models by fitting data from Yemen.
Two-parameter Rayleigh distribution
The two-parameter Rayleigh distribution is a continuous probability distribution which usually arises when a two dimensional vector has its two orthogonal components normally and independently distributed. The Euclidean norm of the vector will then have a Rayleigh distribution. The distribution may also arise in the case of random complex numbers whose real and imaginary components are normally and independently distributed. The modulus of these numbers will then be Rayleigh distributed. The Rayleigh variable X with parameter ε and parameter δ is characterized by the probability density function [4] .
The corresponding cumulative distribution function (CDF) is given as follows:
The Mean and variance of this distribution are given as below:
Estimation Methods
In this paper we investigate the estimation of the scale and threshold parameters using a modified maximum likelihood method (ML), the moment method (MM), the probability weighted moment method (PWM) and the ordinary least square method (OLS). These methods are illustrated as below.
Method of Probability Weighted Moments
Using the distribution function of the Rayleigh distribution we obtain the probability weighted moment of order r and then replacing with their sample estimates we get:
Where 𝛼 𝑟 ̂ and likewise 𝛼 𝑠 ̂given by
For n>r and 𝑐 𝑗 𝑘 = 0 for k < j are the unbiased estimators of a r and a s respectively.
In our estimation we take s=0 and r=1, so we got this
Method of maximum likelihood
In the case of the Rayleigh situation, the maximization of the likelihood function with respect to δ and ε yields easily the ML parameter estimators
Method of moments
By equating theoretical moments with the sample estimates of mean and variance we get the following ewstimates of the parameters. ε ̂= y ̅ -δ ̂x ̅
Analysis and Results
We have considered data of 31 years taken monthly from of 1980 to 2011 of the wind speed records for Muscat with 384 sample size with unit Knot (The knot is a unit of speed equal to one nautical mile (1.852 km) per hour, approximately 1.151 mph). This data consists of the mean and maximum of wind speed. The descriptive statistics is presented in Table #1 as below. The table above shows that the mean of the maximum wind speed is 27.89 with variance 42.23 and the mean of average monthly wind speed is 5.46 with variance 2.56. The maximum wind speed has the highest volatility since it has the largest standard deviation comparing to the mean wind speed. The estimates of quantiles by different method for maximum and mean wind speed are presented in Fig1 and Fig2 as below. 2 and3 show the estimates of parameters of Rayleigh distribution for mean and maximum wind speed by different methods along with ranking with MAD and MSE as measures of accuracy. Clearly method pf PWM ranks one for fitting this distribution to both mean and maximum monthly wind speed.
Conclusion
Rayleigh distribution is widely used to model wind speed data. Numerous studies have been made to compare the Rayleigh distribution with other empirical distributions. Most of these studies have compared the performance of this distribution using method of maximum likelihood only. In this study we have used four methods of estimation namely, probability weighted moment (PWM), method of maximum likelihood (MLE), method of moment (MM), and ordinary least square method (OLS) to compare the estimate of the extreme quantiles rather than merely the estimates of the parameters. The ranking of the method of estimation of the quantiles was based on criterions of mean absolute error (MAE) and mean squared errors (MSE). It was concluded that probability weighted moment (PWM) performs best to predict the extreme quantiles of Rayleigh distribution.
Therefor this distribution should be used with probability weighted moment (PWM) method of estimation rather than method of maximum likelihood.
Figures and tables from the paper
| Wind Speed | Mean | Variance | St Dev | Min | Q1 | Median | Q3 | Max | Skewness | Kurtosis |
|---|---|---|---|---|---|---|---|---|---|---|
| Maximum | 27.89 | 42.23 | 6.50 | 12 | 24 | 27 | 31 | 66 | 0.67 | 1.85 |
| Mean | 5.46 | 2.56 | 1.60 | 3 | 5 | 5 | 6 | 12 | 0.98 | 1.72 |
Table text extracted from the original PDF; superscript letters are shown inline. The original table image is below.
View original table image
References
7 in the original paper- Albuhairi MH. Assessment and Analysis of Wind Power Density in Taiz-Republic of Yemen. Assiut University Bulletin for Environmental Researches. 2006; 9:13-21.
- Baynes C, Davenport A. Some Statistical Models for Wind Climate Prediction. Preprints Fourth Conference Probability and Statistics in the Atmospheric Sciences, Tallahassee, 18-21, 1975, 1-7.
- Safari B, Gasore J. A Statistical Investigation of Wind Characteristics and Wind Energy Potential Based on the Weibull and Rayleigh Models in Rwanda. Renewable Energy. 2010; 35:2874-2880.
- Smail Mahdil, Myrtene Cenac. Estimating and Assessing the Parameters of the Logistic and Rayleigh Distributions from Three Methods of Estimation. Caribb. J Math. Comput. Sci. 2006; 13:25-34.
- Fatma Gül Akgül, Birdal Şenoğlu. Comparison of wind speed distributions: a case study for Aegean coast of Turkey, Energy Sources, Part A: Recovery, Utilization, and Environmental Effects, DOI: 10.1080/15567036.2019.1663309.
- Tanate Chaichana, Natthawud Dussadee, Akarin Intaniwe. Statistical distribution and energy estimation of the wind speed at Saint Martin's Island, Bangladesh Khandaker Dahirul Islam*. International Journal of Renewable Energy, 2017, 12(1).
- Mahyoub H, Al Buhairi. A statistical Analysis of Wind Speed Data and Assessment in Yamen. Ass. Bull. Environ. Res. No. 2, October Ass. Univ. Bull. Environ. Res., 2006, 9.
Cited by 1
From OpenAlex, OpenCitations and reference lists read by Scinovex
- Comparison of Statistical Production Models for a Solar and a Wind Power Plant ↗
Irina Meghea · Mathematics · 2023
Mathematical models to characterize and forecast the power production of photovoltaic and eolian plants are justified by the benefits of these sustainable energies, the increased usage in recent years, and the necessity to be integrated into the general energy system. In this paper, starting from two collections of data representing the power production hourly measured at a solar plant and…
❝ 0PDF