
Research article · 2020 · Full text
International Journal of Geography Geology and EnvironmentIdentification of groundwater potential zone through geospatial technology: a case of Kaliasot watershed area, Bhopal & Raisen district (M.P.), India
Volume 2(1) · Pages 44–53
Research areasGroundwater and Watershed AnalysisFlood Risk Assessment and ManagementWater resources management and optimization
Abstract
Author-writtenKaliasot reservoir is under environmental stress due to siltation, human encroachment, and sewage input from various resources. Kaliasot Basin area in Bhopal and Raisen district has been identified as one of the problematic area under the semi critical category in terms of water crisis, encroachment and haphazard urbanisation. The study area is facing many problems like scanty rainfall, scarcity of water, increasing demand of water for irrigation, domestic & industrial purposes and deforestation. The research study employs an integrated approach by using GIS and Remote Sensing since groundwater conditions of the area are controlled by many parameters i.e. drainage, geology, geomorphology, lineaments, slope, land use and land cover. Various thematic layers have been generated and assigned weightages and ranks. These layers have been integrated in GIS software for generating Groundwater Potential Zone map of Kaliasot watershed. The area falls into five categories of groundwater potential zones i.e. excellent, good, moderate, poor and very Poor depending on the likelihood of availability of ground water. On the basis of this study it is found that only 13.44km2 area is under Excellent and 110.97km2 area is under good category of groundwater availability. An area of 59.75km2 is found under moderate category whereas 7.97km2 and 0.04km2 area falls under poor and very poor category of availability of groundwater respectively.
Summary
Source-checkedPlain-language reading of the full paper, prepared with AI and checked against the text. Each point links to the authors' own words.
Why it matters
- The Kaliasot Basin in India's Bhopal and Raisen districts is considered a problematic area categorized as semi-critical due to urbanization, encroachment, and water crises. View evidence ↗
- The region suffers from water scarcity and limited rainfall, while demand for water for industrial, domestic, and irrigation use continues to rise. View evidence ↗
- Remote Sensing (RS) and Geographical Information Systems (GIS) are viewed as efficient, cost-effective tools for managing and conserving water resources. View evidence ↗
The question
- The study aims to generate a Groundwater Potential Zone map for the Kaliasot watershed by integrating various thematic layers in GIS software. View evidence ↗
What they did
- The research focused on a total geographical area of 194 square kilometers within the Kaliasot watershed. View evidence ↗
- The analysis used six controlling parameters: geology, geomorphology, slope, land use/land cover, lineament density, and drainage density. View evidence ↗
- The study employed a weighted overlay method where each thematic layer was assigned a rank and weight based on its influence on groundwater. View evidence ↗
- In the weighting process, geomorphology and slope were given higher priority (weight) than drainage and lineament density. View evidence ↗
What they found
- The largest portion of the study area, 110.97 square kilometers (58.30%), was identified as having 'Good' groundwater potential. View evidence ↗
- An area of 59.75 square kilometers (31.18%) was classified as having 'Moderate' groundwater potential. View evidence ↗
- The 'Excellent' groundwater potential zone covered 13.44 square kilometers, representing 6.72% of the area. View evidence ↗
- The 'Poor' potential zone occupied 7.97 square kilometers (3.76%) of the watershed. View evidence ↗
- The 'Very poor' potential zone was the smallest, covering only 0.04 square kilometers (0.014%). View evidence ↗
- Alluvium was assigned the highest rank (5) due to its ability to hold shallow aquifers and its high recharge potential. View evidence ↗
- Basalt and Bhander sandstone received low ranks (1 and 3, respectively) because of their impervious nature. View evidence ↗
What it means
- The authors conclude that the resulting groundwater prospects map will assist in fulfilling water demands and utilizing land based on its specific capabilities. View evidence ↗
- The authors state that their scientific and technical approach can be applied to similar future studies. View evidence ↗
Visual summary
3 visualsIllustrations explain the paper; charts are replotted from the paper's own table values.
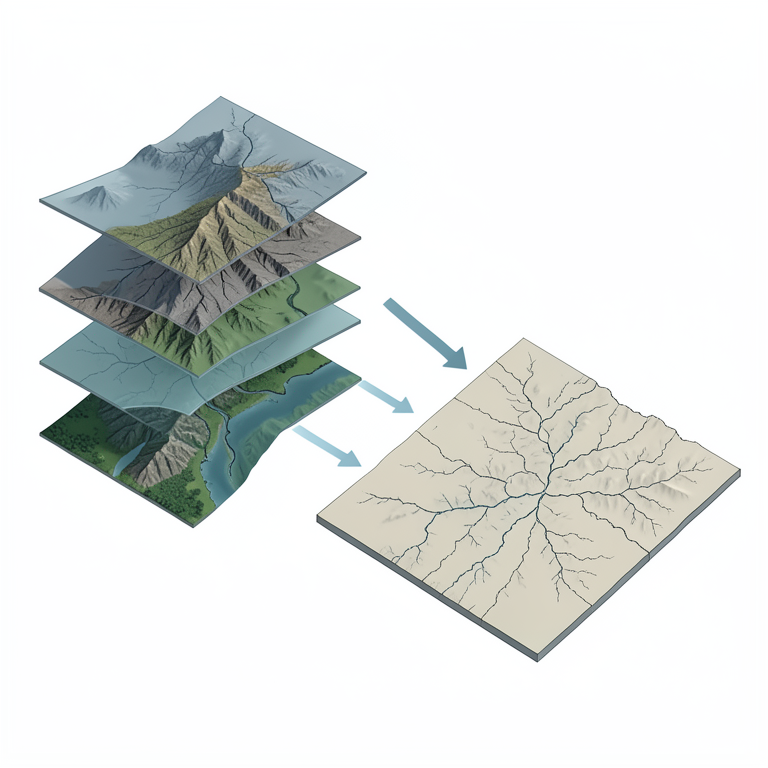
GIS Integration Process
AI-generated conceptual illustration (A geographical watershed landscape of the Kaliasot area). It explains the idea and does not show study data.
View source evidence ↗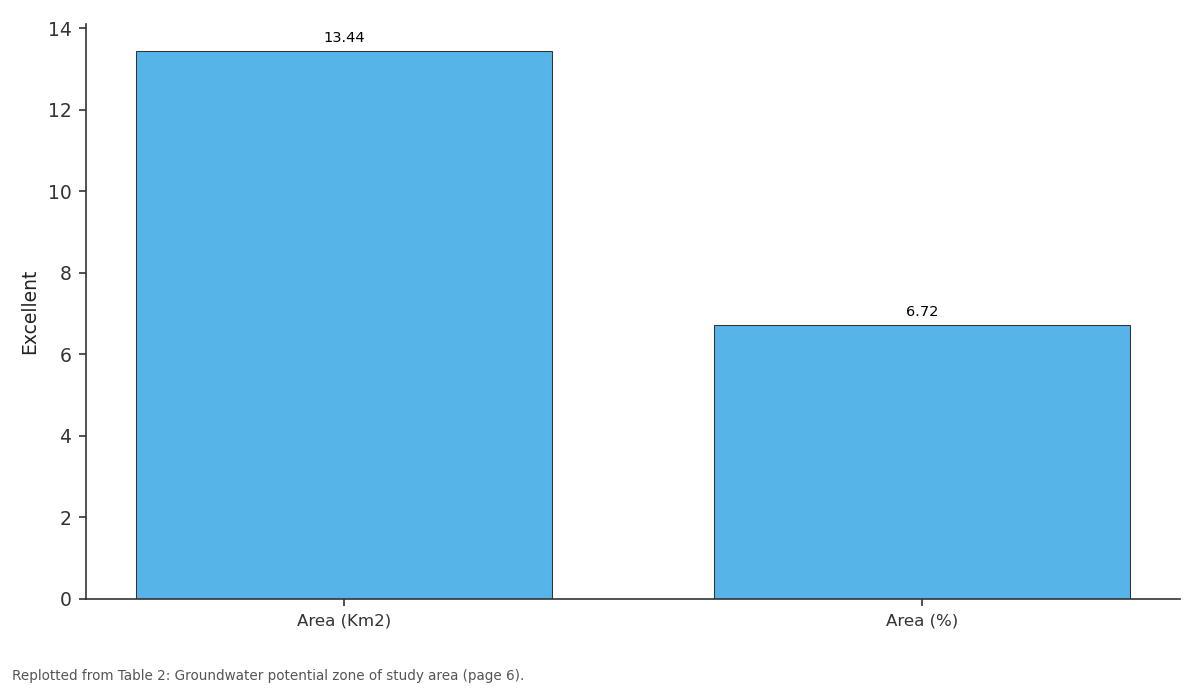
Excellent: Area (Km2) vs Area (%)
Replotted from Table 2 (page 6) of the original paper. Every bar is the paper's own table value.
View source evidence ↗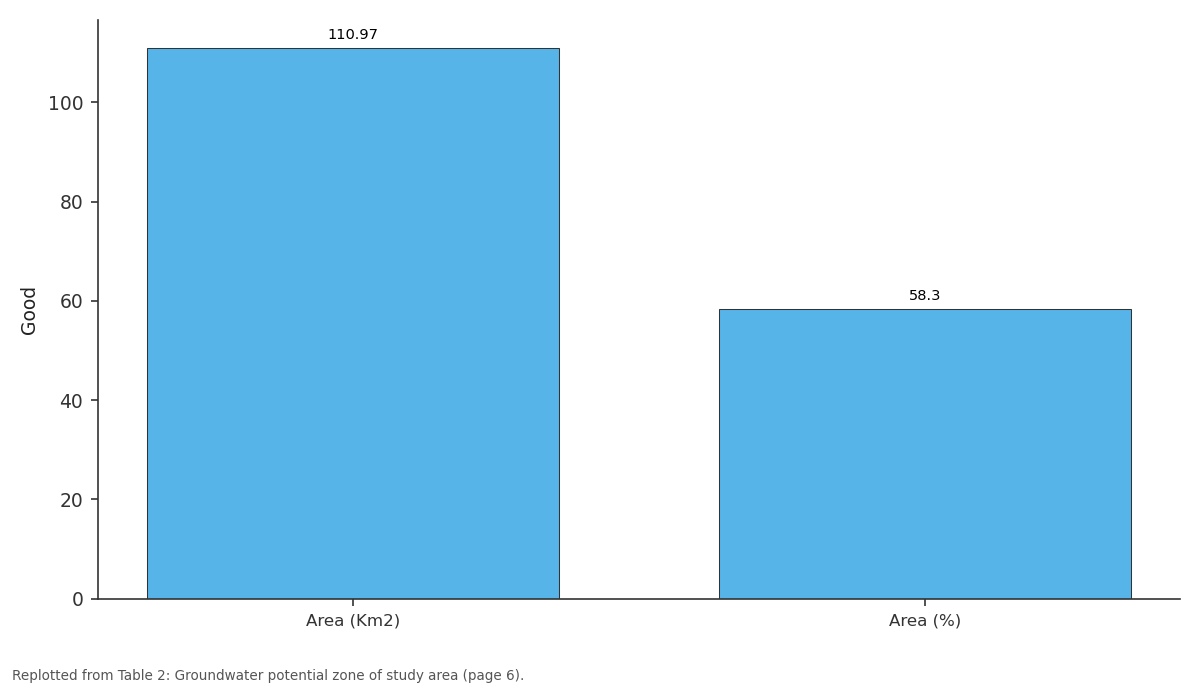
Good: Area (Km2) vs Area (%)
Replotted from Table 2 (page 6) of the original paper. Every bar is the paper's own table value.
View source evidence ↗Figures & tables
From the original paper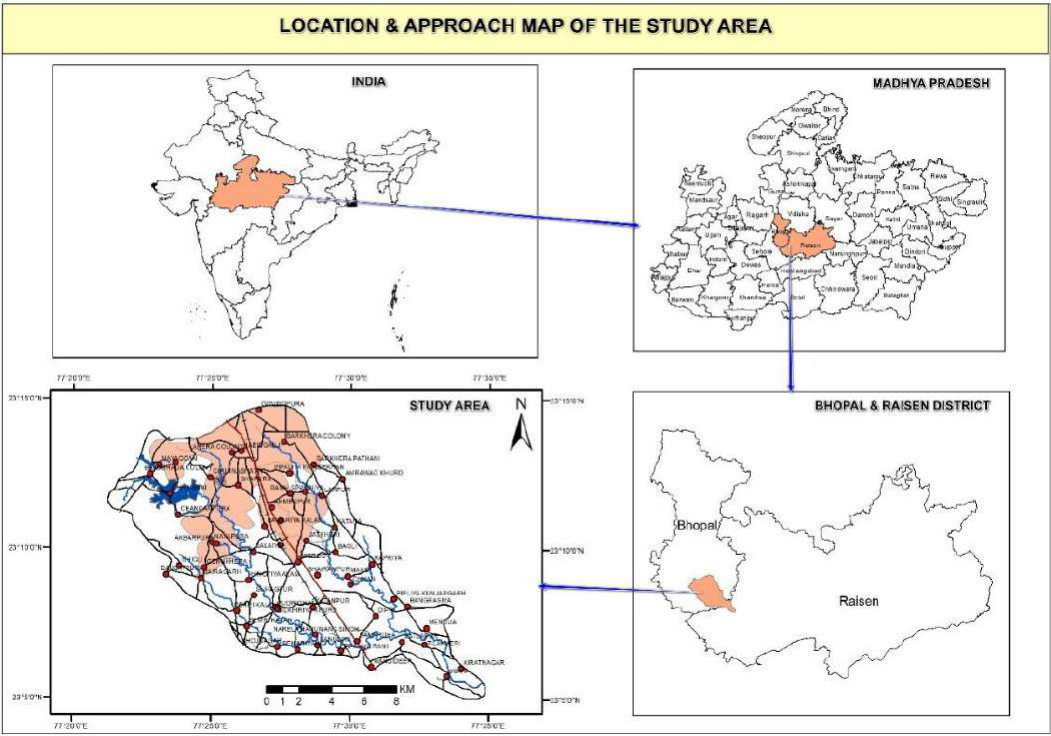 Figure 1
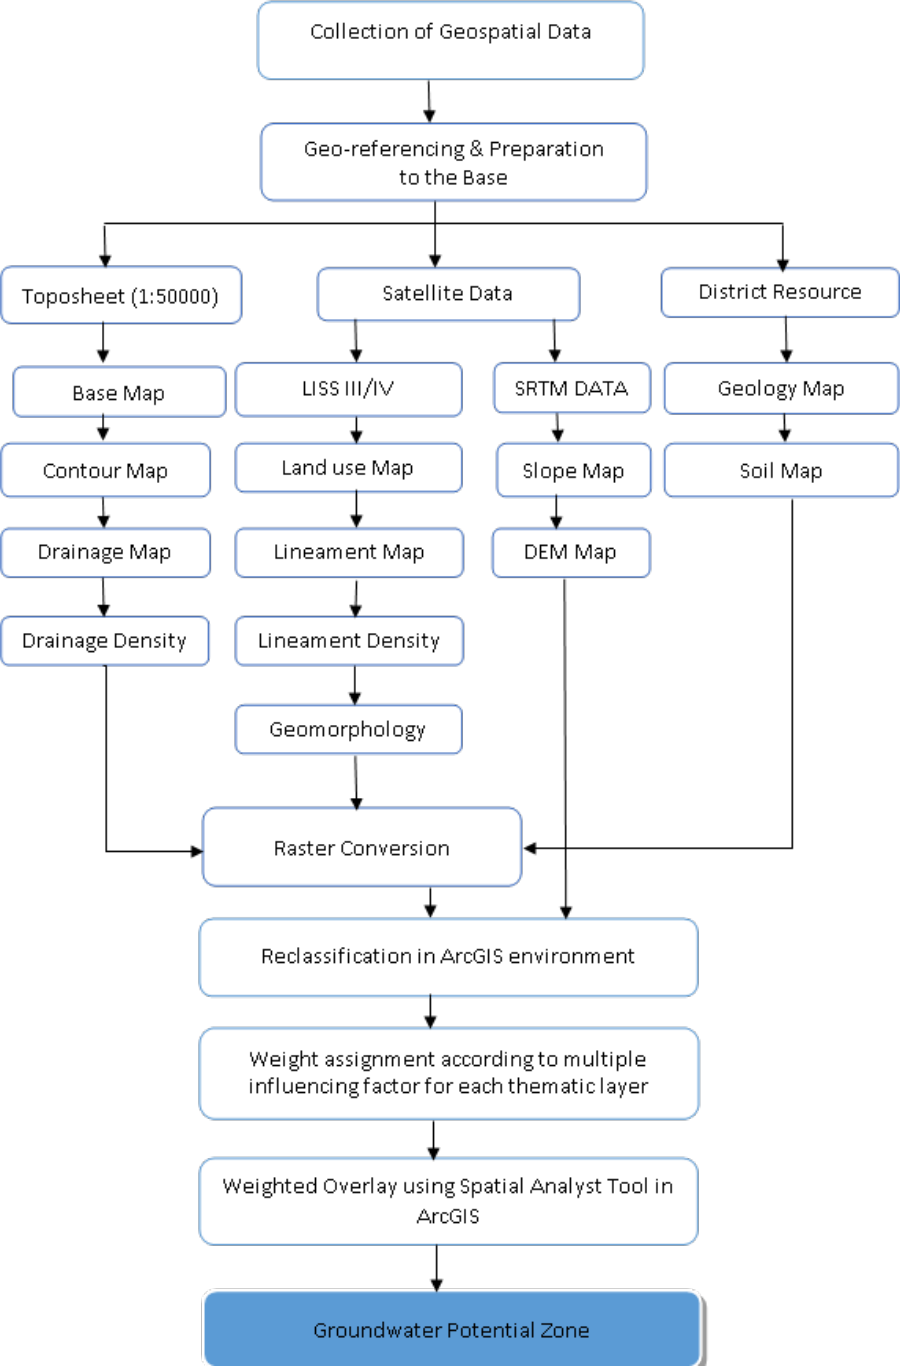 Figure 2
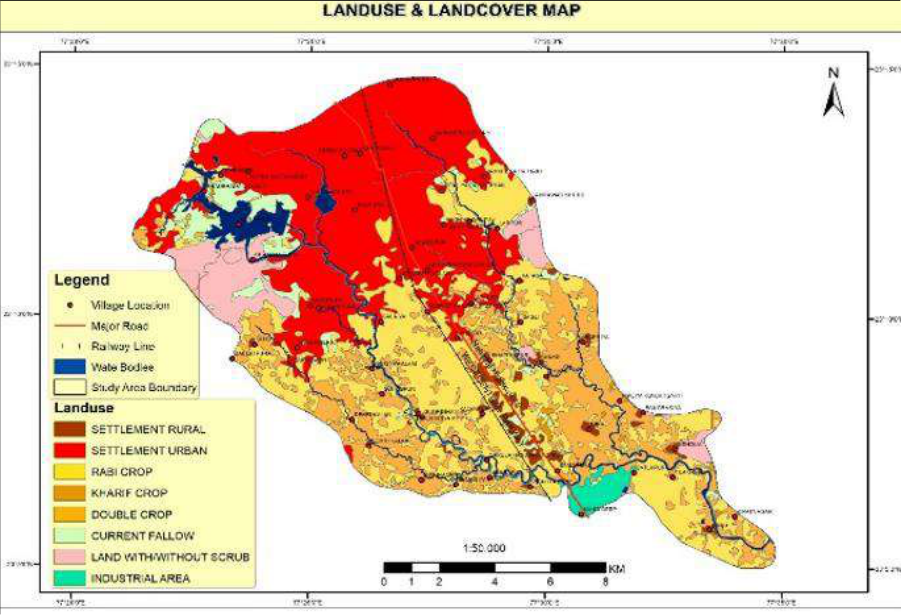 Figure 4
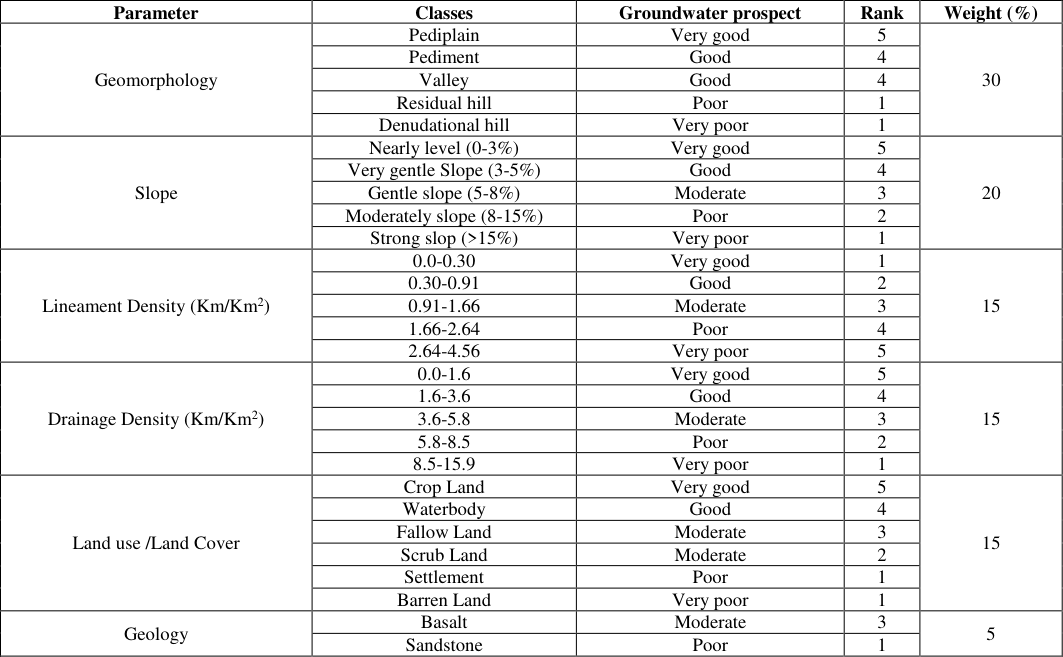 Table 1
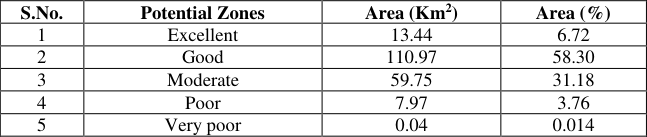 Table 2
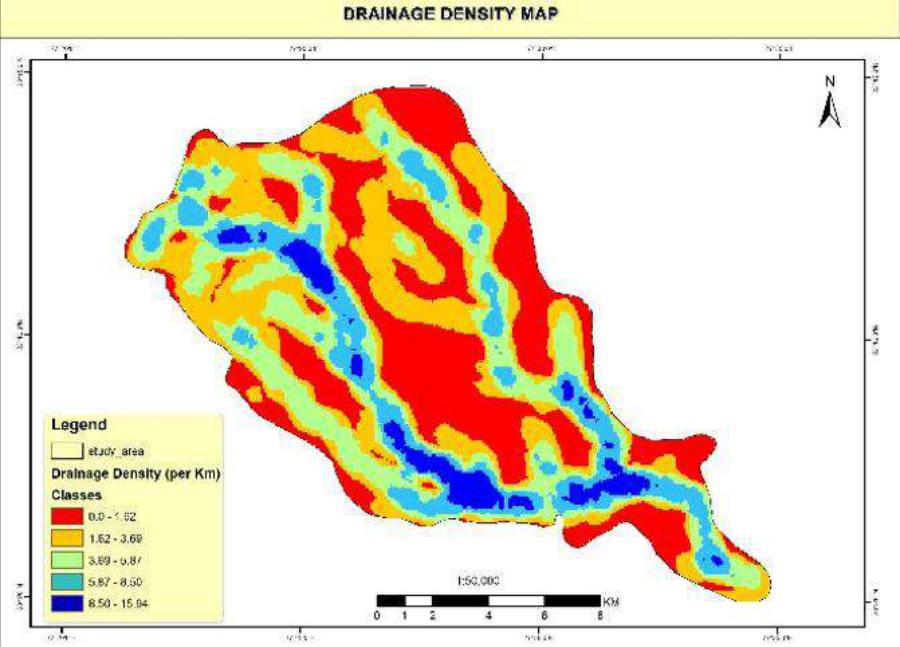 Figure 5
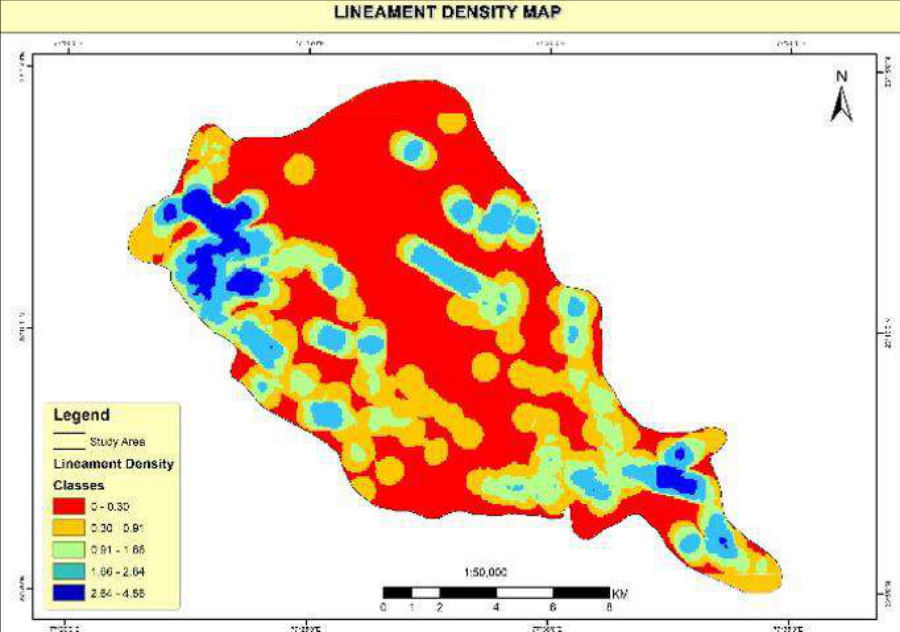 Figure 6
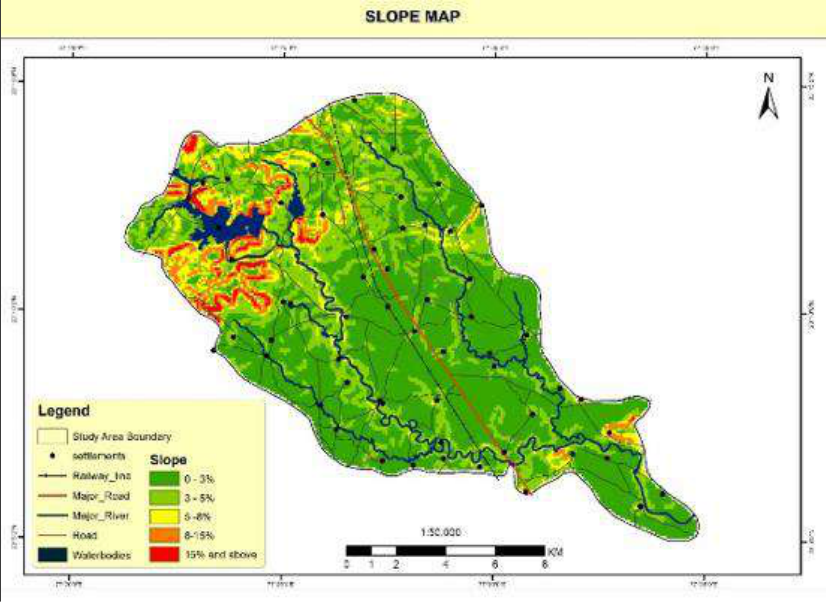 Figure 7
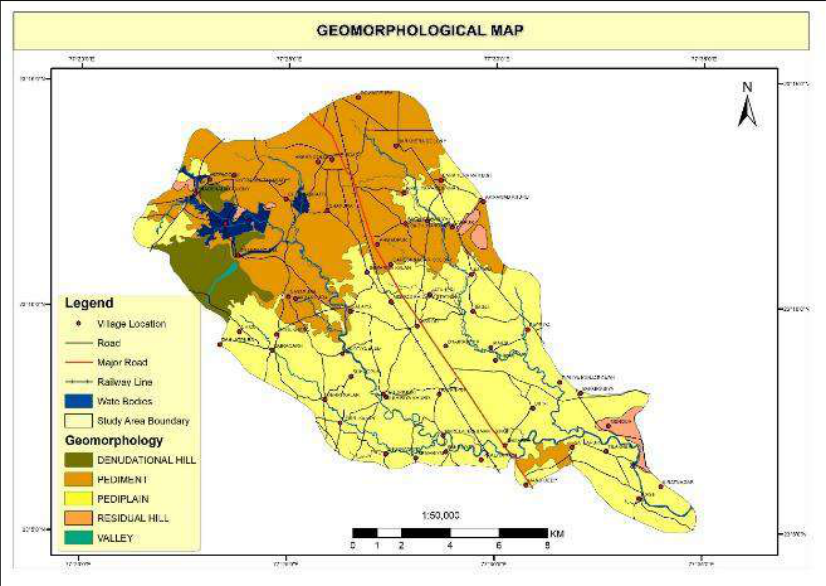 Figure 8
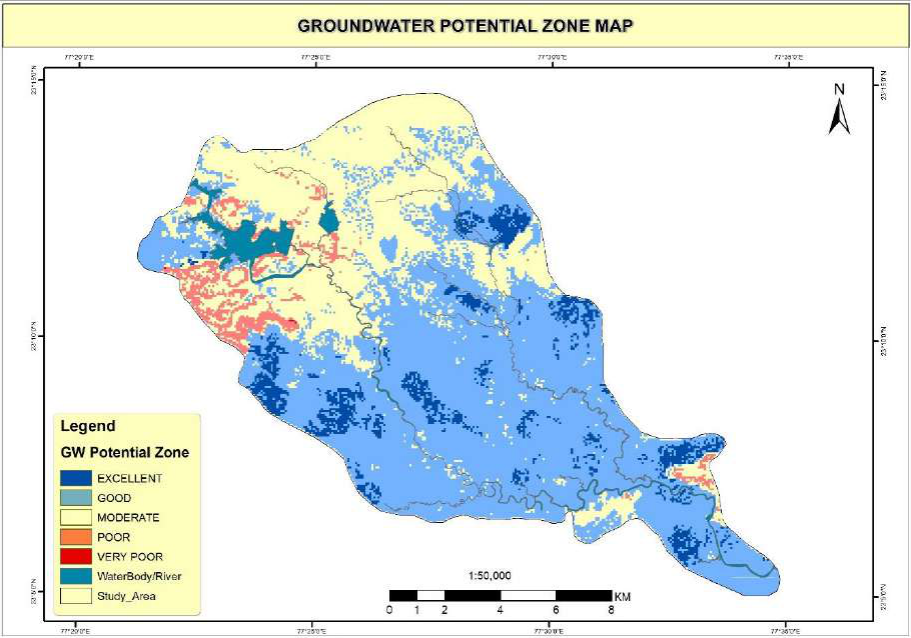 Figure 9
Introduction
Water is one of the most widely distributed and most important resources of the mother earth. Water is most essential to life and is next to air in its importance. With the development of civilization and industrialization, our water demand has increased manifolds. The great variation, in rainfall in different parts of India and the gigantic differences in the physical features and geological formations in different parts of the country renders the problem of development of water resources. In our country, more than 90% of the rural and 30% of the urban population depends for drinking water on groundwater resources (Reddy et al, 1996) [16] . The major cities and towns in India, are facing serious problems related to water table depletion and quality deterioration (Gautam et al, 2015; Kumar and Kumar, 2010; Verma et al, 2016) [4,10,17] . The decline in water table and the adverse impact of industrial, agricultural activities, urbanization and global climate change are increasing the pressure on existing groundwater resources. Therefore, groundwater development and management has become a priority in the field of water resource research. In present times, the RS & GIS is reliable, cost effective and time saving tool for water conservation and management. Groundwater potential zone mapping can be easily done by employing Remote Sensing & Geographical Information System (RS & GIS) techniques. Various thematic maps like geology, geomorphology, drainage density, slope, land use/land cover etc. can easily generated. Many researchers (Chaudhary et al, 1996; Mishra et. al, 2010; Javed and Hussain, 2009; Narendra et al, 2013; Nandish Kumar et al, 2014) [3,12,9,14,13] have used this technique for groundwater potential zone mapping. The different hydrogeological themes can be used to identify the groundwater potential zones of the present study area. Various thematic maps like geology, geomorphology, land use and land cover, slope, lineament density, drainage density of Kaliasot watershed have been generated. These thematic maps have been integrated by using GIS software to prepare groundwater potential zone map of the area.
Study Area
The (study area) Kaliasot River has originated at Bhadbhada spillway of upper Lake of Bhopal. It is situated in Huzur Tehsil of Bhopal district & Gairatganj of Raisen district Madhya Pradesh, (India) bounded by latitudes 23 0 6' to 23 0 13' and longitudes 77 0 23' to 77 0 35' (Fig. 1) covered in Survey of India (SoI) topo sheet no. 55 E/8 & 55 E/12. The total geographical area is 194 sq.km. The holy river Betwa forms the Southern boundary of the study area. Delhi-Bombay and Delhi-Chennai railway route and National Highway no. 12 passes through the area, which connect the area from other part of the country. It is bounded by Vidisha district on the north, Raisen District on the east and Sehore District on the Southwest. The watershed covering the part of Mandideep block of the Raisen district of Madhya Pradesh, which is highly industrialized and the water resources may be contaminated due to improper disposal of municipal, urban and industrial waste. Location map of the study area is given in Fig. 1. The average annual rainfall is about 1009.29mm.
Materials and Methods
During the study, Survey of India (SOI) Toposheet No's 55 E/8 and 55 E/12 were Geo-referenced and processed in ArcGIS environment for the preparation of the major streams, roads, important settlements, drainage and drainage density map of the area. Geology and Geomorphology has been derived by processing of the GSI, District Resource Map (DRM) edition 2002, from which various rock units and landforms were extracted. National Bureau of Soil Survey and Land use Planning (NBSS & LUP) of Indian Council of Agricultural Research (ICAR, 1996) [15] map has been analyzed for the preparation of soil map of the area. Topography has been derived by processing of the Shuttle Radar Topography Mission (SRTM) satellite imagery. Land use/ land cover (LULC) mapping were carried out by processing of the LISS III imagery (2017 & 2018) supported by Google Earth visual image interpretation. Lineament mapping was carried by using LISS III imagery with resolution of 23.5 m. All the data sets were converted in to digital format from their source map. Further, all vector layer is converted into raster format for further analysis in GIS environment. All the thematic layers have been assigned ranks and weightages depending upon their influence factors on groundwater and overlay to evaluate suitable groundwater potential zone. The flow sheet of methodology adopted in the present study is given in Fig.
Results & Discussion
For present study, various permutation combination has been carried out during analysis and the results have been discussed. The results of whole study has been taken for identification of Groundwater Potential Zone Mapping is given below.
Geology
Geological mapping is used as basis for the study of groundwater condition in an area. Geology of the area has been extracted by processing of the Geological Survey of India, (GSI, 2002) [5] resource map supported by field observations. The various lithological units exposed in the area includes; Basalt which accounts (156.23km 2 ) of the total geographical area followed by Bhander Sandstone (37.59km 2 ) are exposed in the area (Fig. 3). The major portion of the area is covered by Bhander sandstone and basalt. Alluvium has occupied the central most part of the area with gentle slope and represents good groundwater formation zone. The highest rank of 5 is given to alluvium because of holding shallow aquifers and having good groundwater recharge potential. On the other hand low ratings of 1 and 3 were given to basalt and Bhander sandstone respectively, because of their impervious to nature. Sandstone has occupied the periphery hilly tract of area with steep slope supporting to less groundwater recharge. Basalt lava flows are exposed at foothills parts of the area, by virtue of their hydrological properties, it discourages to groundwater recharge.
Land use/Land cover (LU/LC)
Land use land cover map has been prepared from satellite data analysis in ArcGIS (Fig. 4). In land use/land cover analysis, six major classes were identified in the area which includes Crop land, Fallow land, settlement, scrubland, barren land and water body. LU/LC has great influence on recharge of groundwater. Concrete impervious or built-up structures reduce infiltration of water, whereas good vegetation and water bodies enhance infiltration of water to aquifers. In this way, LU/LC plays a key role in groundwater recharging. Weightage and rating assigned to this parameter are given in Table 1. In the study, maximum rating of 5 was given to Crop Land and minimum rating of 1 has been given to settlement area.
| Parameter | Classes | Groundwater prospect | Rank | Weight (%) |
|---|---|---|---|---|
| Geomorphology | Pediplain | Very good | 5 | 30 |
| Pediment | Good | 4 | ||
| Valley | Good | 4 | ||
| Residual hill | Poor | 1 | ||
| Denudational hill | Very poor | 1 | ||
| Slope | Nearly level (0-3%) | Very good | 5 | 20 |
| Very gentle Slope (3-5%) | Good | 4 | ||
| Gentle slope (5-8%) | Moderate | 3 | ||
| Moderately slope (8-15%) | Poor | 2 | ||
| Strong slop (>15%) | Very poor | 1 | ||
| Lineament Density (Km/Km2) | 0.0-0.30 | Very good | 1 | 15 |
| 0.30-0.91 | Good | 2 | ||
| 0.91-1.66 | Moderate | 3 | ||
| 1.66-2.64 | Poor | 4 | ||
| 2.64-4.56 | Very poor | 5 | ||
| Drainage Density (Km/Km2) | 0.0-1.6 | Very good | 5 | 15 |
| 1.6-3.6 | Good | 4 | ||
| 3.6-5.8 | Moderate | 3 | ||
| 5.8-8.5 | Poor | 2 | ||
| 8.5-15.9 | Very poor | 1 | ||
| Land use /Land Cover | Crop Land | Very good | 5 | 15 |
| Waterbody | Good | 4 | ||
| Fallow Land | Moderate | 3 | ||
| Scrub Land | Moderate | 2 | ||
| Settlement | Poor | 1 | ||
| Barren Land | Very poor | 1 | ||
| Geology | Basalt | Moderate | 3 | 5 |
| Sandstone | Poor | 1 |
Table text extracted from the original PDF; superscript letters are shown inline. The original table image is below.
View original table image
Drainage Density
Drainage density map has been prepared and is presented in Fig. 5. Drainage and drainage density are major factors, which affect the ground water occurrence in the area. The surface water runoff is directly proportional to drainage density. If drainage density is higher, less will be the infiltration of water into the ground (Horton, 1945) [8] . High drainage density has been observed towards the northwest and southwest of the watershed along with Kaliasot River. Rating and weightage have been assigned to drainage density are given in Table 1. Based on drainage density, it is classified into five classes i.e. 0-1.6km -1 , 1.6-3.6km -1 , 3.6-5.8km -1 , 5.8-8.5km -1 , 8.5-15.9km -1 . Accordingly, these classes have been assigned very good, good, moderate, poor and very poor categories respectively.
Lineament Density
Lineaments are straight linear elements visible at the Earth's surface as a significant "lines of landscape" (Hobbs, 1904) [7] . In present study area lineaments are extracted from satellite image. Lineament mapping was carried by using LISS III imagery with resolution of 23.5m. Lineament density (km/km2) map has been prepared using the line density tool of ArcGIS spatial analysis tool. Lineament density is indirectly representing the groundwater recharge zone because the presence of linear structural features being favourable paths for good groundwater recharge and storage. Areas with dense lineaments are suitable for groundwater development. Lineament density map (Fig. 6) of the area has been prepared. Highest rank of 5 has been given to lineament class with lineament density >2 and low ranking of 1 is given to lineament class with lineament density between 0 to 1. Rating and weightage assigned to lineament density are given in Table 1.
Slope Analysis
In case of groundwater, the areas where the slope amount is low are capable of holding the rainwater and allow percolation into the ground, which can recharge the groundwater (Chaudhary and Kumar, 2018) [11] . Low or gentle slope areas allow water to accumulate for long time which enhances the groundwater recharge (Ahirwar et al, 2020) [1] . Slope of the area has been derived by processing the SRTM DEM data and is shown in Fig. 7. Slope in the area varies from 6 to >12%. Higher slope areas with slope > 12% & upto 29%are present at the northwest of the watershed, whereas low slope is seen in the middle & lower part of area. Rating and weightage to each slope class were assigned is given in Table 1. The highest rank of 5 was given to slope class 0-1%, whereas as the lowest rank of 1 is assigned to slope classes >12%.
Geomorphology
Geomorphology is the study of the form of the earth (landform), its description and genesis (Gupta, 2003). It is a branch of earth science, which has grown after the advent of aerial photographs and satellite data. Geomorphologic landscape features of the area have been derived by processing of the GSI map (GSI, 2002) [15] . Geomorphology map (Fig. 8) has been prepared by extraction of the each landscape feature present in the area using ArcGIS. Geomorphology, along with information on soil, water and vegetation has become one of the essential inputs in planning for various developmental activities. Geomorphology of an area depends upon the structural evolution of geological formation. Geomorphology reflects various landform and structural features. Many of the features are favourable for the occurrence of Groundwater and classified in terms of groundwater potentiality.
Assigning Rank and Weights
One of the classic problems in decision theory or multiparameter analysis is the determination of the relative importance (weights) of each parameter with respect to each other. This is a problem, which requires human judgment supplemented by mathematical tools. As not all parameters can be weighted equal for the suitability assessment, it is essential that a weighted method needs to be employed where the relative importance of the parameters defines the weights. Class wise rank and weight value were assigned for different thematic maps. All the thematic maps are converted into raster format and superimposed by weighted overlay method. For assigning the weight, the slope and geomorphology were assigned higher weight, whereas the lineament density and drainage density were assigned lower weight. After assigning weights to different parameters, individual ranks are given for sub variable. In this process, the GIS layer on lineament density, geomorphology, and slope and drainage density were analysed carefully and ranks are assigned to their sub variable (Asadi et al, 2007, Yammani, 2007) [2,18] . The maximum value is given to the feature with highest groundwater potentiality and the minimum given to the lowest potential feature. The landforms such as moderately dissected plateau are given lower rank and highest value is assigned for pediplain. As far as slope is concerned, the highest rank value is assigned for gentle slope and low rank value is assigned to higher slope. The higher rank factors are assigned to low drainage density because the low drainage density factor favours more infiltration than surface runoff. Lower value followed by higher drainage density. Among the various lineament density classes the very high lineament density category is assigned higher rank value as this category has greater chance for groundwater infiltration. Lower value is assigned for very low lineament density. In LULC high rank is assigned to crop land and low value is assigned to barren land. The overall analysis is tabulated in Table 1. Finally, all the parameters are superimposed by weighted overlay in order to get final integration of all the parameters influencing groundwater movement and occurrence in the region. The output thus generated as a final weighted map, which is further classified into five classes (Table 2).
| S.No. | Potential Zones | Area (Km2) | Area (%) |
|---|---|---|---|
| 1 | Excellent | 13.44 | 6.72 |
| 2 | Good | 110.97 | 58.30 |
| 3 | Moderate | 59.75 | 31.18 |
| 4 | Poor | 7.97 | 3.76 |
| 5 | Very poor | 0.04 | 0.014 |
Table text extracted from the original PDF; superscript letters are shown inline. The original table image is below.
View original table image
Very Good to Good
This zone is specially considered for buried pediments of Basalt having gentle slope and double crop area. Wells observed in this unit are having less water table fluctuation. The area is characterized by vesicular and basalt with considerable depth of weathering.
Good to Moderate
This zone is found mainly in the northern to central portion of the watershed, covered by weathered vesicular basalt filled with secondary fillings having gentle slope.
Geomorphologically the area is marked as buried pediment, which is almost flat with little undulations and maximum cultivation.
Moderate to Poor
This zone is mainly confined to areas having moderate slopes and minor lineaments, which are playing major role to develop the semi confined conditions, sandstones are coming under this category and water is moderately available only along lineaments.
Poor to Very Poor
North western boundary of watershed is emerged as poor zone for groundwater potential. Denudational hills and structural hills of Vindhyan's sandstone come under poor potential. All these hills are covered by open forest and scanty scrubs.
Conclusion
Based on satellite imagery six thematic maps such as drainage density, slope, geology, geomorphology, lineament density and land use/land cover have been prepared and interpreted in GIS environment and the weightage has been assigned to each thematic map on the basis of characteristics of groundwater potentiality. Further, these maps are integrated to give final product of groundwater potential map of the study area. Based on these five classes of groundwater occurrences have been evaluated. The given study area is classified in to 1. Excellent, comprising total area of (13.44km 2 ) 2. Good, comprising total area of (110.97km 2 ) 3. Moderate, comprising total area of (59.75km 2 ) 4. Poor, comprising total area of (7.97km 2 ) 5. Very poor, comprising total area of (0.04Km 2 )
Groundwater potential zones and indicated in Fig. 8. The area belonging to Good potential zone category comprising of maximum area of the order of 110.97km 2 followed by Moderate & Excellent potential zone have been suggested for groundwater exploration potential in the area of present study.
The final output of groundwater prospects map for Kaliasot watershed will be helpful in utilizing the land according to its capability and fulfilling the demand of water. The recommended treatments in the project are purely on scientific and technical basis that can be attempted in future for similar studies.
Figures and tables from the paper
References
18 in the original paper- Ahirwar, Shobharam, Malik MS, Ahirwar R, Shukla JP. Application of Remote Sensing and GIS for Groundwater Recharge Potential Zone Mapping in Upper Betwa Watershed, Jour. Geol. Soc. India. 2020; 95:308-314.
- Asadi SS, Vuppala P, Reddy MA. Remote sensing and GIS techniques for evaluation of groundwater quality in municipal corporation of Hyderabad (Zone-V), India. Int. J Environ Res Public Health. 2007; 4(1):45-52.
- India).International Archives of Photogrammetry and Remote Sensing. 1996; 31(B6):18-23.
- Gautam SK, Maharana C, Sharma D, Singh AK, Tripathi JK, Singh SK. Evaluation of groundwater quality in the Chotanagpur plateau region of the Subarnarekha river basin, Jharkhand State, India. Sustain. Water Qual. Ecol. 2015; 6:57-74.
- GSI. Geological Survey of India (GSI) district resource map, Edition. GSI, 2002.
- Gupta RP. Remote Sensing Geology. 2nd ed. Springer, Berlin, Germany, 2003, 460-477.
- Hobbs WH. Lineaments of the Atlantic border region. Geol. Soc. Am. Bull. 1904; 15:483-506.
- Horton RE. Erosional Development of Streams and their Drainage Basin, Hydrophysical approach to Quantitative Morphology. Geol. Soc. Amer. Bull. 1945; 56:275-370.
- Javed A, Hussain WM. Delineation of groundwater potential zones in Kaknud Watershed, Eastern Rajasthan, Using Remote Sensing and GIS Techniques. Jour. Geol. Soc. India. 2009; 73(2):229-236.
- Kumar B, Kumar U. Integrated approach using RS and GIS techniques for mapping of ground water prospects in Lower Sanjai Watershed, Jharkhand. Int. J Geomatics Geosci. 2010; 1(3):587-598.
- Chaudhary BS, Kumar S. Identification of Groundwater Potential Zones using Remote Sensing and GIS of K-J Watershed, India Jour. Geol. Soc. India. 2018; 91:717721.
- Mishra RC, Chandrasekhar B, Naik RD. Remote Sensing and GIS for Groundwater Mapping and Identification of Artificial Recharge Sites. Geo Shanghai Internat. Conf, 2010, 216-223.
- Nandish Kumar L, Karthick M, Arul PA, Lokpal BDD, Revathy SS, Sureshbabu S. Mapping the Groundwater Potential Zone for Bengaluru Urban District. Internat. Jour. Computer Science and Information Technologies. 2014; 5:1427-1431.
- Narendra K, Rao NK, Latha,SP. Integrating remote sensing and GIS for identification of groundwater prospective zones in the Narava basin, Visakhapatnam region, Andhra Pradesh. Jour. Geol. Soc. India. 2013; 81(2):248-260.
- National Bureau of Soil Survey and Land Use Planning, (NBSS & LUP), ICAR, Nagpur. Soils of Madhya Pradesh. NBSS Publ, 1996, 59.
- Reddy PR, Vinod K, Seshadri K. Use of IRS-1C data in groundwater studies. Curr. Sci. 1996; 70:600-05.
- Verma DK, Bhunia GS, Shit PK, Kumar S, Mandal J, Padbhushan R. Spatial variability of groundwater quality of Sabour block, Bhagalpur district (Bihar, India), 2016. Appl. Water Sci. https://doi.org/10.1007/s13201-016-0380-9.
- Yammani S. Groundwater quality suitable zones identification: application of GIS, Chittoor area, Andhra Pradesh, India. Env. Geol. 2007; 53(1):201-210.
Cited by 1
From OpenAlex, OpenCitations and reference lists read by Scinovex
- Recharging of groundwater by the geophysical method based on resistivity meter, a case study of Naya Raipur Chhattisgarh
Ashish Kumar, Ravi Chaurey, Ram Moorat Singh, Kundaleshwar Panigrahi, Kutubuddin Beg · International Journal of Geography Geology and Environment · 2021
To maintain the balance in the water table, artificial recharge is being adopted in many regions. For this, numerous studies have been carried out. In the present study, vertical electric soundings have been carried out in the different locations of surrounding Atal Nagar, Naya Raipur at 09 random sites to understand the nature and extent of the aquifer and to find out the groundwater potential zone for rainwater harvesting sites. The main objective of this study is to identify the possibility of an appropriate recharge structure at a suitable location. From the interpretation of the VES curve