
Research article · 2018 · Full text
International Journal of Statistics and Applied MathematicsStatistical hybridization of normal and Weibull distributions with its properties and applications
Volume 3(5) · Pages 62–68
Research areasStatistical Distribution Estimation and ApplicationsHydrology and Drought Analysis
Abstract
Author-writtenThe normal distribution is one of the most popular probability distributions with applications to real life data. In this research paper, an extension of this distribution together with Weibull distribution called the Weimal distribution which is believed to provide greater flexibility to model scenarios involving skewed data was proposed. The probability density function and cumulative distribution function of the new distribution can be represented as a linear combination of exponential normal density functions. Analytical expressions for some mathematical quantities comprising of moments, moment generating generating function, characteristic function and order statistics were presented. The estimation of the proposed distribution’s parameters was undertaken using the method of maximum likelihood estimation. Two data sets were used for illustration and performance evaluation of the proposed model. The results of the comparative analysis to other baseline models show that the proposed distribution would be more appropriate when dealing with skewed data.
Summary
Source-checkedPlain-language reading of the full paper, prepared with AI and checked against the text. Each point links to the authors' own words.
Why it matters
- The normal distribution is widely used for modeling real-life data. View evidence ↗
- New statistical distributions are developed to provide greater flexibility when existing models cannot properly fit certain datasets. View evidence ↗
- Extended probability distributions are needed across various fields, including medical sciences, engineering, and finance. View evidence ↗
The question
- The research aims to propose a new probability model called the Weibull-Normal (or Weimal) distribution by hybridizing the Weibull and Normal distributions. View evidence ↗
What they did
- The authors utilized the Weibull-G family of distributions, which is based on the odds ratio of failure rate, as the generator for the new model. View evidence ↗
- Maximum likelihood estimation was used to estimate the parameters of the proposed Weimal distribution. View evidence ↗
- The performance of the proposed model was evaluated using two illustrative datasets. View evidence ↗
What they found
- The Weimal distribution is negatively skewed, making it more suitable for modeling skewed real-life data than the symmetric normal distribution. View evidence ↗
- The Weimal distribution simplifies to a standard normal distribution when the parameters alpha and beta both equal 1. View evidence ↗
- The probability density function (pdf) of the Weimal distribution can be expressed as a linear combination of exponentiated normal density functions. View evidence ↗
- Comparative analysis indicates that the Weimal distribution is more appropriate than baseline models for skewed data. View evidence ↗
- The maximum likelihood estimates for the distribution's parameters cannot be solved analytically and require numerical iterative techniques, such as the Newton-Raphson method. View evidence ↗
What it means
- The authors conclude that the Weimal distribution successfully extends the classical normal distribution by incorporating skewness. View evidence ↗
- The authors state that the new distribution is versatile and analytically tractable. View evidence ↗
Visual summary
1 visualsIllustrations explain the paper; they do not show study data.
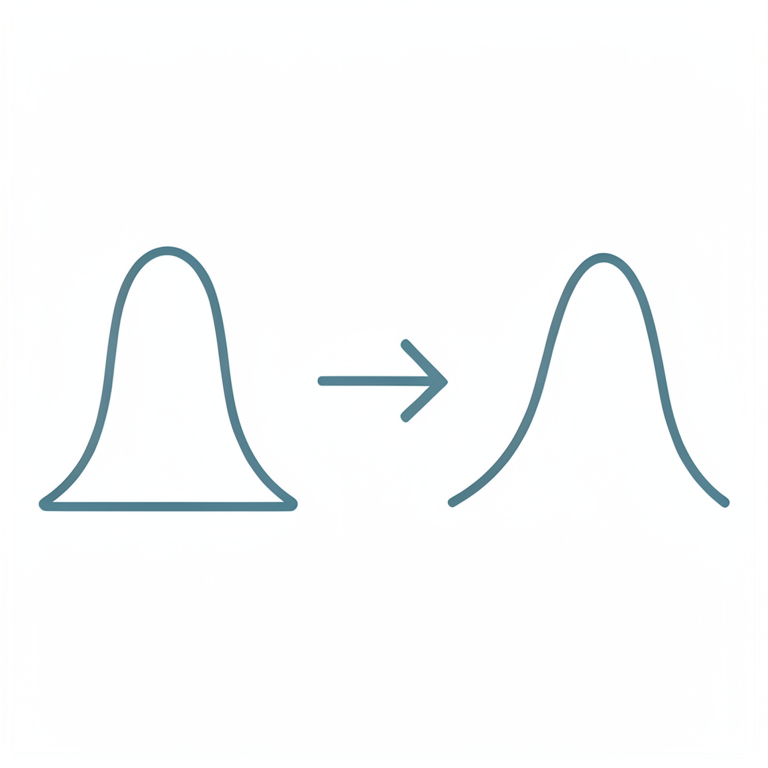
Comparison of Distribution Shapes
AI-generated conceptual illustration (mathematical probability density curves). It explains the idea and does not show study data.
View source evidence ↗Introduction
One of the main motivations for studying new families of statistical distributions lies in the increased flexibility of fitting various datasets that cannot be properly fitted by existing distributions. In many applied areas, such as environmental and medical sciences, engineering, biological studies, lifetime analysis, actuaries, economics, as well as finance and insurance; there is a clear need for extended forms of these distributions. The normal distribution is the most popular probability model having wider applications in solving real life problems. When the number of observations is large, it can serve as an approximation to other probability models. The normal distribution is also called Guassian distribution, named after the German Mathematician Carl Freidrich Gauss (1777-1855) who introduced it in connection with the theory of error. The probability density function (pdf) and the cumulative distribution function (cdf) of the normal distribution with location parameter -∞ < 𝜇 < ∞ and scale parameter 𝜎 > 0 are given respectively by: 𝑓(𝑥, 𝜇, 𝜎) =
Attempts to generalize the Normal distribution have led to the development of Skewed Normal distribution [1] , the Beta-Normal distribution [2] , the Generalized Normal distribution [3] , the Kumaraswamy-Normal distribution [4] , the McDonald-Normal distribution [5] , the modified Beta-Normal distribution [6] , the Gamma-Normal distribution [7] , the modified Gamma-Normal distribution [8] , the Kummer Beta-Normal distribution [9] , and a host of others. These distributions are proven to be more flexible than the classical Normal distribution when applied to the real life datasets.
Several generalized families of distributions have been proposed in the literature. For instance, the Beta-G [2] , the Kuraraswammy-G [4] , Transmutted family of distributions [10,Gamma-G (type 1) [11] , McDonald-G [12] , Gamma-G (type 2) [13] , Gamma-G (type 3) [14] , Log-Gamma-G [15] , Exponentiaited T-X [16] , Logistic-G [18] , Gamma-X and Weibull-X [19] , Logisitc-X [20] , Weibull-G [21] , Beta Marshall-Oikin family of distribution [22] , and many others are available in literature. The focus of this research article is the Weibull-G family of distributions [21] which can be obtained by using the odds ratio of failure rate because they highlighted the Normal as one of the distribution that can be obtained by their Weibull generator. The use of four-parameter distribution should be sufficient for most practical purposes, and at least three-parameter are needed in such distributions as stated in [23] , but doubted any noticeable improvement arising from including a fifth-or sixth parameter. The Weibull-G family of distributions have been adopted by several notable researchers among to generate known theoretical models such as the Weibull-Exponential distribution [24] , Weibull-rayleigh distribution [25] , and Weibull-Frechet distribution [26] . In this research paper, a proposition ofa probability model called a Weibull-Normal distribution, also to be known as Weimal distribution, which resulted from hybridizing Weibull and Normal distributions by utilizing the Weibull-G family generator proposed in [21] .
Given any continuous baseline distribution with 𝑐𝑑𝑓 𝐺(𝑥, 𝜉) and 𝑝𝑑𝑓 𝑔(𝑥, 𝜉) aiming at providing greater flexibility in modeling real-life datasets; a Weibull generalized family of distribution, according to [21], will have a 𝑐𝑑𝑓 𝐺(𝑥, 𝜉) defined by:
The above integral yields:
The corresponding 𝑝𝑑𝑓 is given by:
Where 𝑔(𝑥, 𝜉) and 𝐺(𝑥, 𝜉) are the respective p𝑑𝑓 and 𝑐𝑑𝑓 of the baseline distribution indexed by parameter vector𝜉, where 𝛼 > 0 𝑎𝑛𝑑 𝛽 > 0 are the scale and shape parameters respectively. Equation (5) gives the 𝑝𝑑𝑓 of any Weibull-G family of distribution and is most tractable when both 𝑐𝑑𝑓 and p𝑑𝑓 have simple analytic expressions. The major benefit of the Weibull-generator expressed in equation (3) lies in its ability to offer more flexibility to the extremes of the 𝑝𝑑𝑓 and this makes it more suitable for analyzing data with high degree of asymmetry.
The Weibull-Normal distribution
Taking into account the 𝑝𝑑𝑓 and 𝑐𝑑𝑓 of the normal distribution as given in equations ( 1) and (2) with location parameter 𝜇𝜖ℝ and dispersion parameter 𝛼 > 0. The respective 𝑐𝑑𝑓 and 𝑝𝑑𝑓 of the proposed four-parameter Weibull-Normal distribution can be obtained from equations ( 4) and (5) as follows:
The plots of the pdf and cdf of the new Weibull-Normal distribution for the selected parameter values and plotted and it was observed that the cdf of the Weibull-Noraml distribution increases as x increases and approaches one ax x gets larger. The different pdf plots of the Weimal distribution under different parameter values indicate that a it is negatively skewed distribution and hence it will be very appropriate in modeling skewed real-life datasets unlike the symmetric normal distribution. It is interesting to note that whenever α=β=1, then the Weimal distribution becomes normal and that all parameter values affect the graph of the pdf in different directions and different rates.
Useful Extensions
Extensions for equations ( 6) and ( 7) can be derived using the concept of exponentiated distributions as follows: Consider the exponentiated normal (EN) distribution as stated by Nadarajah and Kotz [6] with power parameter 𝑎 > 0 defined by 𝑌~𝐸𝑁(𝑎, 𝜇, 𝜎) with 𝑐𝑑𝑓 and 𝑝𝑑𝑓 given respectively by:
By expanding the exponential term in equation ( 7) using power series and utilizing the generalized binomial theorem while substituting, we can re-write equation (7) as:
Using the result in equation ( 8), we can now express the 𝑝𝑑𝑓 of the Weimal distribution as a linear combination of exponentiated (exponential-G) density functions as:
Denotes the exponential normal 𝑝𝑑𝑓(𝑋~𝐸𝑁(𝛽(𝑘 + 1) + 𝑗, 𝜇, 𝜎)) and the coefficient of the distribution 𝑤 𝑗,𝑘 is given by:
By integrating the 𝑝𝑑𝑓 in equation ( 9) with respect to𝑥, we obtain the corresponding 𝑐𝑑𝑓 as:
If 𝛽 > 0 is a real number (positive non-integer), we can expand the last term in (12) as:
Combining equations ( 12) and ( 13), the Weimal 𝑐𝑑𝑓 can be expressed from equation (12) as:
By differentiating equation ( 14) and changing indices, we can obtain the pdf of the Weimal distribution as:
𝑆 𝑟(𝛽(𝑘+1)+𝑗) and ∑ 𝔑 𝑟 ∞ 𝑟=0
= 1 Equation ( 15) is the pdf of the Weimal distribution defined as a linear combination of EN pdf. So now, several properties of the Weimal distribution can be obtained by exploition the properties of EN distribution.
Some Properties of the Weibull-Normal Distribution 3.1 Ordinary Moments
Moments are used to study some of the most important features and characteristics of a random variable such as mean (central tendency measure), variance (dispersion measure), skewness (Sk) and kurtosis (ku). Let 𝑋 1 , 𝑋 2 , … , 𝑋 𝑛 denote a random sample from the standard Weibull-Normal (Weimal) distribution obtained from equation (14) for 𝜇 = 0 and 𝜎 = 0, that is Weimal (𝛼, 𝛽, 0,1). The 𝑛 𝑡ℎ moment of X can be obtained as:
Now, substituting for ∅(𝑥) and ∅(𝑥) 𝑟-1 in equation ( 16), using binomial expansion and simplifying, we have:
Where /(𝑛, 𝑝) represents the (𝑛, 𝑝) 𝑡ℎ probability weighted moment (PWM) for any 𝑛 and 𝑝 positive integers of the standard normal distribution and is found as follows:
Now, according to Nadarajah [27] ,
Where equation ( 19) is the Lauricella function of type A [28] , Using these definitions in equation (19), equation ( 18) can be expressed as:
Combining equations ( 17) and ( 21), it can be expressed that the nth moment of the standard Weimal distribution in terms of the Lauricella function of type A are demonstrated by Nadarajah, Lima et al, Pescim et al. [3,6,8,9,27] 𝜇
The Central Moments
The nth central moments or moment about the mean of X, say 𝜇 𝑛 can be obtained as:
The variance of X is the central moment of order two (n=2) and is given as:
Where 𝜇 2 𝑖 and (𝜇 1 𝑖 ) 2 are the second ordinary moment and first ordinary moment squared respectively which could be obtained using equation (22) as follows:
For n=1, we therefore obtain the mean of the standard Weimal distribution from equation ( 22) as:
Similarly, when n=2, we derive the following expression for the second moment as:
Hence, the variance of 𝑋~𝑊𝑒𝑖𝑚𝑎𝑙 (𝛼, 𝛽, 0,1) which is the second central moment of X is obtained as:
Using equations ( 26) and ( 27) respectively.
The coefficient of skewness is the standardized third central moment of X about the mean and can be obtained using the expression:
Whereas the coefficient of kurtosis is the standardized fourth central moment of X about the mean and is given by
Where 𝜎 can be obtained using equation ( 28) while 𝜇 3 and 𝜇 4 are obtained using equation (23).
Moment generating function (mgf)
A general way of organizing all the moments into one mathematical object is called the mgf. In other words, the mgf generates the moments of X by differentiation, that is for any real number say k, the kth derivative of 𝑀 𝑥 (𝑡) evaluated at t=0 is the kth moment 𝜇 𝑘 of X.
The mgf of a standard Weimal random variable X (𝑋~𝑊𝑒𝑖𝑚𝑎𝑙 (𝛼, 𝛽, 0,1)) can be obtained as:
Where n and t are constants, t is a real number and 𝜇 𝑛 𝑖 denotes the nth ordinary moment of X and can be obtained from equation ( 22) as stated earlier.
Characteristics function (cf)
The characteristics function (cf) has many useful and important properties which give it a central role in statistical theory. Its approach is particularly useful in analysis of linear combination of random variables.
A representation for the cf is given by:
Simple algebra and power series expansion proves that:
Where 𝜇 2𝑛 𝑖 and 𝜇 2𝑛+1 𝑖 are the moments of X for n=2n and n=2n+1 respectively and can be obtained from 𝜇 𝑛 𝑖 in equation ( 25) as:
Order Statistics
Order statistics have been used in a wide range of problems including robust statistical estimation, detection of outliers, characterization of probability distribution, goodness of fit tests, entropy estimation, analyses of censored samples, reliability analysis, quality control and even researches bordering on strength of materials. In this section, closed form expression for the pdf's of the ith order statistics of the Weibull-Normal (that is, Weimal) distribution is derived. Suppose 𝑋 1 , 𝑋 2 , … , 𝑋 𝑛 is a random sample from the standard Weimal distribution and let 𝑋 1:𝑛 𝑋 2:𝑛 … . 𝑋 𝑖:𝑛 denote the corresponding order statistic obtained from this sample. The 𝑝𝑑𝑓, 𝑓 1:𝑛 (𝑥) of the ith order statistic can be obtained by:
Using equations ( 6) and ( 7), the 𝑝𝑑𝑓, 𝑓 1:𝑛 (𝑥) of the ith order statistic 𝑋 1:𝑛 can be expressed from equation (37) as:
Hence the pdf of the minimum order statistic X (1) and maximum order statistic X (n) of the Weimal distribution respectively given by:
Estimation of Parameters of Weimal Distribution
The estimation of the parameters of the Weimal distribution is presented using the method of maximum likelihood in this section. Let 𝑋 1 , 𝑋 2 , … , 𝑋 𝑛 be a random sample from the Wemal distribution with unknown parameter𝜃 = (𝛼, 𝛽, 𝜇, 𝜎) 𝑇 . The total loglikelihood function for 𝜃 is obtained from f(x) as follows:
Meanwhile differentiating 𝑙(𝜃) partially with respect to each of the parameters: 𝛼, 𝛽, 𝑎𝑛𝑑𝜎 and setting the results to zero gives the maximum likelihood estimates of the respective parameters. The partial derivative of 𝑙(𝜃) with respect to each parameter or the score function is given by:
Where the components of the score vector 𝑈(𝜃) = (𝑈 𝛼 , 𝑈 𝛽 , 𝑈 𝜇 , 𝑈 𝜎 ) are: 42) can be performed by using well established routines like nim-routine or optimize in the Rstatistical package. Setting these equation to zero, (that is, 𝑈(𝜃) = 0) and solving them simultaneously yieds the maximum likelihood estimate (𝑀𝐿𝐸)𝜃 ̂ 𝑜𝑓 𝜃. These equations cannot be solved analytically and therefore statistical softwares can be used to solve them numerically by means of iterative techniques like Newton-Raphson method.
Conclusion
In this research article, a new-four-parameter probability model named Weibull-Normal distribution (also to be known as Weimal distribution) resulting from the hybridization of two well-known probability models, namely: Weibull distribution and Normal distribution, is introduced. The new probability model extends the classical normal distributions by adding skewness to it. An obvious reason for generalizing a classical distribution is the fact that the generalization provides more flexibility to analyze reallife data. The new distribution has proved to be versatile and analytically tractable during the generalization process. The Weimal identity function can be expressed as aalinear combination of exponentiated normal density functions, thereby enabling
References
34 in the original paper- Azzalini A. A class of distributions which includes the normal ones. Scandinavian Journal of Statistics. 1985; 31:171-178.
- Eugene N, Lee C, Famoye F. Beta-Normal distribution and its applications. Communications in Statistics-Theory and Methods. 2002; 31:497-512.
- Nadarajah S. A generalized Normal distribution. Journal of Applied Statistics. 2005; 32:685-694.
- Cordeiro GM, De Castro M. A new family of generalized distributions. Journal of Statistical Computattion and Simulation. 2011; 81:883-989.
- Cordeiro GM, Cintra RJ, R'Ego LC, Ortega EMM. The McDonald Normal distribution. Pakistan journal of Statistics and Operation Research. 2012; 8:301-329.
- Nadarajah S, Kotz S. The exponentiated type distribution. Acta Applicandae Mathematicae Armsterdam. 2006; 92:97-111.
- Alzaatrch A, Famoye F, Lee C. The Gamma Normal distribution: Properties and Applications. Computational Statistics and Data Analysis. 2014; 69:67-80.
- Lima MS, Cordeiro GM, Ortega EMM. A new extension of the Normal distribution. Journal of Data Science. 2015; 13:385408.
- Pescim RR, Nadarajah S. The Kummer Beta Normal: A Skewed Model. Journal of Data Science. 2015; 13:509-532.
- Shaw WT, Buckley LR. The alchemy of probability distributions beyond Gram-Charlier expansions and a skew-kurtolic normal distribution from a rank transmutation map, 2007. Available at: http://library.wolfram.com/infocenter/Articles/6670/ alchemy.pdf
- Zografos K, Balakrishnan N. On families of Beta-and generalized Gamma-generated distributions and associated inference. Statistical Methods. 2009; 63:344-362.
- Alexander C, Cordeiro GM, Ortega EMM, Saraabia JM. Generalized Beta-generated distributions. Computational Statistics and Data Analysis. 2012; 56:1880-1897.
- Risitic MM, Balakrishman N. The Gamma-Exponentiated Exponential distribution. Journal of Statistical Computation and Simulation. 2012; 82:1191-1206.
- Torabi H, Montazari NH. The Gamma-Uniform distribution and its application. Kybernetika. 2012; 48:16-30.
- Amini M, Mirmostaface SMTK, Ahmadi J. Log-Gamma generated families of distributions. Statistics. 2014; 48(4):913-932.
- Alzaghal A, Lee C, Fomoye F. Exponentiated T-X family of distributions with some applications. International Journal of Probability and Statistics. 2013; 2:31-49.
- Cordeiro GM, Ortega EMM, da-Cunha DCC. The exponentiated generalized class of distribution. Journal of Data Science. 2013; 11:1-27.
- Torabi H, Montazari NH. The Logistic-Uniform distribution and its application. Communications in Statistics-Theory and Methods. 2014; 43:2551-2569.
- Alzaghal A, Fomoye F, Lee C. Weibull-Pareto distribution and its applications. Communications in Statistics-Theory and Methods. 2013; 42(9):1673-1691.
- Tahir MH, Cordeiro GM, Alzaatreh A, Mansoor M, Zubair M. The Logistic-X family of distributions and its applications. Communications in Statistics-Theory and Methods. 2016; 45(24):7326-7349.
- Alizadeh M, Cordeiro GM, De-Brito E, Demetrio CGB. The Beta Marshall-Olkin family of distributions. Journal of Statistical Distribution and Applications. 2015; 2(4):1-18.
- Johnson NL, Kotz S, Balakrishman N. Continuous Univariate Distributions, 2 nd Edition, John Wiley, New York, 1994, 1.
- Oguntunde PE, Balogun OS, Okagbue HI, Bishop SA. The Weibull-Exponential Distribution: Its Properties and Applications. Journal of Applied Science. 2015; 15(11):1305-1311.
- Merovci F, Elbaral I. Weibull-Rayleigh Distribution: Theory and Applications. Applied Mathematics and Information Sciences. 2015; 9(5):1-11.
- Afify MZ, Yousof HM, Cordeiro GM, Ortega EMM, Nofal ZM. The Weibull-Frechet distribution and its applications. Journal of Applied Science. 2016; 43(14):2608-2626.
- Nadarajeh S. Explicit expressions for the moments of order Statistics. Statistics and Probability Letters. 2008; 78(2):196-205.
- Exton H. Handbook of Hypergeometic integrals: Theory, Applications, Tables, Computer programs. New York; Halsted Press, 1978.
- Smith RL, Naylor JC. A comparison of maximum likelihood and Bayesian estimators for the three-parameter Weibull distribution. Applied Statistics. 1987; 36:358-369.
- Barreto-Souza WM, Cordeiro GM, Simas AB. Some results for the Beta-Frechet distribution. Communications in StatisticsTheory and Methods. 2011; 40:798-811.
- Afify AZ, Aryal G. The Kummaraswammy exponentiated Frechet distribution. Journal of Data Science. 2016; 6:1-19.
- Nicholas MD, Padgen WJ. A bootstrap control chart for Weibull percentiles. Quality Reliabilty Eng. Int. 2006; 22:141-151.
- Cordeiro GM, Lemonte AJ. The 𝛽-Birnbaum-Saunders distribution: An improved distribution for fatigue life modeling. Computational Statistics and Data Analysis. 2011; 55:1445-1461.
- Al-Aqtash R, Lee C, Famoye F. Gumbel-Weibull distribution: Properties and Applications. Journal of Modern Applied Statistical Methods. 2014; 13:201-225.
- Afify AZ, Nofal WM, Butt NS. Transmuted complementary Weibull-Geometric distribution. Pakistan Journal of Statistics and Operation Research. 2014; 10:435-454.