
Research article · 2019 · Full text
International Journal of Agriculture and NutritionQuality evaluation of biscuit from wheat-tiger nut composite flour
Volume 1(4) · Pages 24–29 · DOI: 10.33545/26646064.2019.v1.i4a.19 ↗
Research areasNuts composition and effects
Abstract
Author-writtenThe quality evaluation of biscuit from wheat-tiger nut composite flour was carried out. Biscuit was prepared from varying proportion of 100%, 90%, 80%, 70%, and 60% wheat flour substituted with 0%, 10%, 20%, 30% and 40% tiger nut flour respectively. The biscuit samples were analyzed for the chemical composition, physical, sensory and functional properties on the blends. The tiger nut flour addition increased (p
Summary
Source-checkedPlain-language reading of the full paper, prepared with AI and checked against the text. Each point links to the authors' own words.
Why it matters
- Biscuits are widely consumed, low-cost processed foods. View evidence ↗
- Tiger nut (Cyperus esculentus) is an under-utilized crop characterized by a sweet and nutty flavor. View evidence ↗
- In some regions, wheat flour must be imported because local soil and climate conditions do not support its growth. View evidence ↗
The question
- The study aimed to evaluate the quality of biscuits made from a composite flour of wheat and tiger nut. View evidence ↗
What they did
- Biscuits were prepared using five different flour blends, with wheat flour levels ranging from 100% down to 60% and tiger nut flour substitution ranging from 0% up to 40%. View evidence ↗
- The biscuits were cut to a 50mm diameter and baked at 180°C for 10 minutes. View evidence ↗
- A panel of 15 members used a 9-point Hedonic scale to evaluate the taste, texture, color, and overall acceptability of the biscuits. View evidence ↗
What they found
- The bulk density of the composite flours ranged from 0.67 to 0.76 g/ml. View evidence ↗
- The moisture content of the produced biscuits ranged between 4.64% and 5.16%. View evidence ↗
- Protein content increased as more tiger nut flour was added, with values ranging from 8.61% to 9.88%. View evidence ↗
- Fat content increased with the addition of tiger nut flour, ranging from 16.65% to 17.85%. View evidence ↗
- The addition of tiger nut flour reduced the carbohydrate levels, which ranged from 60.85% to 64.53%. View evidence ↗
- While nutritional content increased, the overall sensory acceptability of the biscuits decreased as the level of tiger nut flour substitution increased. View evidence ↗
What it means
- The authors concluded that biscuits made with 10% tiger nut flour were the most acceptable to consumers. View evidence ↗
- The authors recommend using tiger nut-wheat composite flour to lower production costs and enhance the nutritional value of biscuits. View evidence ↗
Visual summary
1 visualsIllustrations explain the paper; they do not show study data.
Flour Blend Ratios
AI-generated conceptual illustration (wheat flour and tiger nut flour). It explains the idea and does not show study data.
View source evidence ↗Figures & tables
From the original paper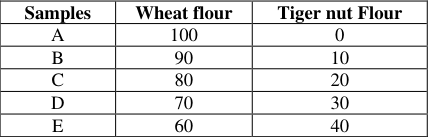 Table 1
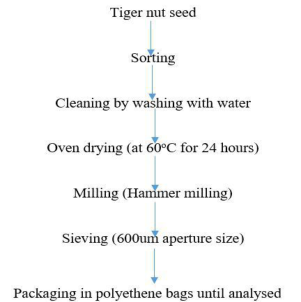 Figure 1
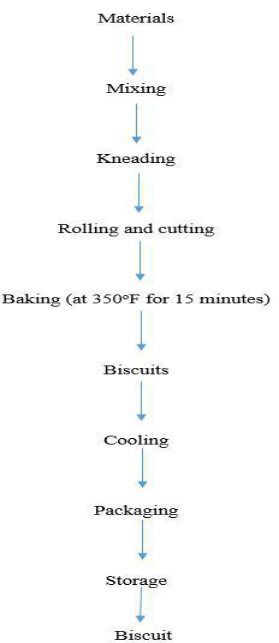 Figure 2
 Table 2
 Table 3
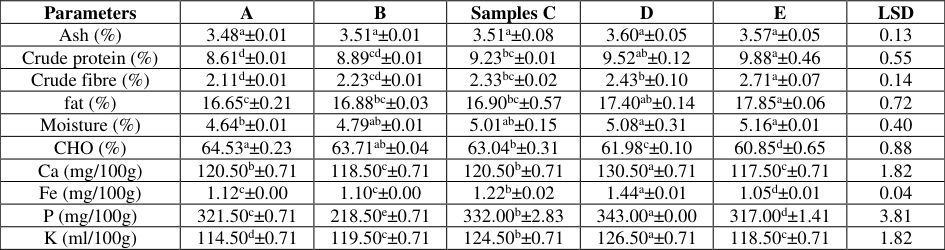 Table 4
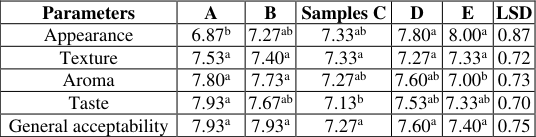 Table 5
Introduction
Wheat is a cereal plant grown all over the world which is very useful and nutritious. It is second only to rice as the main human food crop [1] . The first cultivation of wheat occurred about 10, 000 years ago, as part of the 'Neolithic Revolution', which saw a transition from hunting and gathering of food to settled agriculture. The kernel of wheat consists of the wheat germ and the endosperm, which is full of starch and protein [2] . Usually the whole grain is milled to leave just the endosperm for white flour, while the by-products of bran and germ are discarded. It has been shown that the whole grain is a concentrated source of essential nutritional components such as vitamins, minerals, protein, fat and fiber while the refined grain is mostly starch [3,4] . Wheat, is perhaps the most popular energy grain for the production of confectionary products, because of the unique properties of its protein (gluten) which combines strength and elasticity required to produce bread, biscuits, cakes and pastries such as spaghetti, macaroni and noodles of desirable texture and flavour [3,5] . The Cyperaceae specie are monocotyledonous plants which include up to 4000 species worldwide [6] . The Cyperaceae family is of very little economic value with the exception of Cyperus papyrus which is used in the manufacture of paper and Cyperus esculentus (tiger nut) which is edible [7] . Tiger nut is a weed plant of tropical and Mediterranean regions. It is mainly consumed after being soaked in water for tenderization or blanched as a traditional snack food or roasted and grinded in powder form as a drink. Tiger nut (Cyperus esculentus) also known as Aya in Hausa and Shoho in Tiv language is an under-utilized crop which has a sweet and nutty taste. The tubers are edible; they can be eaten raw, dried, roasted, prepared as tiger nut milk or oil, used as a composite in the production of biscuits, bread and other bakery products used in making jams, beer and as a flavouring agent in ice cream. According to Anderson et al. [8] , tiger nut has been reported to be high in dietary fiber and is effective in the prevention and treatment of a lot of diseases, not excluding colon cancer, coronary heart diseases, gastro intestinal disorders, obesity and diabetics. Tiger nut oil is a rich source of quality oil and has moderate amounts of protein. It is also a rich source of some useful minerals such as iron and calcium which are essential to body growth and development [9] . Furthermore, tiger nut contains more essential amino acids than those proposed in the protein standard by the [10] for satisfying adult needs [11] . Biscuit is a small hard, sweet, flat baked food made from flour, water, fat and sugar. It is a healthy snack made from palatable dough that is transformed into delicious product through the application of heat in an oven [12] . Biscuits are a nutritive source of fat and carbohydrates hence, are energy giving foods and a good source of protein [12] . Biscuits are one of the low cost processed foods, which are most widely consumed. It, amongst many snacks, has certain advantages, such as being cheaper than the conventional snack items, easy to use at home or even during travel, easily being available in massive variety of shapes, sizes, tastes, and packs, and appeals to all age groups. They have good shelf life at ambient temperature [13] . The consumption of biscuit and bread appears in the list of top ten daily consumed foods, and they are easily available and convenient to be enjoyed as snack [14] . Attempts were being made in recent days to improve the nutritional qualities and functionalities of biscuits, due to competition in the market for healthy, natural and functional products [15] . Biscuit requires a balanced nutritional value which can be enhanced by fortification and supplementation with a wide variety of protein rich cereal and pulses [16] . Flour is a powder which is gotten by grinding grains such as wheat, corn, rye, sorghum etc. or roots like cassava. Wheat flour is the most common flour used in baking food products. Composite flours found themselves at the center of attention in the European and International Cereal Research in the 1960s and 1970s. Most of the studies in this field were supported by the FAO (Food and Agricultural Organisation of the United Nations). These were three main reasons responsible for this and they include a steadily growing population, changes in eating habits and an overall increase in income. Because the climatic conditions and soil did not favour the growth of wheat locally, the wheat flour needed for making biscuit, bread, rolls and pastry foods most times had to be imported. Due to this reason, the FAO and these developing countries were interested in the possibility of replacing the wheat needed for making baked foods and also pasta wholly or partly with flour obtained from home grown products. Some of the sources available were tuberous plants rich in starch such as sweet potatoes, cassava, yams, protein rich flours such as soy and peanuts and other cereals including Maize, rice, millet and sorghum. The use of composite flours had the following advantages in developing countries; saved money, promoted high yielding native plant species, better supply of protein for human nutrition a more appropriate overall use of domestic agriculture [17, 18] . Milligan et al. [19] defined composite flour as a mixture of flours, starches and other ingredients intended to replace wheat flour totally or partially in bakery and pastry products. Therefore, the addition of tiger nut to wheat flour to produce biscuit will enhance the nutritional and sensory properties of the biscuit. The broad objective of the study was to evaluate the quality of biscuit produced from wheat and Tiger nut composite flour
Materials and Methods
Wheat flour, tiger nut and other baking ingredients such as fat, sugar, baking powder, eggs and salt were obtained from North bank market, Makurdi, Nigeria.
Preparation of Composite flour
The composite flour were formulated in different ratios with wheat being the highest. The table 1 below shows the composite flour and their ratios.
| Samples | Wheat flour | Tiger nut Flour |
|---|---|---|
| A | 100 | 0 |
| B | 90 | 10 |
| C | 80 | 20 |
| D | 70 | 30 |
| E | 60 | 40 |
Table text extracted from the original PDF; superscript letters are shown inline. The original table image is below.
View original table image
Production of Tiger nut flour
The production flow chart for tiger nut flour is presented in figure 1.
Biscuit Preparation
Biscuit was prepared according to the method of [20] with some modifications in the recipes; flour 100g, sugar 100g, baking powder 10g, salt 5g, composite flour 100g. The dry ingredients (flour, sugar, salt and baking powder) were thoroughly mixed in a bowl by hand for about 3 minutes. Vegetable shortening was added and mixed until uniform. Egg was then added and the mixture kneaded. The batter was rolled and cut with a 50mm diameter biscuit cutter. The biscuit was placed on baking trays, leaving 25mm spaces in between and was baked at 180 o C for 10 minutes in the baking oven. Following baking, the biscuits were cooled at ambient temperature, packed and stored at 23 o C prior to subsequent analysis and sensory evaluation Source: (21).
Analyses Functional Properties of wheat and tiger nut composite flour
The water absorption capacity of the different flours was determined as described by [21] . 1g of each sample was weighed into a conical graduated centrifuge tube. Using a whining mixer, the samples were mixed thoroughly with 10ml of distilled water in a centrifuge for 30 minutes. The volume of the free water or oil (supernatant) was read directly from the gradual centrifuge tube. The bulk density of samples was determined as described by Onwuka [22] , by weighing 3g of each sample into 10ml graduated cylinder on the laboratory bench several times until there was no further diminution of the sample's level after filling to the 10ml mark.
Bulk density (ml) = Weight of sample (g) …
The swelling capacity was determined using the method as described by [22] , 10g of the sample was weighed into a 100ml graduated cylinder with the dry bulk volume noted. 100ml of hot water at 70 o C was then mixed. The volume after 10 minutes was recorded and the swelling capacity calculated thus; Swelling capacity = Change in volume of sample (ml)…… (2) Original weight of sample (g) Oil absorption capacity was done according to the method described by Giami et al [23] . 1g of each flour sample was weighed out with the aid of an analytical balance and mixed with 10ml of refined palm kernel oil with known density in a weighed 20ml centrifuge tube for each sample. The resulted slurries was agitated on a vortex mixer for 2 minutes, and allowed to stand at a temperature of 280 o C for 30 minutes and then centrifuged supernatants were decanted and discarded. The adhering drops of the oil was removed and the tubes weighed in each case. The weight of oil absorbed by 1g of each of the flour samples was calculated and expressed as oil absorption capacity of the samples.
Moisture content was determined by [24] . Clean crucible was dried in the oven at 100 o C for 1 hour to obtain a constant weight and then cooled in a dessicator. 2g of the samples was weighed into the crucibles and dried at 100 o C until a constant weight is obtained.
The soxhlet extraction method of AOAC [24] was used to determine the fat content of the biscuit. A soxhlet extractor with a reflux condenser and a 500ml round bottom flask will be fixed. 2g of sample weighed into a thimble-petroleum ether (300ml) was filled into the round bottom flask. The extractor thimble was then sealed with a cotton wool. A soxhlet apparatus was allowed to reflux for 6 hours, the thimble was removed with care and the petroleum ether collected at the top and drained into a container for reuse. When the flask was free of ether, it was removed and dried at 105 o C in an oven, cooled in a dessicator and weighed.
) Weight of sample
Protein content of the biscuit was determined according to standard method of AOAC [24] using the kjeldahl method described below; Digestion sample: 2g of samples was weighed in a kjeldahl flask. About 5g anhydrous sodium sulphate or 2 tablets of kjeldahl catalyst was added. 25ml of concentrated H 2 SO 4 was added with a few boiling chips (antibumps). It was heated in a fume chamber until the solution became clear. The solution was then cooled to room temperature, after which it was transferred into a 250ml volumetric flask and made up to level with distilled water. Distillation: A 100ml conical flask, containing 5ml of 2% buric acid was placed under the condenser with addition of drops of methyl red indicator. 5ml of the digest was pipetted into the apparatus through the small funnel washed down with distilled water and titrated with 0.049 H 2 SO 4 to get a pink colour. The ash content was done following the method described by AOAC [24] . 2g of sample was weighed into a preheated cooled crucible. This sample was charred on a Bunsen flame inside a fume cupboard. Samples were transferred into a preheated muffle furnace at 550 o C for 3-5 hours until a white or light grey ash was obtained.
% Ash = Weight of ash X 100-----
Weight of sample Carbohydrate content of the samples was determined by the difference method described by AOAC (24) using the equation;
% Carbohydrate = 100-(% moisture + % ash + % protein + % crude fibre + % crude fat) ……...
Determination of Mineral content of the Biscuit
Iron was determined following the phenanthroline method of Iwe, [25] . Five milliliters of digested sample was placed in a 50ml volumetric flask. Then 3ml of phenanthroline solution, 2ml of hydrochloric acid and 1ml of hydroxylamine solution were added to the sample in sequence. The sample solution was added to the solution. The absorbance was determined at 510nm wavelength. Iron standard solution was prepared in order to plot a calibration curve to determine the concentration of the sample. Standard solution containing 100mg/ml of fermic irons was prepared from 1g pure iron wires. The wires were dissolved in 100ml concentrated nitric acid, boiled in a water bath and diluted to 100ml with distilled water after cooling. Standards solutions of known concentrations were prepared by pipetting 2,4,6,8 and 10ml standard iron solution into 100ml volumetric flasks and made up to volume. Calcium was determined using the method described by [25] . Twenty-five milliliter of digested sample was pipetted into 250ml conical flask and a pinch of Eriochrome Black-T-Indicator (EBT) was added. Thereafter, 2ml of 0.1N NaOH solution was added and the mixture titrated with standard EDTA (0.01M EDTA) solution. Ca (mg/1) = T X M X E X 1000………………... Phosphorus and samples was determined according to [22] by molybdate method using hydroquinone as a reducing agent. Five milliliters (5ml) of the test solution was pipetted into 50ml graduated flask. Then 10ml of molybdate mixture was added and diluted to mark with water. It was allowed to stand for 30minutes for colour development. The absorbance was measured at 660mm against a blank. A curve relating absorbance to mg phosphorus present was constructed. Using the phosphorus standard solution, and following the same procedure for the test sample, a standard curve was plotted to determine the concentration of phosphorus in the sample. Potassium was determined by a procedure described by Iwe, [24] using a flame photometer. Potassium standard was prepared. The standard solution was used to calibrate the instrument read out. The meter reading was at 100% E (Emission) to aspire the top concentration of the standards. The %E of all the intermediate standard curves was plotted on linear graph paper with these readings. The sample solution was aspired on the instrument and the readings (%E) was recorded. The concentration of the element in the sample solution was read from the standard curve. ----------------------(8) 1 million Where Ppm = parts per million
Calculation %Potassium = DF X 100 X ppm -
Calculation %Potassium = DF X 100 X ppm -
Sensory Evaluation of Biscuits
The organoleptic properties of the biscuit including taste, texture, colour and overall acceptability was accessed by 15 member panelists who are familiar with the product at 9-point Hedonic scale with 1 representing the least score (dislikes extremely) and the highest score (like extremely).
Statistical Analysis
Analysis of variance (ANOVA) was performed on the data to determine differences, while the Duncan multiple range test was used to separate means where significant difference exist.
Results and Discussion
Functional Properties Table 2 present the functional properties of the composite wheattigernut flour. The functional properties are those parameters that determine the application and end use of food materials for various food products. The bulk density is a reflection of the load the sample can carry if allowed to rest directly on one another. The bulk density of foods is affected by the particle size and the starch content. It is important in determining the packaging requirement, raw materials handling and application in wet processing in the food industry. The samples A and B had no significant difference on the bulk density, but the inclusion of tiger nut flour made samples C, D and E to be significantly different from each other. The bulk density ranged from 0.76 -0.67g/ml. Oil absorption capacity is important since oil acts as flavor retainer and increases mouth feel of foods. In oil absorption capacity, the samples A was significantly different from samples B, C, D and E. This implies that tigernut addition improved the oil absorption capacity In the water absorption capacity, sample A was significantly different from other samples but the remaining samples were not significantly different from each other. This implies that wheat flour had higher water absorption but the tiger nut level of substitution was not affected. The ability of flour to absorb water was reported to have a significant correlation with its starch content. There was decrease in the swelling capacity as the ratio of tigernut flour increased. The values recorded for the sample ranged between 300-9.403. For the Foam capacity, showed no significant increase in sample B but there was a significant decrease in samples C, D and E respectively.
| Parameters | A | B | Samples C | D | E | LSD |
|---|---|---|---|---|---|---|
| BD (g/ml) | 0.76a±0.02 | 0.67c±0.01 | 0.69bc±0.01 | 0.71b±0.01 | 0.70bc±0.01 | 0.036 |
| OAC (ml/g) | 0.27e±0.01 | 0.73b±0.01 | 0.82a±0.02 | 0.46d±0.01 | 0.55c±0.00 | 0.04 |
| WAC (ml/g) | 1.10a±0.00 | 1.00b±0.00 | 0.91c±0.01 | 1.00b±0.00 | 0.90c±0.00 | 0.01 |
| SI | 9.40a±0.00 | 8.00b±0.00 | 5.76c±0.01 | 4.19d±0.01 | 3.00e±0.00 | 0.01 |
| FC | 7.85b±0.01 | 8.00a±0.00 | 3.93c±0.01 | 3.92c±0.00 | 2.94d±0.00 | 0.01 |
Table text extracted from the original PDF; superscript letters are shown inline. The original table image is below.
View original table image
Physical properties
The physical properties of the wheattiger nut flour are shown in table 9 below. The weights of the biscuits were not significantly different from each other (P˃0.05). This implies that tiger nut addition on wheat flour does not affect the weight. Samples E, D, B and A were significantly different from each other but not same for sample C which was not significantly different from each other in the thickness. In the diameter, samples B and E were significantly different from each other but not significantly different from other samples. This means that tiger nut addition to wheat flour has no significant different The spread ratio also did not have great difference on the physical properties of the product. 4 shows the proximate composition of biscuit produced from wheat and tiger nut flour blends. The moisture content of the samples ranged from 4.64-5.16%. The low moisture content could reduce the growth of microorganisms thereby increasing the shelf life of the product. The protein content of the biscuit samples increased as the ratio of tigernut flour increased in the mixture, the values ranged from 8.61 to 9.88%. Significant differences (p < 0.05) were observed amongst the samples when compared. The fat content of the biscuit increased as the tiger nut addition progressed. The increase in fat ranged from 16.65 -17.85. The crude fiber also was significantly different from each other. The mean value increased as tiger nut flour was blended across the samples. The high content of fiber in tiger nut has a good effect on digestion. This is because fibre stimulates digestive juices, contributes to a longer feeling of fullness and speeds up transit in the intestinal tract and so prevents constipation. The ash content (%) of the sample increased with decrease in the ratio of wheat flour in the samples. Sample A was not significantly different from samples B, C, D and E. The ash content is also a rough estimate of the mineral contents of the samples. The carbohydrate content was significantly different from each other, across the rows. The addition of tiger nut flour in the samples resulted to a reduced carbohydrate level in the samples. The carbohydrate content of the composite flours ranged from 64.53 to 60.85.
Conclusion and Recommendation
Conclusively, the study has shown that the biscuit can be adequately produced using tiger nut in the range of 10-40%. The proximate analysis indicated that the nutritional value of the biscuit increased as the tiger nut flour level increased. The sensory result showed that biscuit made from wheat with 10% tiger nut flour was more acceptable. The use of tiger nut wheat composite flour is recommended so as to reduce the cost of biscuit production and improve the nutritional value of biscuits. Thus, sample B with 90% wheat flour and 10% tiger nut flour is recommended for consumption and will increase fiber and protein intake in children, help to prevent diseases associated with gluten and protein-energy malnutrition among children and increase the utilization of tiger nut in developing countries including Nigeria.
Figures and tables from the paper
| Parameters | A | B | Samples C | D | E | LSD |
|---|---|---|---|---|---|---|
| Weight (g) | 15.43bc±1.44 | 16.30b±2.38 | 13.73c±1.02 | 19.03a±0.50 | 17.40ab±0.30 | 2.46 |
| Thickness (mm) | 1.17a±0.23 | 1.23a±0.12 | 1.20a±0.00 | 1.23a±0.15 | 1.20a±0.17 | 0.28 |
| Diameter (mm) | 8.50a±0.10 | 5.67b±0.32 | 5.70b±0.61 | 5.87b±0.12 | 6.07b±0.80 | 0.87 |
| Spread Ratio | 7.50a±1.59 | 4.63b±0.60 | 4.75b±0.50 | 4.80b±0.59 | 5.17b±1.26 | 1.83 |
Table text extracted from the original PDF; superscript letters are shown inline. The original table image is below.
View original table image
| Parameters | A | B | Samples C | D | E | LSD |
|---|---|---|---|---|---|---|
| Ash (%) | 3.48a±0.01 | 3.51a±0.01 | 3.51a±0.08 | 3.60a±0.05 | 3.57a±0.05 | 0.13 |
| Crude protein (%) | 8.61d±0.01 | 8.89cd±0.01 | 9.23bc±0.01 | 9.52ab±0.12 | 9.88a±0.46 | 0.55 |
| Crude fibre (%) | 2.11d±0.01 | 2.23cd±0.01 | 2.33bc±0.02 | 2.43b±0.10 | 2.71a±0.07 | 0.14 |
| fat (%) | 16.65c±0.21 | 16.88bc±0.03 | 16.90bc±0.57 | 17.40ab±0.14 | 17.85a±0.06 | 0.72 |
| Moisture (%) | 4.64b±0.01 | 4.79ab±0.01 | 5.01ab±0.15 | 5.08a±0.31 | 5.16a±0.01 | 0.40 |
| CHO (%) | 64.53a±0.23 | 63.71ab±0.04 | 63.04b±0.31 | 61.98c±0.10 | 60.85d±0.65 | 0.88 |
| Ca (mg/100g) | 120.50b±0.71 | 118.50c±0.71 | 120.50b±0.71 | 130.50a±0.71 | 117.50c±0.71 | 1.82 |
| Fe (mg/100g) | 1.12c±0.00 | 1.10c±0.00 | 1.22b±0.02 | 1.44a±0.01 | 1.05d±0.01 | 0.04 |
| P (mg/100g) | 321.50c±0.71 | 218.50e±0.71 | 332.00b±2.83 | 343.00a±0.00 | 317.00d±1.41 | 3.81 |
| K (ml/100g) | 114.50d±0.71 | 119.50c±0.71 | 124.50b±0.71 | 126.50a±0.71 | 118.50c±0.71 | 1.82 |
Table text extracted from the original PDF; superscript letters are shown inline. The original table image is below.
View original table image
| Parameters | A | B | Samples C | D | E | LSD |
|---|---|---|---|---|---|---|
| Appearance | 6.87b | 7.27ab | 7.33ab | 7.80a | 8.00a | 0.87 |
| Texture | 7.53a | 7.40a | 7.33a | 7.27a | 7.33a | 0.72 |
| Aroma | 7.80a | 7.73a | 7.27ab | 7.60ab | 7.00b | 0.73 |
| Taste | 7.93a | 7.67ab | 7.13b | 7.53ab | 7.33ab | 0.70 |
| General acceptability | 7.93a | 7.93a | 7.27a | 7.60a | 7.40a | 0.75 |
Table text extracted from the original PDF; superscript letters are shown inline. The original table image is below.
View original table image
References
24 in the original paper- Kumar Rekha S, Sinha LK. Evaluation of quality characteristics of soy-based millet biscuits, Advances in Applied Science Research. 2010; 1:187-196.
- Mannay S, Shadaksharaswany CM. Foods: Facts and Principles. (2nd ed.). New Age International Ltd. Publishers. New Delhi, India, 2005.
- Potter N, Hotchkiss J. Food Science. 5th ed. CBS Publishers and Distributors. Daryangaji, New Delhi, India, 2006.
- Bakke A, Vickers Z. Consumer liking of refined and whole wheat breads. Journal of Food Science. 2007; 72:473-480.
- Akhtar S, Anjum F, Rehman S, Sheikh M, Farzena K. Effect of fortification on the physico-chemical and microbiological stability of whole wheat flour. Food Chemistry. 2008; 112:156-163.
- Ekeanyanwu RC, Ononogbu CI. Nutritive value of Nigerian tiger nut (Cyperus esculentus L.). Agricultural Journa. 2010; l5:297-302.
- Simpson DA, Inglis CA. Cyperaceae of economic ethnobotanical and horticultural importance: a check list. Kew Bulletin. 2001; 56:257-360.
- Anderson JW, Smith BM, Gustafson NJ. Health benefits and practical aspects of high fiber diets. The American Journal of Clinical Nutrition. 1994; 59:1242-1247.
- Oladele AK, Aina JO. Chemical composition and functional properties of flour from two varieties of tigernut (Cyperus esculentus). African Journal of Biotechnology. 2007; 6(21):2473-2476.
- FAO/WHO Energy and Protein requirement, Geneva. Report of a joint FAO/WHO/UNU expert consultation. WHO Technical report Series No. 724, 1985.
- Bosch L, Alegria A. Reverse-phase High Pressure Liquid Chromatography (RP HPLC) determination of tigernut and orgeal amino acid contents. Food Science and Technology International. 2005; 10:30-40.
- Kure OA, Bahago EJ, Daniel EA. Studies on the proximate composition and effect of flour particle size of acceptability of biscuits produced from blends of soybeans and plantain flours. Journal Namoda Technology. 1998; 3(2):17-22.
- Al-Marazeeq KM, Angor MM. Chemical Characteristic and Sensory Evaluation of Biscuit Enriched with Wheat Germ and the Effect of Storage Time on the Sensory Properties for this Product. Food and Nutrition Sciences. 2017; 8:189-195.
- Jauharah A, Rosli W, Robert S. Physicochemical and Sensorial Evaluation, 2014.
- Masoodi L, Bashir V. Fortification of Biscuit with Flaxseed: Biscuit Production and Quality Evaluation. IOSR Journal of Environmental Science Toxicology Food Technology. 2012; 1:6-9. https://doi.org/10.9790/2402-0150609
- Ahmad S, Ahmed M. A Review on Biscuit, a Largest Consumed Processed Product in India, Its Fortification and Nutritional Important. International Journal of Science Inventions Today. 2014; 3:169-186.
- Berghofer E. Brot als 'funktionales Lebensmittel'. Getreide Mehl Brot. 2000; 54(3):175-17.
- Bugusu BA, Campanella O, Hamaka BR. Improvement of Sorghum-wheat composite dough rheological properties and bread making quality through Zein addition. Cereal Chemistry. 2001; 78(1):31-35.
- Milligan ED, Amlie JH, Reyes J, Garcia A, Meyer B. Processing for production of edible soy flour. Journal American Oil Chemistry Social. 1981; 58:331-335.
- Chinma CC, Igbabul BD, Omotayo OO. Quality characteristics of cookies prepared from unripe plantain and defatted sesame flour blends. Journal of Food Technology. 2012; 7:398-408.
- Onwuka GT. Food Analysis and Instrumentation. Theory and Practices. Naphtali Prints, Lagos. Nigeria, 2005. ISBN: 978047686.
- Giami SY, Amasisi TI, Aiyor G. Comparison of Bread making properties of composite flours from kernels of roasted and boiled African breadfruit (Treculia Africana decine) seeds. Journal of Materials Research. 1992; 1(1):16025-16030.
- AOAC. Official methods of analysis of A.O.A.C. International (19 th ed). Gaithersburg, M.D. USA, 2012.
- Iwe MO. The sscience and Technology of soy bean. Rejoint communication service Ltd, Enugu, Nigeria, 2003.
Cited by 8
From OpenAlex, OpenCitations and reference lists read by Scinovex
- Bioactive compounds, nutritional and sensory properties of cookies prepared with wheat and tigernut flour ↗
Elfadıl E. Babiker, Mehmet Musa Özcan, Kashif Ghafoor, Fahad Al Juhaimi, Isam A. Mohamed Ahmed, Ibrahim A. Almusallam · Food Chemistry · 2021
❝ 34 - Quality Evaluation of Bread Prepared from Wheat–Chufa Tuber Composite Flour ↗
Mehmet Musa Özcan · Foods · 2023
The oil amounts of breads were measured between 0.13% (control) and 4.90% (with 40% 6 chufa). The total phenolic and flavonoid contents of the breads enriched with chufa tuber flours (powders) were reported as between 37.42 (control) and 99.64 mg GAE/100 g (with 20% chufa) to 61.19 (control) and 120.71 mg/100 g (with 20% chufa), respectively. The antioxidant activities of…
❝ 12PDF - Comparison of the bioactive compounds, phytochemicals, nutrients and sensory properties of cookies prepared using wheat flour and mahaleb seed powders ↗
Mehmet Musa Özcan, Merve Kandil, Havvanur Yılmaz · Food and Humanity · 2023
❝ 7 - Physical properties, dietary fibre profile and peroxide value of biscuit produced from wheat-Tigernut flours with avocado paste as fat substitute ↗
Uzochukwu Anselm Onwuzuruike, PO Ukegbu, Obasi NE, Mabel Ogah, I.J Okereke, Uche P.C et al. · Indonesian Food Science and Technology Journal · 2023
This study investigated the effect of replacing fat with avocado paste on the physical properties, dietary fibre profile and peroxide value of wheat-tigernut biscuits. Whole tigernut was processed into flour and blended with wheat flour at three different levels; 10%, 20% and 30% weight basis into two parts. The first part of the composite (T10, T20, and T30) and control…
❝ 4PDF - Turpentine fruit paste as an ingredient of wheat bread: physicochemical and sensory properties ↗
Akram A. Abdo Qasem, Isam A. Mohamed Ahmed, Belal M. Mohammed, Mehmet Musa Özcan, Zainab Albakry · International Journal of Food Science & Technology · 2024
Abstract The physical, chemical, phenolic constituents, fatty acids and mineral contents of the breads produced from wheat flour and turpentine paste at different concentrations were analysed by chromatographic and spectrophotometric methods. L*, a* and b* results of the breads were equal to 49.28–74.51, 0.90–6.55 and 13.45–20.19, respectively. Total phenolic and flavonoid quantities of the breads prepared by adding turpentine fruit…
❝ 2 - Technology application and biological response of prebiotic/gluten-free snack rolls processed by value-added composite flour in normal and celiac-diseased rats ↗
Rasha Salah Mohamed, Safaa Sayied Abozed, Manal F. Salama, Dina Mostafa Mohammed · Egyptian Journal of Chemistry · 2023
The aim of this study was to formulate novel snack rolls that are both prebiotic and gluten-free by incorporating value-added composite flours, including rice flour (RF), barley flour (BF), tiger nut flour (TF), and green banana flour (GBF), with the intention of enhancing the individuals with celiac disease. Physical properties, baking quality, sensory acceptability, and chemical properties were evaluated for…
❝ 2PDF - Changes in the Physicochemical Properties, Antioxidant, Fatty Acids and Sensory Evaluation of Cookies Made With Spices ↗
Fahad AlJuhaimi, Mehmet Musa Özcan, Nurhan Uslu, Elfadıl E. Babiker, Belal M. Mohammed, Mahmoud Younis et al. · Starch - Stärke · 2026
ABSTRACT This study examined the bioactive properties, phytochemical composition, biogenic elements, and sensory attributes of cookies produced using wheat flour and various spices. In bakery technology, spices are commonly used to enhance the antioxidant activity of baked products, serve as natural flavoring and coloring agents, and offer potential benefits in food preservation and disease prevention. L* values of cookies varied…
❝ 0 - Technological Assessment of Bread with the Addition of Cyperus esculentus L. Accessions Flour Grown in the Kuban–Azov Plain ↗
Nina G. Kon’kova, В. И. Хорева, Vitaliy S. Popov, Tamara V. Yakusheva, I. A. Kibkalo, Leonid L. Malyshev et al. · Foods · 2025
Due to increased interest in new functional food products, 20 accessions of chufa tubers from the collection of the N.I. Vavilov Institute of Plant Industry, grown in the Kuban-Azov Plain in 2022, as well as bread samples made from mixed flour (70% whole-grain wheat flour, 30% chufa tuber flour) were studied. Biochemical, farinographic, and baking evaluations were carried out. Differences…
❝ 0PDF