
Research article · 2017 · Full text
International Journal of Statistics and Applied MathematicsStochastic analysis of a reliability model for one-unit system with three types of repair policy
Volume 2(6) · Pages 126–130
Research areasReliability and Maintenance OptimizationStatistical Distribution Estimation and ApplicationsProbability and Risk Models
Abstract
Author-writtenThe present paper investigates a one-unit system with two types of repairman and resume/repeat repair policies. On the failure of the unit, it is undertaken by an ordinary repairman with the known fact that he may not be able to do some complex repairs. There may also be the possibility of rather damaging the unit by him during repair resulting it to go into more degraded stage. When the ordinary repairman finds himself unable, an expert repairman comes who first discusses the process of repair done by the ordinary repairman and then adopts either resume repair policy or one of the two types of repeat repair policies. System is analysed by making use of regenerative point technique and various measures of system effectiveness are obtained. Profit is also evaluated.
Summary
Source-checkedPlain-language reading of the full paper, prepared with AI and checked against the text. Each point links to the authors' own words.
Why it matters
- Reliability research frequently examines one-unit and two-unit standby systems to understand how they perform under different conditions. View evidence ↗
- A critical issue in system repair is that an ordinary repairman might accidentally damage a unit, causing it to enter a more degraded state. View evidence ↗
- Existing reliability literature has not sufficiently addressed repair policies that account for units becoming more degraded during an initial repair attempt. View evidence ↗
The question
- The study aims to analyze a one-unit system utilizing two types of repairmen and three distinct repair policies. View evidence ↗
What they did
- The model assumes that failure times follow an exponential distribution, while other time distributions are treated as general. View evidence ↗
- The authors used semi-Markov processes and the regenerative point technique to analyze the system. View evidence ↗
- The three policies are: resume repair (if the initial repair was correct), repeat repair type-I (starting from the initial failure stage), and repeat repair type-II (starting from a more degraded stage). View evidence ↗
What they found
- Both the Mean Time to System Failure (MTSF) and system availability decrease as the failure rate increases. View evidence ↗
- System profit decreases as the failure rate increases and increases as the repair rate increases. View evidence ↗
- Profitability depends on the repair rate (α); for α = 0.2, 0.25, and 0.3, the system is profitable only if the failure rate (λ) is less than 0.0739, 0.085, and 0.093, respectively. View evidence ↗
- Profit increases with higher revenue (C0) and decreases with higher expert repair costs (C2); for C2 values of 600, 750, and 900, the required revenue C0 for profitability is > 605.2, > 643.5, and > 681.7, respectively. View evidence ↗
- Profit decreases as the cost per expert visit (C5) increases; for discussion rates (β) of 1, 2, and 3, profitability requires C5 to be less than 1200, 1300, and 1380, respectively. View evidence ↗
- Profit increases as the probability (p) that the ordinary repairman can fix the unit increases; for probabilities (a) of 0.1, 0.4, and 0.7, profitability requires p to be greater than 0.697, 0.688, and 0.678, respectively. View evidence ↗
- As the probability (p) of a successful ordinary repair approaches 1, the system profit becomes identical regardless of the value of probability (a). View evidence ↗
What it means
- The authors recommend that companies purchase systems with failure rates below the specific thresholds identified in their profit analysis to ensure profitability. View evidence ↗
Visual summary
1 visualsIllustrations explain the paper; they do not show study data.
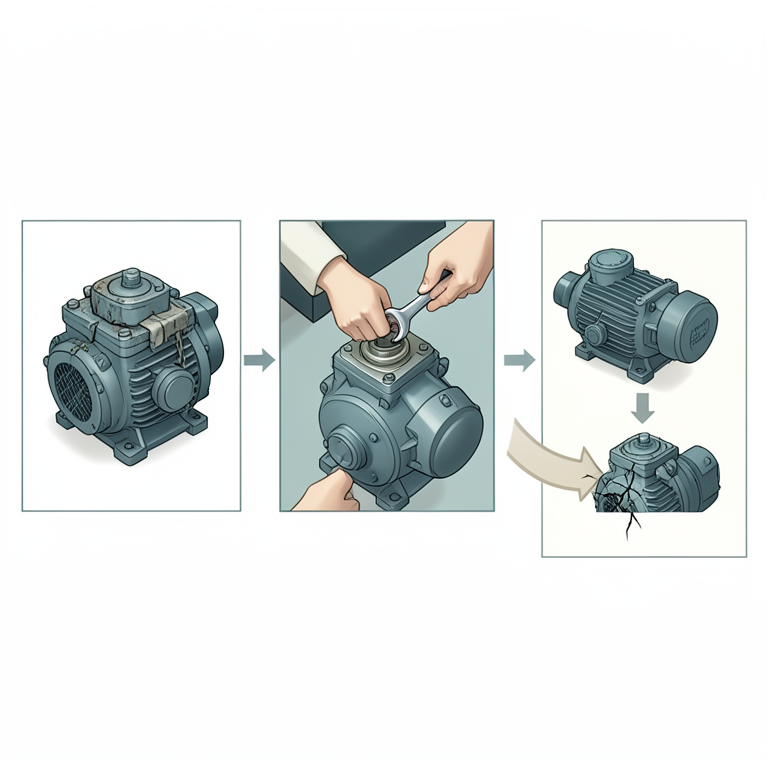
Repair Policy Decision Flow
AI-generated conceptual illustration (industrial mechanical pump system). It explains the idea and does not show study data.
View source evidence ↗Figures & tables
From the original paper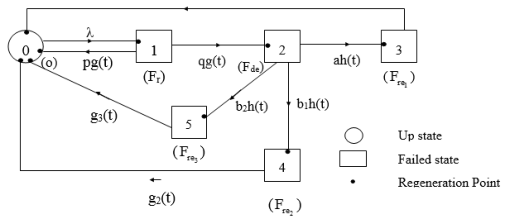 Fig. 1
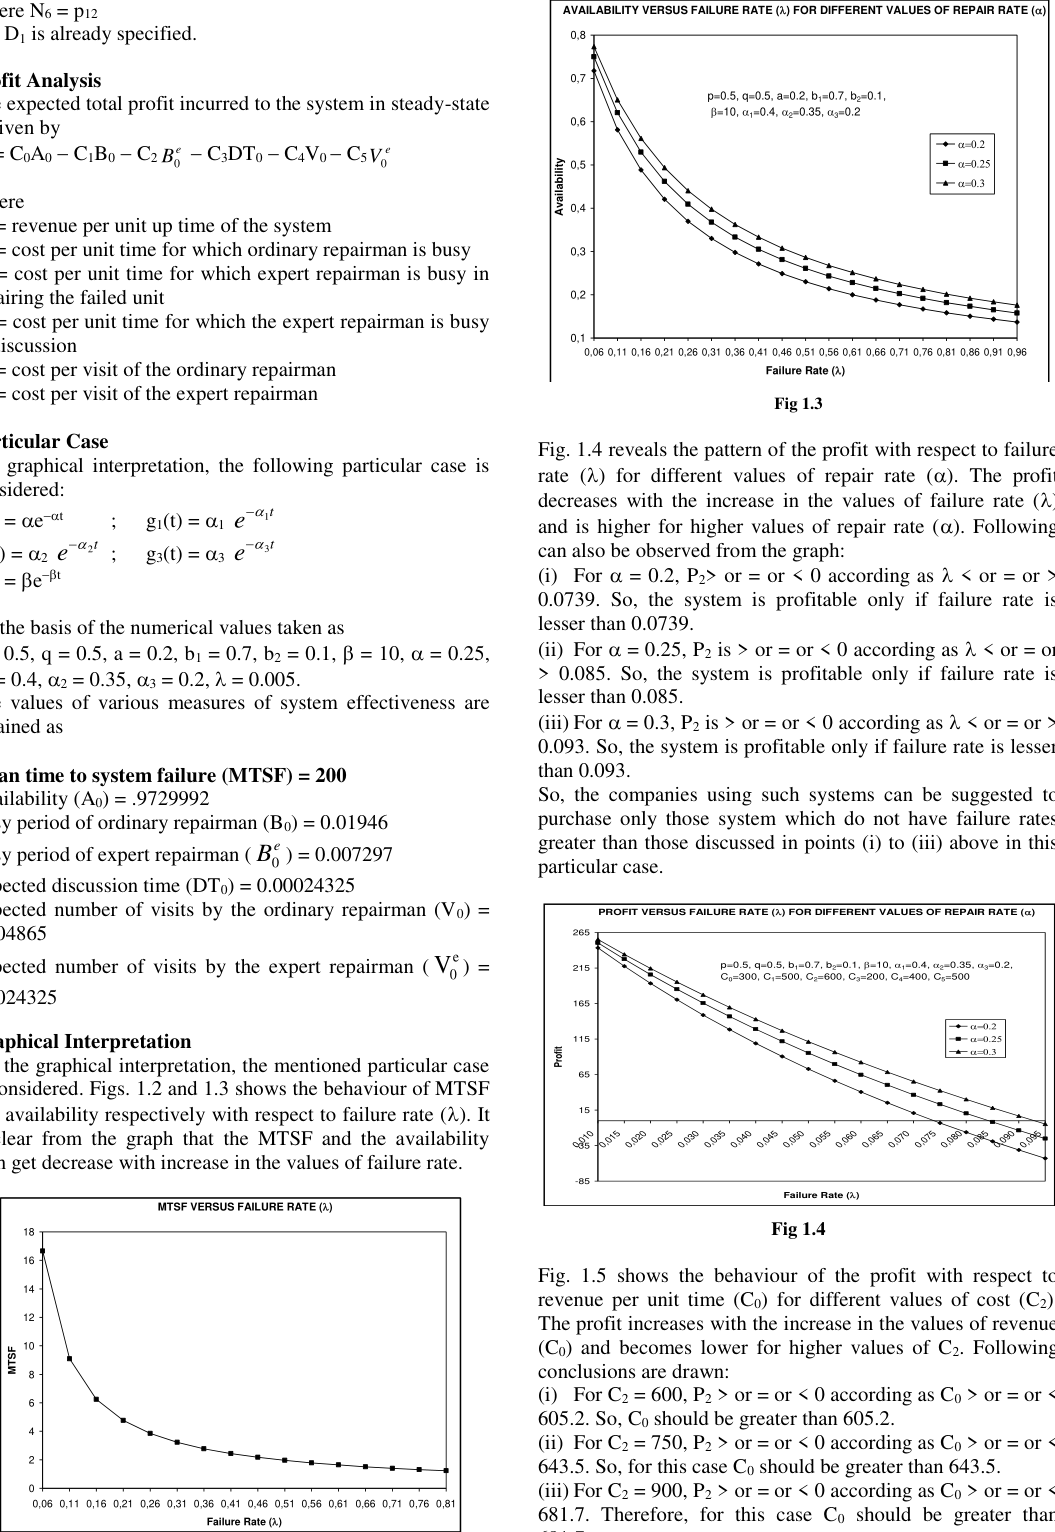 Figure 1
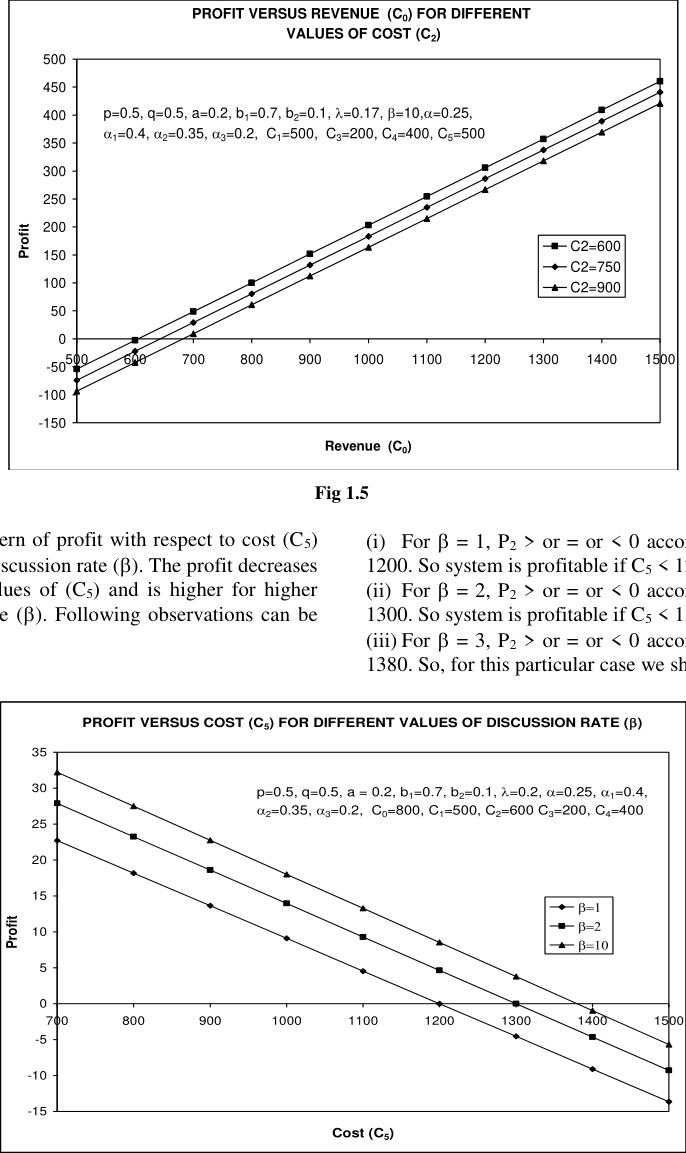 Figure 1
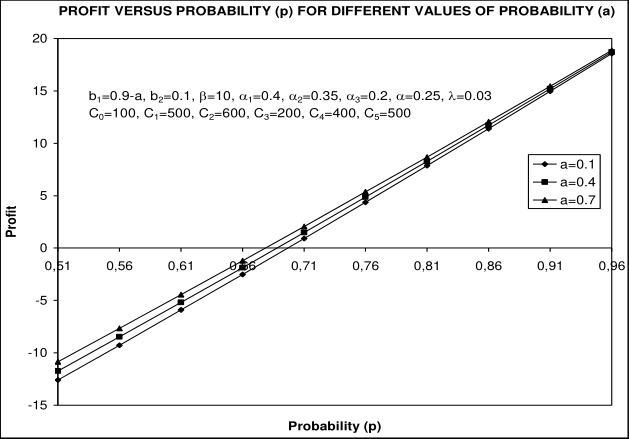 Figure 1
Introduction
In the field of reliability, a large number of researchers have studied one-unit/two-unit standby systems under various assumptions. Some authors including [1][2][3] have taken the assumption that failed unit is undertaken by the perfect repairman whereas some others such as [4][5][6] assumed that the failed unit is first undertaken by the ordinary repairman and if the ordinary repairman is unable to repair it then an expert comes and starts repairing it. However, after getting some of the repair done by the ordinary repairman, the expert repairman may adopt one of the two repair policies-repeat repair policy or resume repair policy. This idea has been incorporated by Taneja and Nanda [1] . There may also be possibility that the ordinary repairman while trying to repair the failed unit may rather damage the failed unit which leads it to go to more degraded state. When repair for such unit is begun again, it is begun from the more degraded stage than the stage it had started earlier. This type of repair policy has not been taken up so far in the literature of reliability. Keeping this in view, the present chapter aims at studying one-unit system with two types of repairman and introduce three types of repair policy. On the failure of the unit, it is undertaken by an ordinary repairman with the known fact that he may not be able to do some complex repairs. There may also be the possibility of rather damaging the unit by him during repair resulting it to go into more degraded stage. When the ordinary repairman finds himself unable, an expert repairman comes who first discusses the process of repair done by the ordinary repairman. After discussion, if it is found that the process of earlier repair was correct and no mishandling occurred then resume repair policy is adopted whereas if the process was incorrect or there is some mishandling took place, one of the following types of repair policy is to be adopted. (a) The repair begins at the stage the ordinary repairman had taken over the unit (let us call this as repeat repair policy type-I) (b) The repair begins from the more degraded stage as the ordinary repairman made some damages (let us call this as repeat repair policy type-II). Assuming the failure time distribution as exponential and other time distributions as general, the following measures of system effectiveness are obtained:- Mean time to system failure (MTSF). Steady-state availability of the system.
Expected busy period per unit time by the ordinary repairman. Expected fraction of the time for which the ordinary/expert repairman is busy in repairing the failed unit. Expected discussion time. Expected number of visits by the ordinary/expert repairman. Expected profit incurred to the system. The system has been analysed by making use of semi-Markov processes and regenerative point technique. Graphical study is made and cut off points for various rates/costs to study the economic aspect have been obtained.
Notations
p: probability that ordinary repairman is able to repair the failed unit q: 1 p, i.e., the probability that the ordinary repairman is unable to repair the failed unit a: probability that the process of repair done by ordinary repairman was correct b1: probability that the process of repair done by the ordinary repairman was incorrect but did not lead to any further damage b2: probability that during the repair, the ordinary repairman leads the unit to more degraded stage. h(t), H(t): p.d.f., c.d.f. of the discussion time g(t), G(t): p.d.f., c.d.f. of repair time of the ordinary repairman g1(t), G1(t): p.d.f., c.d.f. of the repair time of the expert repairman when resume repair policy is adopted g2(t), G2(t): p.d.f., c.d.f. of the repair time of the expert repairman when repeat repair policy (type I) is adopted g3(t), G3(t): p.d.f. of the repair time of the expert repairman when repeat repair policy (type II) is adopted. The non-zero elements pij = qij*(s) are:
Symbols for the
By these probabilities, it can be verified that p10 + p12 = 1, p23 + p24 + p25 = 1 Also i, the mean sojourn time in state i are:
The unconditional mean time taken by the system to transit for any state j when it has taken from epoch of entrance into regenerative state i is mathematically stated as
Various measures of system effectiveness obtained for the system are as follows: Mean Time to System Failure (MTSF) = µ0 In steady state, the availability of the system is given by A0 = N1 / D1 Where N1 = 0 and D1 = 0 + 1 + q(2 + a3 + b14 + b25)
In steady-state, the total fraction of time which the system is under repair of the ordinary repairman, is given by B0 = N2 / D1 Where N2 = 1 and D1 is already specified.
In steady-state, the total fraction of time for which the system is under repair of an expert repairman, is given by e B 0 = N3 / D1 Where N3 = p12(3p23 + 4 p24 + 5 p25) and D1 is already specified.
In steady state, the total fraction of the discussion time of the expert repairman, is given by DT0 = N4/D1 where N4 = 2 p12 and D1 is already specified.
In steady-state, the total number of visits by the ordinary repairman per unit time is given by V0 = N5/D1 Where N5 = 1 and D1 is already specified.
In steady-state, the total number of visits by the expert repairman per unit time is given by e V 0 = N5/D1
Where N6 = p12 and D1 is already specified.
Profit Analysis
The expected total profit incurred to the system in steady-state is given by P2
Where C0 = revenue per unit up time of the system C1 = cost per unit time for which ordinary repairman is busy C2 = cost per unit time for which expert repairman is busy in repairing the failed unit C3 = cost per unit time for which the expert repairman is busy in discussion C4 = cost per visit of the ordinary repairman C5 = cost per visit of the expert repairman
Particular Case
For graphical interpretation, the following particular case is considered:
On the basis of the numerical values taken as p = 0.5, q = 0.5, a = 0.2, b1 = 0.
Graphical Interpretation
For the graphical interpretation, the mentioned particular case is considered. Figs. 1.2 and 1.3 shows the behaviour of MTSF and availability respectively with respect to failure rate (). It is clear from the graph that the MTSF and the availability both get decrease with increase in the values of failure rate. The profit decreases with the increase in the values of failure rate () and is higher for higher values of repair rate (). Following can also be observed from the graph: (i) For = 0.2, P2> or = or < 0 according as < or = or > 0.0739. So, the system is profitable only if failure rate is lesser than 0.0739.
(ii) For = 0.25, P2 is > or = or < 0 according as < or = or > 0.085. So, the system is profitable only if failure rate is lesser than 0.085.
(iii) For = 0.3, P2 is > or = or < 0 according as < or = or > 0.093. So, the system is profitable only if failure rate is lesser than 0.093. So, the companies using such systems can be suggested to purchase only those system which do not have failure rates greater than those discussed in points (i) to (iii) above in this particular case. The profit increases with the increase in the values of revenue (C0) and becomes lower for higher values of C2. Following conclusions are drawn: (i) For C2 = 600, P2 > or = or < 0 according as C0 > or = or < 605.2. So, C0 should be greater than 605.2.
(ii) For C2 = 750, P2 > or = or < 0 according as C0 > or = or < 643.5. So, for this case C0 should be greater than 643.5. (iii) For C2 = 900, P2 > or = or < 0 according as C0 > or = or < 681.7. Therefore, for this case C0 should be greater than 681.7. 0 ,0 1 0 0 ,0 1 5 0 ,0 2 0 0 ,0 2 5 0 ,0 3 0 0 ,0 3 5 0 ,0 4 0 0 ,0 4 5 0 ,0 5 0 0 ,0 5 5 0 ,0 6 0 0 ,0 6 5 0 ,0 7 0 0 ,0 7 5 0 ,0 8 0 0 ,0 8 5 0 ,0 9 0 0 ,0 9 5
MTSF VERSUS FAILURE RATE ()
Failure Rate () Profit p=0.5, q=0.5, b1=0.7, b2=0.1, =10, 1=0.4, 2=0.35, 3=0.2, C0=300, C1=500, C2=600, C3=200, C4=400, C5=500 for different values of discussion rate (). The profit decreases with increase in the values of (C5) and is higher for higher values of discussion rate (). Following observations can be made:
(i) For = 1, P2 > or = or < 0 according as C5 < or = or > 1200. So system is profitable if C5 < 1200.
(ii) For = 2, P2 > or = or < 0 according as C5 < or = or > 1300. So system is profitable if C5 < 1300.
(iii) For = 3, P2 > or = or < 0 according as C5 < or = or > 1380. So, for this particular case we should take C5 < 1380.
Fig 1.6
Fig. 1.7 shows the behaviour of profit with respect to probability (p) for different values of probability (a). Profit increases as p increases and becomes higher for higher values of repair rate (). Following conclusions can be drawn: (i) For a = 0.1, P2 > or = or < 0 according as p > or = or < 0.697. Therefore p should be greater than 0.697.
(ii) For a = 0.4, P2 > or = or < 0 according as p > or = or < 0.688. Therefore, system is profitable if p > 0.688.
(iii) For a = 0.7, P2 > or = or < 0 according as p > or = or < 0.678. Therefore, system is profitable if p > 0.678. It is also observed that the three curves converge as p 1 which implies that profit comes out to be same as p 1 irrespective of the values of probability (a).
References
References
References
0 in the original paperCited by 2
From OpenAlex, OpenCitations and reference lists read by Scinovex
- A System with Two Spare Units, Two Repair Facilities, and Two Types of Repairers ↗
Vahid Andalib, Jyotirmoy Sarkar · Mathematics · 2022
Assuming exponential lifetime and repair time distributions, we study the limiting availability A∞ as well as the per unit time-limiting profit ω of a one-unit system having two identical, cold standby spare units using semi-Markov processes. The failed unit is repaired either by an in-house repairer within an exponential patience time T or by an external expert who works faster…
❝ 20PDF - Comparison of two identical reliability models for two unit system with model-1 “three types of repair policy” and model-2 “three types of repair policy and replacement
Rashmi Gupta · International Journal of Statistics and Applied Mathematics · 2018
The present paper deals with the comparison of two identical reliability models for two unit system with model-1 “three types of repair policy” and model-2 “three types of repair policy and replacement”. On the failure of the unit, it is first undertaken by the ordinary repairman who may not be able to do some complex repairs and may rather damage the unit during try for its repair. On the inability shown by the ordinary repairman, the unit is undertaken for repair by the expert repairman adopting one of the three types of repair policy. The damage unit may or may not be repairable and hence i