
Research article · 2018 · Full text
International Journal of Statistics and Applied MathematicsComparison of two identical reliability models for two unit system with model-1 “three types of repair policy” and model-2 “three types of repair policy and replacement
Volume 3(2) · Pages 682–684
Research areasReliability and Maintenance OptimizationSoftware Reliability and Analysis ResearchStatistical Distribution Estimation and Applications
Abstract
Author-writtenThe present paper deals with the comparison of two identical reliability models for two unit system with model-1 “three types of repair policy” and model-2 “three types of repair policy and replacement”. On the failure of the unit, it is first undertaken by the ordinary repairman who may not be able to do some complex repairs and may rather damage the unit during try for its repair. On the inability shown by the ordinary repairman, the unit is undertaken for repair by the expert repairman adopting one of the three types of repair policy. The damage unit may or may not be repairable and hence is repaired/replaced accordingly. Various measures of system effectiveness have been obtained by making use of semi-Markov processes and regenerative point technique in both the models. Graphical study for a particular case is made and various cut-off points for making the decisions regarding profitability of the system have been obtained.
Summary
Source-checkedPlain-language reading of the full paper, prepared with AI and checked against the text. Each point links to the authors' own words.
Why it matters
- In some reliability systems, an ordinary repairman may fail to fix a complex issue and might accidentally damage the unit during the attempt. View evidence ↗
- When an ordinary repairman cannot complete a repair, an expert repairman is brought in to apply one of three specific repair policies. View evidence ↗
- Units damaged during initial repair attempts may be either repairable or irreparable, necessitating either a repair or a full replacement. View evidence ↗
The question
- The study aims to compare two reliability models for a two-unit system: one using three types of repair policies (Model-1) and another adding replacement to those policies (Model-2). View evidence ↗
What they did
- The authors used semi-Markov processes and the regenerative point technique to calculate system effectiveness measures for both models. View evidence ↗
- The system was analyzed graphically using a specific case where all time distributions were assumed to be exponential. View evidence ↗
- A pairwise comparative analysis was performed using graphs based on cases established in previous research. View evidence ↗
What they found
- When replacement cost (C7) is up to 3000, the profit difference between Model-2 (P4) and Model-1 (P3) is higher for higher failure rates (λ), but this trend reverses when C7 exceeds 4600. View evidence ↗
- At a failure rate of λ = 0.01, Model-2 is more profitable than Model-1 if the replacement cost (C7) is less than 5731, and less profitable if C7 is greater than 5731. View evidence ↗
- At a failure rate of λ = 0.03, Model-2 is more profitable than Model-1 when the replacement cost (C7) is below 5069. View evidence ↗
- At a failure rate of λ = 0.05, Model-2 is more profitable than Model-1 when the replacement cost (C7) is below 4428. View evidence ↗
What it means
- The authors conclude that no single reliability model is superior in all scenarios; the best model depends on the specific operational conditions. View evidence ↗
Figures & tables
From the original paper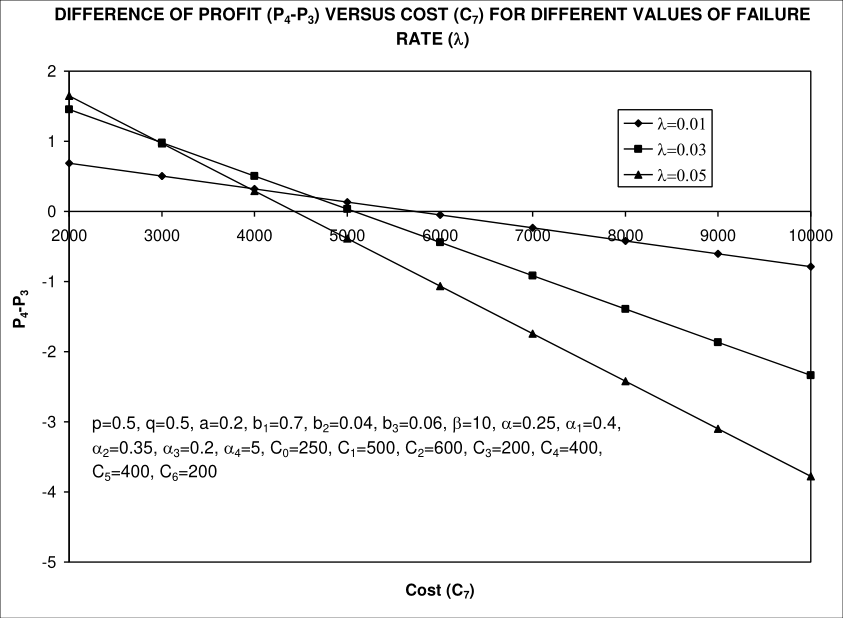 Figure 1
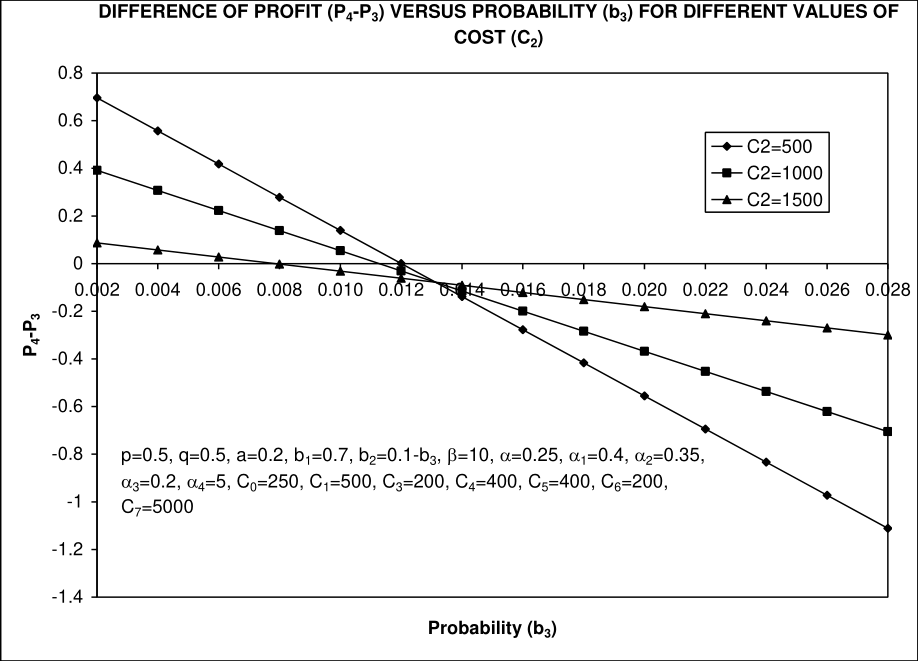 Figure 2
Introduction
In the earlier papers [3][4] systems have been analysed introducing the concept of three types of repair policy. Discussed in these models, it has been assumed that unit damaged by the ordinary repairman is repairable. However, there may be possibility that the such damaged unit is irreparable and hence needs to be replaced. Introducing this possibility of replacement, a twounit cold standby system with three types of repair policy has been analysed. When the ordinary repairman tries to repair the failed unit, there are the following possibilities: a) The ordinary repairman completes the repair successfully. b) The ordinary repairman is unable to successfully complete the repair but the process of repair adopted by him is correct. c) The ordinary repairman is unable to successfully complete the repair and the process adopted for repair is incorrect d) The ordinary repairman is unable to successfully complete the repair and he rather damages the unit due to mishandling or some other causes as a result of which unit may or may not be repairable. In case, it is irreparable, it needs to be replaced.
Other assumptions are same as taken in paper-3. Various measures of system effectiveness including busy period for replacement time and expected number of replacements have been obtained. System is analysed graphically for a particular case when all the time distributions are considered as exponential. Various cutoff points for rates/costs showing the null profit (before or after which profit is negative or positive) have been obtained. Models discussed in the papers [3][4] have been analysed individually in the respective papers.
Various cutoff points for various rates / costs / probabilities, prior or beyond which the system is profitable, have been obtained. However, no model is best in every situation. A model may be better in some situations but worse in some other situations. So it is highly significant to make the comparative study of the models taking two at a time to know under which situation one is better than the other so far as the economical aspect concerned. Pairwise comparative analysis of the models through graphs is carried out for the same particular cases as taken in the previous papers for concerned models. The assumed values for various rates/costs/probabilities have been mentioned along with graphs. Let P i be the profit of the model discussed in the i th paper and P ij be the profit of j th model of the i th paper.
Let us now compare the models (taking two at a time) through graphs on the basis of profit aspect.
Comparison between Two Models Discussed in Reference 3 and Reference 4
Two graphs have been plotted for depicting the behaviour of the difference varying failure rate/cost/probability. The behaviour observed is explained below: (A) Behaviour of the difference between P 4 and P 3 with respect to replacement cost (C 7 ) for different values of failure rate () is shown as in Fig. 1. Through this figure following observations can be made:
1. At the initial stage, for the values of the cost (C 7 ), i.e., up to 3000, the difference (P 4 P 3 ) is higher for higher values of . But the difference decreases more rapidly for higher values of , as a result of which the trend gets reversed for C 7 > 4600.
2. For = 0.01, (P 4 P 3 ) > or = or < 0 according as C 7 < or = > 5731. Therefore, model of reference 4 is better or worse than the model of reference 3 according as C 7 < or > 5731. Both the models are equally good if C 7 = 5731.
Figures and tables from the paper
References
7 in the original paper- Goyal V, Murari K. Cost analysis of a two unit cold standby system with two types of repairman, Microelectron Rliab. 1984; 24:849-855.
- Gupta Rashmi. Stochastic Analysis of a Reliability Model for One-Unit System with Three Types of Repair Policy. 2017; 2(6):126-130.
- Gupta Suresh Kumar, Gupta Rashmi. Economic analysis of a reliability model for two-unit cold standby system with three types of repair policy. Aryabhatta Journal of Mathematics and Informatics. 2016; 8(2):243-252.
- Goyal Rashmi, Gupta SK, Kumar Ashok. Reliability and Economic analysis of a two unit cold standby system with three types of repair policy and replacement. J Indian Soc. Stat. Opers. Res. 2005; XXVI(1-4):1-12.
- Tuteja RK, Taneja Gulshan, Vashistha Upasana. Twodissimilar units system wherein standby unit in working state may stop even without failure. International Journal of management and Systems. 2001; 17(1):77-100.
- Kumar A, Gupta SK, Taneja G. Comparative study of the profit of a two server system including patience time and instruction time, Microelectron, Reliab. 1996; 36(10):1595-1601.
- Kumar A, Gupta SK, Taneja G. Probabilistic analysis of a two-unit cold standby system with instructions at need. Micelectron. Reliab. 1995; 35(5):829-832.