
Research article · 2026 · Full text
International Journal of Geography Geology and EnvironmentComparative analysis of land use/land cover dynamics and landscape pattern changes in three local planning areas of South Karnataka, India (1995-2025)
Volume 8(9) · Pages 227–234 · DOI: 10.22271/27067483.2026.v8.i9c.883 ↗
Research areasRemote Sensing and Land UseLand Use and Ecosystem ServicesEnvironmental Changes in China
Abstract
Author-writtenLand use/land cover (LULC) change associated with urbanisation is an important concern for sustainable spatial planning and landscape management. This study comparatively assesses the spatio-temporal dynamics of LULC and landscape configuration in the Mysuru-Nanjangud, Shivamogga-Bhadravati and Tumakuru Local Planning Areas of Karnataka, India, during 1995-2025. Multi-temporal Landsat satellite imagery was classified into five LULC classes including agriculture, built-up land, waterbodies, vegetation and barren land using supervised classification in QGIS. Changes in LULC composition were assessed through area-based analysis, while landscape-level changes were evaluated using FRAGSTATS with six metrics: CONTAG, DIVISION, SPLIT, MESH, SHDI and SHEI. The results show substantial expansion of built-up land in all three LPAs, with the highest increase in Shivamogga-Bhadravati LPA (71.68 km2), followed by Mysuru-Nanjangud (68.61 km2) and Tumakuru (45.40 km2). Mysuru-Nanjangud recorded a marked decline in agricultural land, whereas Shivamogga-Bhadravati and Tumakuru showed increases in agricultural area. Barren land declined substantially in all three LPAs, while waterbodies decreased throughout the study period. Landscape metrics revealed distinct structural responses: Shivamogga-Bhadravati experienced the strongest increase in fragmentation, Mysuru-Nanjangud showed notable changes in aggregation and diversity, and Tumakuru exhibited comparatively stable landscape configuration. The findings demonstrate that similar LULC transformations can produce different landscape-level responses depending on the spatial arrangement of land-cover patches, highlighting the need for integrated and landscape-sensitive planning in rapidly changing urban regions.
Summary
Source-checkedPlain-language reading of the full paper, prepared with AI and checked against the text. Each point links to the authors' own words.
Why it matters
- Rapid urbanization in developing countries often converts agricultural and vegetated lands into urban areas, which changes the ecological and spatial characteristics of the landscape. View evidence ↗
The question
- The study aims to comparatively analyze the changes in land use/land cover (LULC) and landscape patterns in three Local Planning Areas (LPAs) of South Karnataka, India, from 1995 to 2025. View evidence ↗
What they did
- The research focuses on three specific regions: the Mysuru-Nanjangud, Shivamogga-Bhadravati, and Tumakuru Local Planning Areas. View evidence ↗
What they found
- All three areas saw significant urban growth, with the largest increase in built-up land occurring in Shivamogga-Bhadravati (71.68 km²), followed by Mysuru-Nanjangud (68.61 km²) and Tumakuru (45.40 km²). View evidence ↗
- Mysuru-Nanjangud showed a significant decrease in landscape aggregation, with the CONTAG metric falling from 29.6295 to 18.6378. View evidence ↗
Figures & tables
From the original paper Table 1
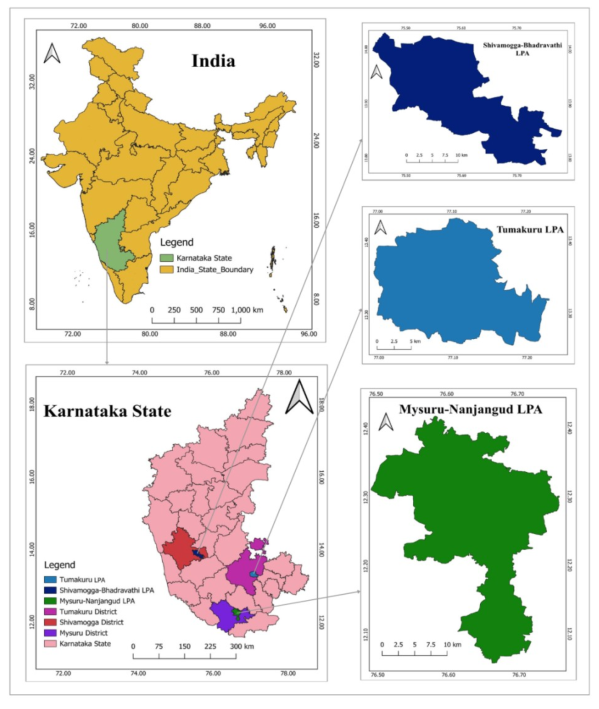 Figure 1
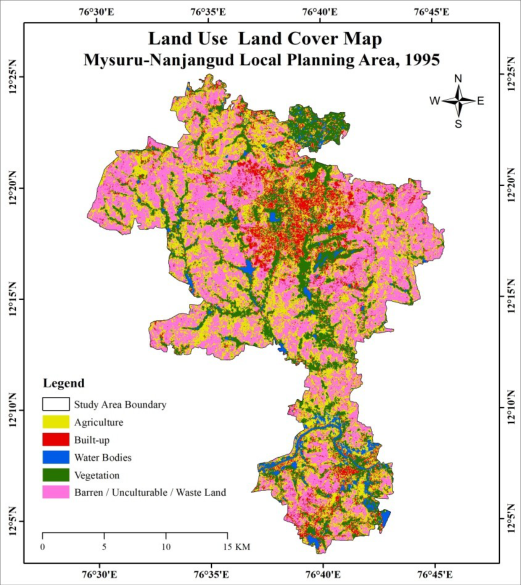 Figure 2
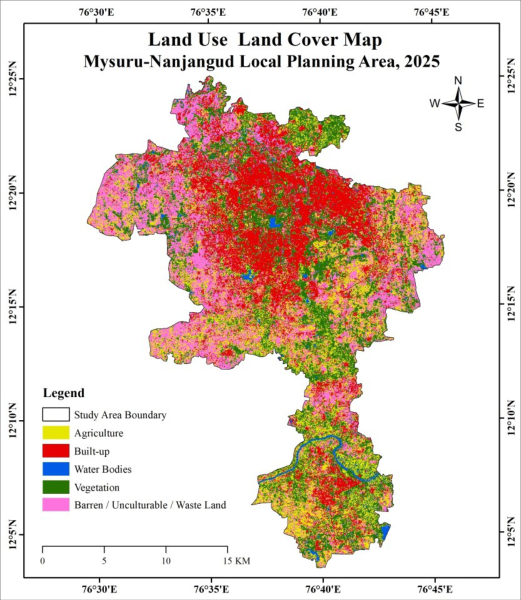 Figure 3
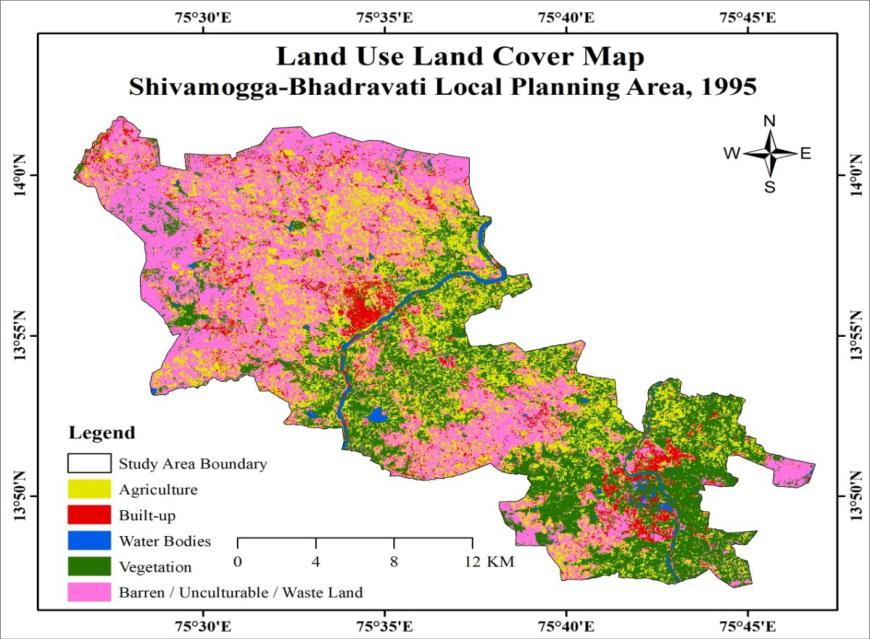 Figure 4
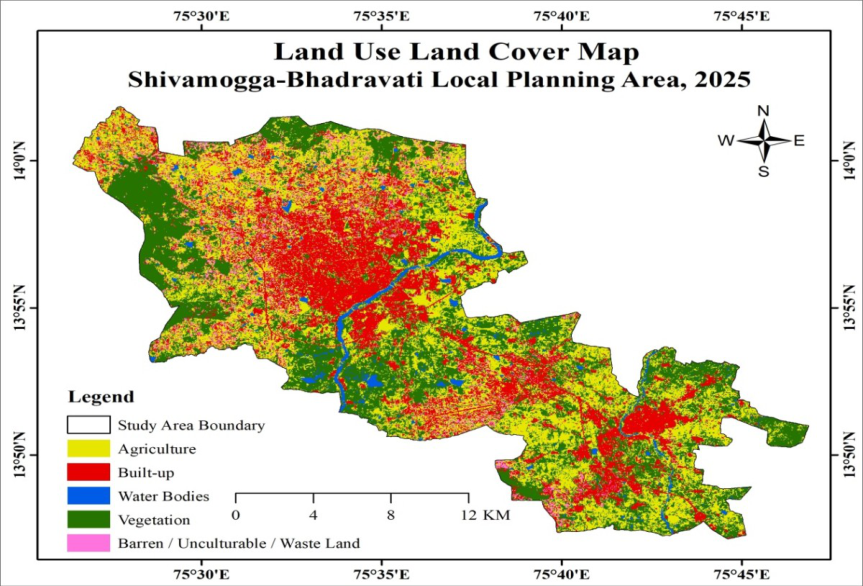 Figure 5
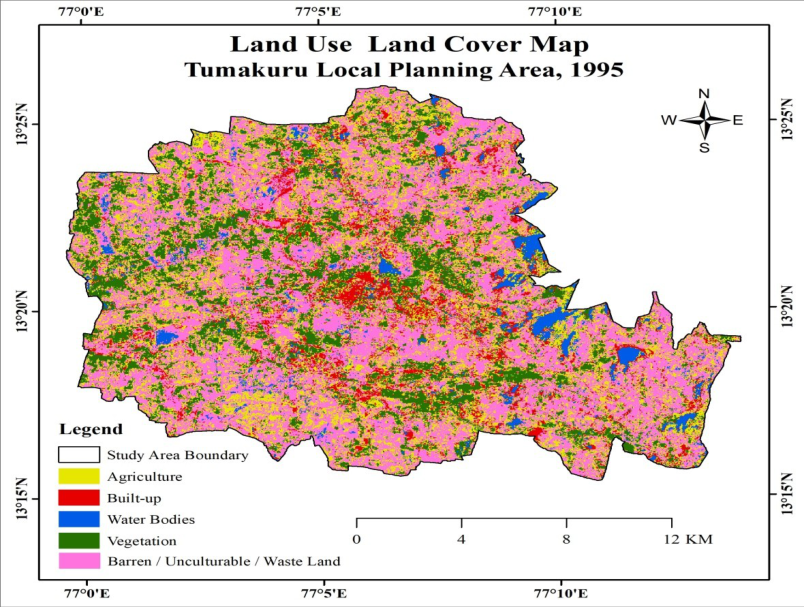 Figure 6
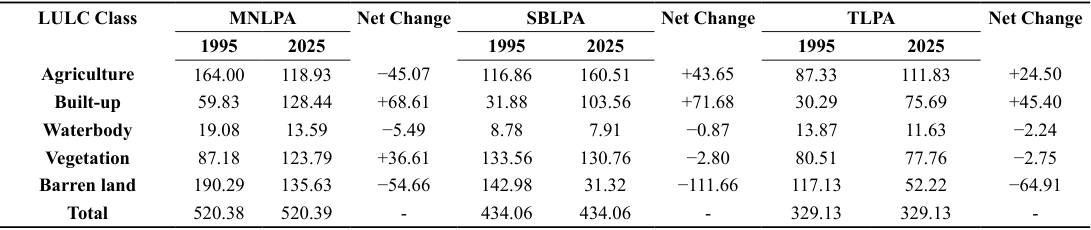 Table 2
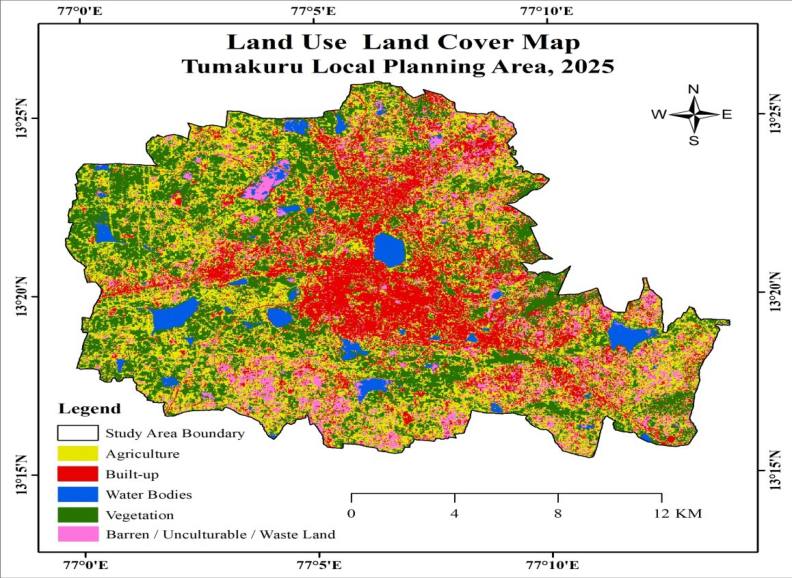 Figure 7
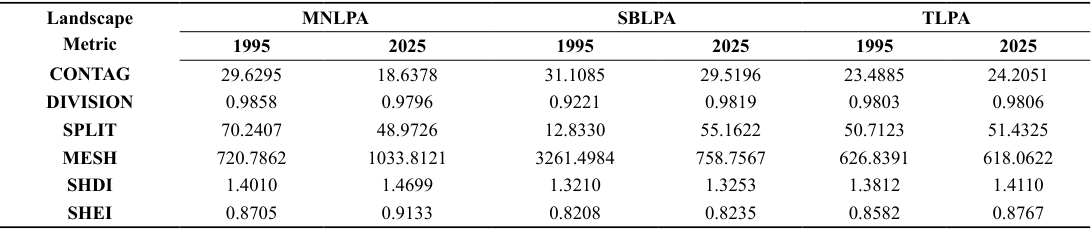 Table 3
Introduction
Land use/land cover (LULC) change is an important component of environmental and landscape transformation, reflecting interactions between human activities and natural processes. Population growth, urbanisation, economic development and changing land-use demands have resulted in substantial transformations of agricultural land, vegetation, barren land, water resources and built-up areas (Lambin et al., 2003; Turner et al., 2007) [2,1] . Understanding these changes is essential for sustainable land management and effective spatial planning. Rapid urbanisation is a major driver of LULC transformation, particularly in developing countries. Urban expansion frequently involves the conversion of agricultural, vegetated and open lands, thereby altering the spatial and ecological characteristics of surrounding landscapes (Seto et al., 2011; Seto et al., 2012) [3,4] . Recent studies in India have reported substantial increases in built-up areas accompanied by changes in agricultural, vegetation, barren land and waterbody classes, highlighting the continuing influence of urban growth on regional land systems (Bharath et al., 2023; Lakshmipathi et al., 2025; Nooji et al., 2025) [5,6,7] . A recent systematic review further emphasises the growing application of LULC analysis and landscape metrics for understanding urban expansion and fragmentation in India (Sharma et al., 2024) [8] . Remote sensing and Geographic Information System (GIS) techniques provide effective approaches for monitoring and quantifying LULC changes over time. Multi-temporal satellite data facilitate the identification of changes in the extent and spatial distribution of LULC classes, while GIS supports their spatial analysis and comparison (Roy et al., 2010) [9] . Recent studies from Karnataka have documented substantial LULC transformation associated with urbanisation, including urban sprawl in Bengaluru Rural (Bharath et al., 2023) [5] , built-up expansion and changes in cropland, vegetation and wetlands in the Bengaluru Metropolitan Region (Lakshmipathi et al., 2025) [6] , and LULC transformation in the medium-sized coastal cities of Mangaluru and Udupi (Nooji et al., 2025) [7] .
The Mysuru region has also experienced considerable urban and landuse transformation. Previous studies have documented significant changes in LULC patterns and urban footprint using remote sensing, GIS and multi-temporal geospatial data (Manjunatha et al., 2020; Manjunatha et al., 2023) [10,11] . These studies provide an important regional basis for examining the longer-term transformation of the Mysuru-Nanjangud area. However, changes in the area of individual LULC classes alone do not fully explain landscape transformation. Similar increases in builtup land can produce different spatial patterns depending on patch size, distribution, connectivity and arrangement. Landscape metrics therefore provide an additional means of quantifying structural characteristics such as aggregation, fragmentation, division, effective mesh size, diversity and evenness (Herold et al., 2005; Jaeger, 2000) [ 12, 13] . Recent studies have demonstrated their usefulness in assessing urban fragmentation and spatial configuration, with landscapelevel changes reported in rapidly expanding urban regions of India (Barman et al., 2024; Mansingh et al., 2025; Engineering Proceedings, 2024) [14,15,16] . Recent research further indicates that LULC change and landscape structure may not respond proportionally. Urban expansion can produce substantial changes in contiguity, dispersion and edge characteristics, resulting in structural reorganisation of urban landscapes (Bindajam et al., 2026) [17] . Similarly, integrated LULC and landscape-fragmentation assessments have demonstrated significant restructuring of urban landscapes in rapidly growing Indian cities (Beuria et al., 2026) [18] . These findings highlight the importance of examining not only the magnitude of LULC change but also the spatial organisation of the resulting landscape patches. Despite the growing application of remote sensing, GIS and landscape metrics in India, comparative assessments of multiple Local Planning Areas (LPAs) integrating LULC composition with landscape-level configuration remain limited. LPAs provide an appropriate spatial framework for examining urban expansion alongside changes in surrounding agricultural, vegetation and open lands. A comparative approach can reveal whether similar LULC transformations produce comparable landscape responses or distinct structural patterns due to differences in the spatial arrangement of land-cover patches. Against this background, the present study comparatively examines the spatio-temporal dynamics of LULC and landscape-level changes in the Mysuru-Nanjangud, Shivamogga-Bhadravati and Tumakuru Local Planning Areas of Karnataka, India, during 1995-2025. The study assesses changes in major LULC classes and evaluates landscape configuration using CONTAG, DIVISION, SPLIT, MESH, SHDI and SHEI. By integrating LULC change analysis with landscape metrics, the study identifies differences in the magnitude, direction and spatial structure of landscape transformation among the three planning areas and provides a comparative basis for landscape-sensitive land-use planning.
Study area
The study covers three Local Planning Areas (LPAs) of south Karnataka, India: Mysuru-Nanjangud LPA (MNLPA), Shivamogga-Bhadravati LPA (SBLPA), and Tumakuru LPA (TLPA). The three LPAs represent important urban and regional planning areas with diverse land-use characteristics and varying degrees of urban development. They were selected to comparatively examine LULC transformation and associated changes in landscape configuration during 1995-2025. The Mysuru-Nanjangud LPA extends between 12.06°-12.42° N latitude and 76.49°-76.76° E longitude, covering approximately 520.39 km 2 . The LPA encompasses Mysuru and Nanjangud and their surrounding settlements and rural landscapes. The area has experienced considerable urban expansion accompanied by changes in agricultural, vegetated and open lands. The Shivamogga-Bhadravati LPA extends between 13.78°-14.03° N latitude and 75.44°-75.78° E longitude, covering approximately 434.06 km 2 . It encompasses the cities of Shivamogga and Bhadravati and their surrounding settlements. The LPA comprises a mixture of urban, agricultural, vegetated and open landscapes and has undergone significant land-use transformation. The Tumakuru LPA extends between 13.26°-13.43° N latitude and 76.99°-77.23° E longitude, covering approximately 329.13 km 2 . The LPA includes Tumakuru city and its surrounding planning area, characterised by a combination of built-up, agricultural, vegetated and barren lands.
Materials and methods
Materials and methods
Satellite data and pre-processing
Multi-temporal Landsat satellite imagery was used to assess LULC changes. Images with less than 10% cloud cover and 30 m spatial resolution were selected for the analysis. Landsat 5 imagery was used for the earlier observation periods and Landsat 8 for the later periods. The details of the satellite datasets are presented in Table 1. The selected images were processed using QGIS and clipped to the respective LPA boundaries. The imagery was prepared for classification and analysed using consistent LULC categories across the study period.
| LPA | Date | Satellite | Path | Row | Spatial Resolution | Cloud Cover |
|---|---|---|---|---|---|---|
| MNLPA | 22 January 1995 | Landsat 5 | 144 | 52 | 30 m | < 10% |
| 19 April 2025 | Landsat 8 | 144 | 52 | 30 m | < 10% | |
| SBLPA | 15 February 1995 | Landsat 5 | 145 | 50 | 30 m | < 10% |
| 03 October 2025 | Landsat 8 | 145 | 51 | 30 m | < 10% | |
| TLPA | 23 February 1995 | Landsat 5 | 144 | 51 | 30 m | < 10% |
| 13 March 2025 | Landsat 8 | 144 | 51 | 30 m | < 10% |
Table text extracted from the original PDF; superscript letters are shown inline. The original table image is below.
View original table image
LULC classification and change analysis
LULC classification and change analysis
Results and discussion
Results and discussion
Spatio-temporal dynamics of LULC
The analysis examines the distribution of major LULC classes in 1995 and 2025 and their subsequent gains and losses. The spatial patterns observed from the LULC maps are compared with the quantitative changes to understand the extent and nature of urban expansion, agricultural transformation, changes in vegetation and waterbodies, and the reduction of barren land across the three LPAs. The LULC maps (Figs. 234567) and Table 2 reveals substantial changes in the three Local Planning Areas between 1995 and 2025. The most consistent trend was the expansion of built-up land, accompanied by significant changes in agricultural and barren land. However, the magnitude and direction of these changes varied considerably among the LPAs, indicating different patterns of landscape transformation.
Mysuru-Nanjangud local planning area (MNLPA)
In MNLPA, barren land was the dominant class in 1995 (190.29 km 2 ), followed by agriculture (164.00 km 2 ). By 2025, built-up land had increased from 59.83 to 128.44 km 2 , recording a net gain of 68.61 km 2 . This represents more than a twofold increase in built-up area and indicates substantial urban expansion during the study period. In contrast, agricultural land declined by 45.07 km 2 , suggesting increasing pressure on agricultural land associated with urban growth. Vegetation increased from 87.18 to 123.79 km 2 (+36.61 km 2 ), while barren land declined by 54.66 km 2 . The concurrent changes suggest that the reduction in barren land was associated with its redistribution among vegetation, built-up and other land-use categories. Waterbodies experienced a relatively small decline of 5.49 km 2 . Overall, MNLPA shows a pronounced transition towards a more urbanised and heterogeneous landscape, with a notable reduction in agricultural and barren land.
Shivamogga-Bhadravati local planning area (SBLPA)
SBLPA experienced the largest overall built-up expansion among the three LPAs. Built-up land increased from 31.88 to 103.56 km 2 , representing a net increase of 71.68 km 2 . This more than threefold increase is clearly reflected in the spatial expansion of built-up areas between 1995 and 2025. Such growth indicates intensification and outward expansion of urban land within the planning area. The most substantial decline was observed in barren land, which decreased from 142.98 to 31.32 km 2 (-111.66 km 2 ). At the same time, agricultural land increased by 43.65 km 2 , from 116.86 to 160.51 km 2 . The contrasting changes indicate substantial restructuring of previously barren or lessutilised areas, with increases in both agricultural and built-up land. Vegetation remained relatively stable, declining only marginally by 2.80 km 2 , while waterbodies decreased by 0.87 km 2 . Thus, SBLPA is characterised primarily by rapid urban expansion and extensive reduction of barren land, accompanied by an increase in agricultural extent.
Tumakuru local planning area (TLPA)
In TLPA, barren land was the largest class in 1995 (117.13 km 2
), followed by agriculture (87.33 km 2 ) and vegetation (80.51 km 2 ). By 2025, built-up land had increased from 30.29 to 75.69 km 2 , recording a gain of 45.40 km 2 . Although lower in absolute magnitude than the increases observed in MNLPA and SBLPA, the change represents a substantial expansion relative to the initial built-up area. Barren land declined by 64.91 km 2 , while agricultural land increased by 24.50 km 2 . This indicates considerable transformation of barren areas into productive and developed land uses. Vegetation and waterbodies showed relatively small reductions of 2.75 and 2.24 km 2 , respectively. The overall pattern therefore indicates moderate urbanisation accompanied by substantial restructuring of barren and agricultural land.
Comparative LULC transformation
The comparison reveals that built-up expansion was the dominant and common trend across all three LPAs. SBLPA recorded the highest absolute increase (71.68 km 2
), closely followed by MNLPA (68.61 km 2 ), while TLPA recorded a lower increase (45.40 km 2 ). However, when considered relative to their respective initial built-up areas, SBLPA experienced the most pronounced proportional expansion. Agricultural trajectories differed substantially. MNLPA recorded a decline of 45.07 km 2 , whereas SBLPA and TLPA recorded increases of 43.65 and 24.50 km 2 , respectively. This contrast suggests stronger urban pressure on agricultural land in MNLPA, while agricultural expansion was more prominent in SBLPA and TLPA. Barren land declined in all three LPAs, with the greatest reduction occurring in SBLPA (111.66 km²), followed by TLPA (64.91 km²) and MNLPA (54.66 km²). Vegetation increased substantially only in MNLPA, whereas it remained relatively stable in SBLPA and TLPA. Waterbody extent declined across all three LPAs, although the magnitude of change was comparatively small. The results demonstrate progressive urban expansion and substantial reorganisation of the landscape between 1995 and 2025, but with distinct trajectories. MNLPA shows urban expansion coupled with agricultural loss and vegetation increase; SBLPA exhibits the strongest built-up growth and the largest reduction in barren land; while TLPA represents a comparatively moderate urbanising landscape with expansion of agriculture and reduction of barren land. These differences provide the basis for examining whether the observed LULC changes have also altered the spatial configuration, fragmentation, diversity and connectivity of the landscape, which is assessed using the landscape-level metrics in Table 3.
Changes in landscape-level pattern and fragmentation
The analysis further examines whether changes in LULC composition have resulted in corresponding changes in landscape structure. Selected landscape metrics, including CONTAG, DIVISION, SPLIT, MESH, SHDI, and SHEI, are used to assess changes in landscape aggregation, fragmentation, patch division, effective mesh size, diversity, and evenness. A comparative assessment helps identify differences in the structural response of MNLPA, SBLPA, and TLPA to LULC transformation. The CONTAG values provide an indication of landscape aggregation, while DIVISION and SPLIT describe landscape fragmentation and subdivision. MESH represents effective mesh size, whereas SHDI and SHEI describe landscape diversity and evenness, respectively. Together, these metrics provide a more comprehensive understanding of the structural consequences of the LULC transformations identified in Table 2.
Comparative landscape-level response to LULC transformation
The landscape metrics indicate distinct structural responses among the three LPAs. SBLPA experienced the greatest increase in landscape fragmentation, MNLPA showed notable changes in landscape aggregation and diversity, while TLPA exhibited comparatively stable landscape configuration despite changes in LULC composition. These findings indicate that changes in LULC composition do not necessarily result in similar changes in landscape structure, as the spatial arrangement and distribution of land-cover patches strongly influence landscape-level patterns.
Conclusion
The comparative analysis of LULC dynamics in the Mysuru-Nanjangud, Shivamogga-Bhadravati, and Tumakuru Local Planning Areas shows substantial landscape transformation during 1995-2025. Built-up land increased considerably in all three LPAs, although the magnitude and nature of change varied across the areas. Mysuru-Nanjangud LPA experienced a marked increase in built-up land along with a decline in agricultural land and an increase in vegetation. Shivamogga-Bhadravati LPA recorded the highest built-up expansion and greatest reduction in barren land, accompanied by an increase in agricultural land. Tumakuru LPA showed comparatively moderate urban expansion, with increases in agriculture and reductions in barren land. Waterbodies declined in all three LPAs. The landscape metrics indicate different structural responses to these LULC changes. SBLPA experienced the strongest fragmentation, MNLPA showed notable changes in aggregation and diversity, while TLPA exhibited comparatively stable landscape configuration. These findings demonstrate that changes in LULC composition do not necessarily produce similar changes in landscape structure, as the spatial arrangement of land-cover patches also influences landscape patterns. The findings emphasise the importance of integrated land-use planning and landscape-sensitive development to manage urban expansion while conserving agricultural land, vegetation and water resources in the rapidly changing planning areas of Karnataka.
Figures and tables from the paper
References
18 in the original paper- Turner BL II, Lambin EF, Reenberg A. The emergence of land change science for global environmental change and sustainability. Proceedings of the National Academy of Sciences. 2007;104(52):20666-20671.
- Lambin EF, Geist HJ, Lepers E. Dynamics of land-use and landcover change in tropical regions. Annual Review of Environment and Resources. 2003;28:205-241.
- Seto KC, Fragkias M, Güneralp B, Reilly MK. A meta-analysis of global urban land expansion. PLoS ONE. 2011;6(8):e23777.
- Seto KC, Güneralp B, Hutyra LR. Global forecasts of urban expansion to 2030 and direct impacts on biodiversity and carbon pools. Proceedings of the National Academy of Sciences. 2012;109(40):16083-16088.
- Bharath A, et al. Evaluation of land use/land cover changes due to urban sprawl in Bengaluru Rural, Karnataka, India. Discrete Dynamics in Nature and Society. 2023;2023:8077644.
- Lakshmipathi TL, Nagendra HN, Konikar GSM, Kavyashree UA. Spatiotemporal analysis of land use and land cover changes in Bengaluru Metropolitan Region (1990-2023) using GIS and remote sensing. Journal of Geography, Environment and Earth Science International. 2025;29(2):113-127.
- Nooji S, Kini S, Holla MR. LULC transformation and urbanization impacts on thermal and ecological dynamics in the mediumsized coastal cities of Mangaluru and Udupi, Karnataka, India. Discover Applied Sciences. 2025.
- Sharma M, Kumar V, Kumar S. A systematic review of urban sprawl and land use/land cover change studies in India. Urban Science. 2024.
- Roy PS, Roy A. Land use and land cover change in India: A remote sensing & GIS perspective. Journal of the Indian Institute of Science. 2010;90(4):489-502.
- Manjunatha CS, Chandrashekara B. Assessment of changing landuse and landcover pattern in the Mysore Local Planning District (LPD) using remote sensing and GIS. Science, Technology and Development. 2020;9(10):206-216.
- Manjunatha CS, Dhanaraj K, Chandrashekara B. Tracing and analysis of urban footprint and its future implications in an emerging metropolis of Mysuru, India, using geoinformatics techniques. Geographical Analysis. 2023;12(1):1-12.
- Herold M, Couclelis H, Clarke KC. The role of spatial metrics in the analysis and modeling of urban land use change. Computers, Environment and Urban Systems. 2005;29(4):369-399.
- Jaeger JAG. Landscape division, splitting index, and effective mesh size: New measures of landscape fragmentation. Landscape Ecology. 2000;15:115-130.
- Barman S, Roy D, Sarkar BC, Almohamad H, Abdod HG. Assessment of urban growth in relation to urban sprawl using landscape metrics and Shannon's entropy model in Jalpaiguri urban agglomeration, West Bengal, India. Geocarto International. 2024;39(1).
- Mansingh A, Pradhan A, Rath LP, et al. Spatio-temporal analysis of fragmentation and rapid land use changes in an expanding urban region of eastern India. Discover Sustainability. 2025;6:131.
- Urban Growth Analysis Using Multi-Temporal Remote Sensing Image and Landscape Metrics for Smart City Planning of Lucknow District, India. Engineering Proceedings. 2024.
- Bindajam AA, Mallick J, Alshayeb MJ, Poddar S. Understanding urbanization and its expansion process in Bengaluru through geostatistical models for landscape management. Advances in Space Research. 2026;77(3):2855-2880.
- Beuria R, Sahu SC, Nandi D. Decoding urban sprawl in Bhubaneswar (2000-2025): A spatio-temporal LULC and landscape fragmentation analysis. Advances in Space Research. 2026;77(9):8804-8826.