
Research article · 2026 · Full text
International Journal of Horticulture and Food ScienceEffect of plant growth regulators on fruit yield and quality of guava (Psidium guajava L.) cv. Allahabad Safeda
Volume 8(9) · Pages 116–119 · DOI: 10.33545/26631067.2026.v8.i9b.863 ↗
Research areasPlant Physiology and Cultivation StudiesPlant Growth Enhancement TechniquesPsidium guajava Extracts and Applications
Abstract
Author-writtenA field experiment was conducted during 2025–26 at the Instructional-cum-Research Fruit Orchard, Tantia University, Sri Ganganagar, Rajasthan, India, to evaluate the effects of plant growth regulators on fruit yield and quality of guava (Psidium guajava L.) cv. Allahabad Safeda. Eleven treatments comprising NAA, GA3, Ethrel and CCC at different concentrations along with a water-spray control were evaluated in a Randomized Block Design with three replications. Six-year-old uniform trees were subjected to two foliar applications at a 30-day interval, commencing on 20 August 2025. NAA 100 ppm (T2) recorded the highest number of fruits tree-1 (251.17), average fruit weight (223.37 g) and fruit yield (56.10 kg tree-1). The same treatment produced the lowest fruit acidity (0.25%), highest TSS ratio (46.48), ascorbic acid content (180.11 mg 100 g−1 pulp) and pectin content (1.61%). In contrast, GA3 150 ppm (T4) recorded the highest TSS (12.67 °Brix), reducing sugar (5.82%), non-reducing sugar (4.60%) and total sugar (10.42%). Treatment effects were significant for the evaluated yield and quality attributes. Overall, NAA 100 ppm was associated with superior fruit productivity and several quality parameters, whereas GA3 150 ppm showed a distinct response for soluble solids and sugar accumulation. These findings demonstrate that the response of guava cv. Allahabad Safeda to PGR application is concentration- and trait-dependent under the agro-climatic conditions of Sri Ganganagar, Rajasthan.
Summary
Source-checkedPlain-language reading of the full paper, prepared with AI and checked against the text. Each point links to the authors' own words.
Why it matters
- Guava is a valuable tropical and subtropical fruit crop known for its nutritional content and ability to grow in various conditions. View evidence ↗
- Plant growth regulators (PGRs) are used to modify key physiological processes, including fruit development, retention, and overall quality. View evidence ↗
What they did
- The experiment used six-year-old 'Allahabad Safeda' guava trees planted with 6 m × 6 m spacing. View evidence ↗
- A Randomized Block Design was used with 11 treatments and three replications, totaling 66 experimental trees. View evidence ↗
- PGRs were applied as foliar sprays twice, with the first application on August 20, 2025, and the second 30 days later. View evidence ↗
What they found
- NAA at 100 ppm (T2) achieved the highest fruit number (251.17 per tree), average fruit weight (223.37 g), and total yield (56.10 kg per tree). View evidence ↗
- NAA 100 ppm (T2) resulted in the lowest fruit acidity at 0.25%, while the control had the highest at 0.39%. View evidence ↗
- GA3 150 ppm (T4) led to the highest levels of reducing sugar (5.82%), non-reducing sugar (4.60%), and total sugar (10.42%). View evidence ↗
What it means
- The authors conclude that NAA 100 ppm is the most consistent for improving productivity and quality, whereas GA3 150 ppm is best for increasing sugars and soluble solids. View evidence ↗
Visual summary
2 visualsIllustrations explain the paper; charts are replotted from the paper's own table values.
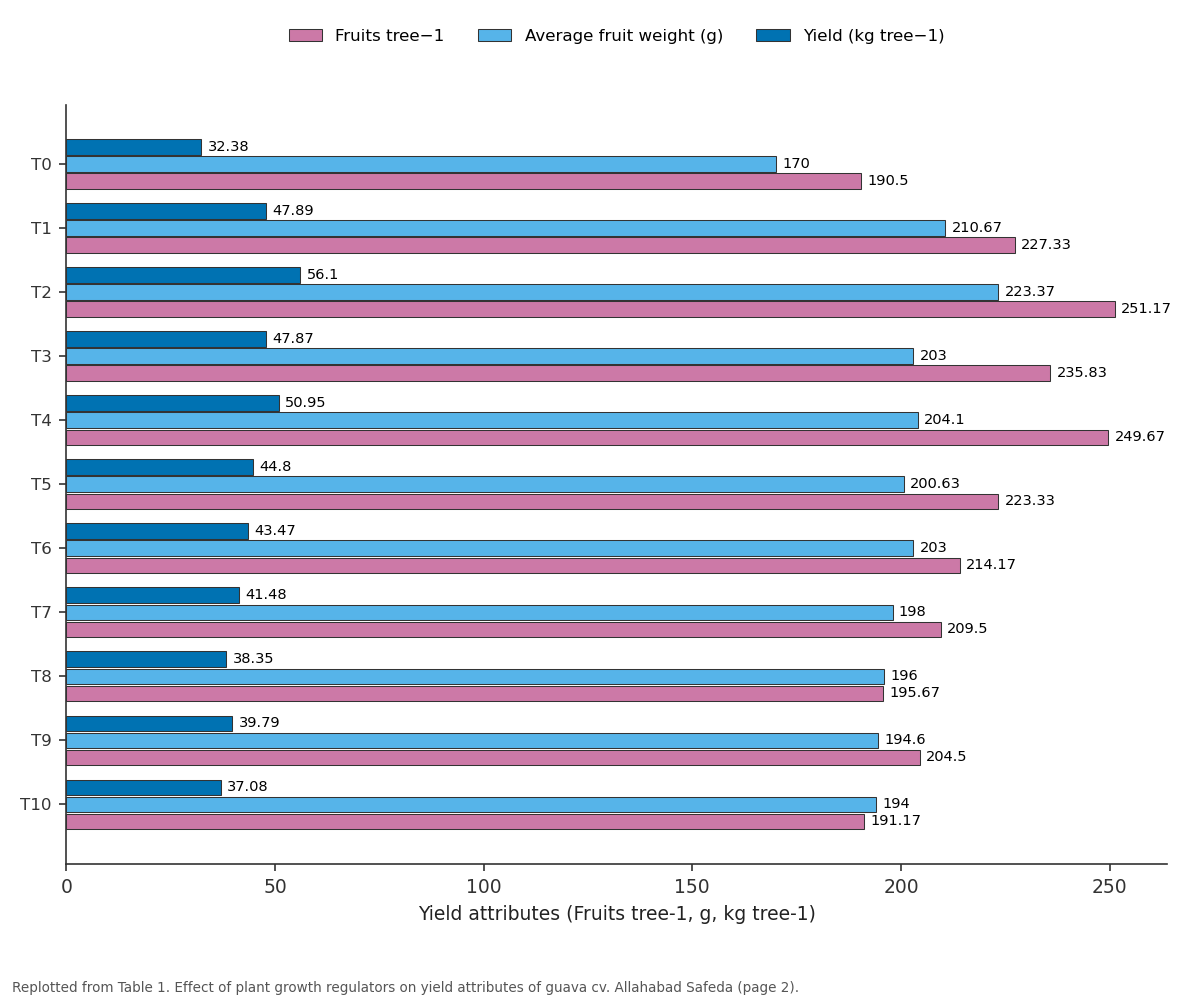
Fruits tree−1 and Average fruit weight (g) and more: T0 vs T1 vs T2 vs T3 vs T4
Replotted from Table 1 (page 2) of the original paper. Every bar is the paper's own table value.
View source evidence ↗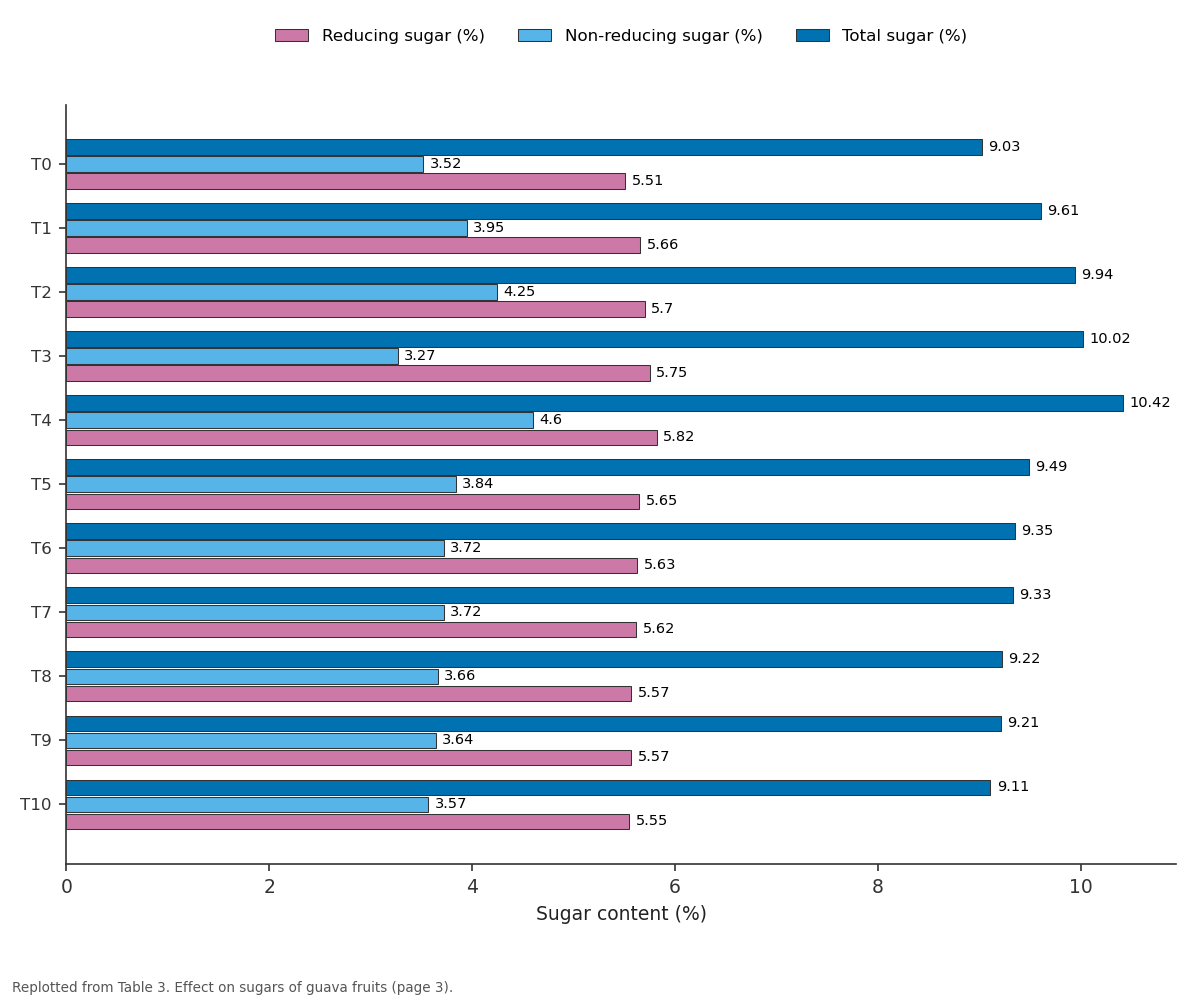
Reducing sugar (%) and Non-reducing sugar (%) and more: T0 vs T1 vs T2 vs T3 vs T4
Replotted from Table 3 (page 3) of the original paper. Every bar is the paper's own table value.
View source evidence ↗Figures & tables
From the original paper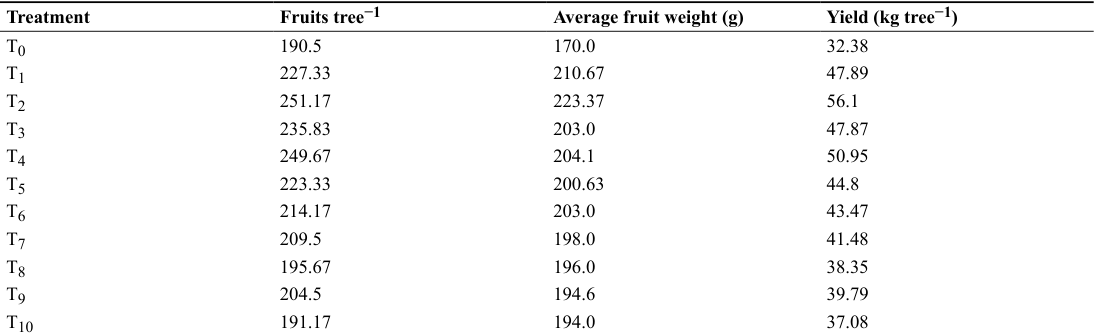 Table 1
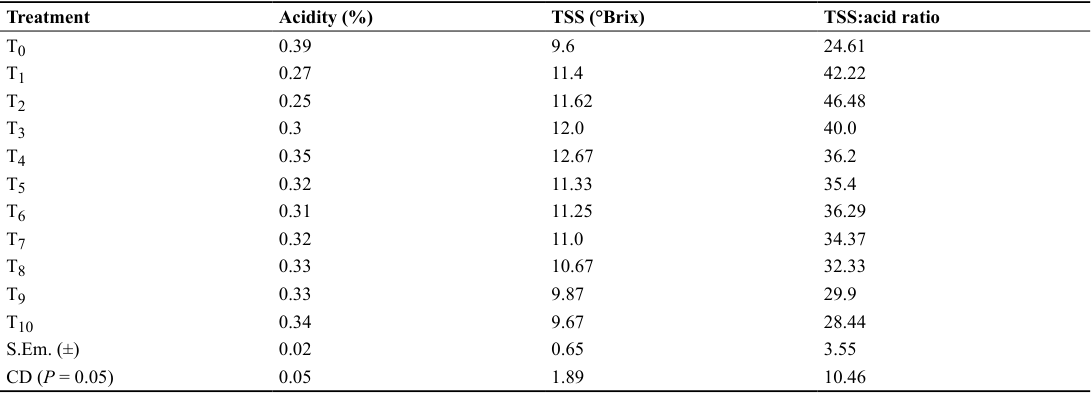 Table 2
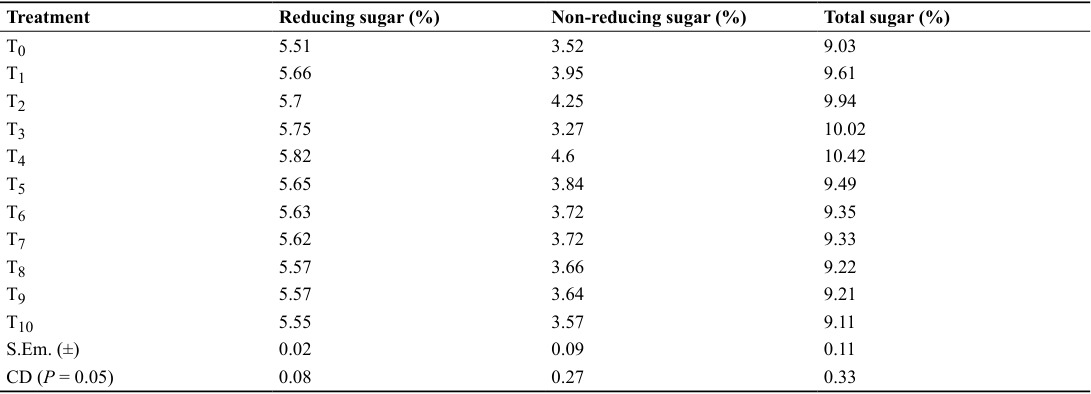 Table 3
 Table 1
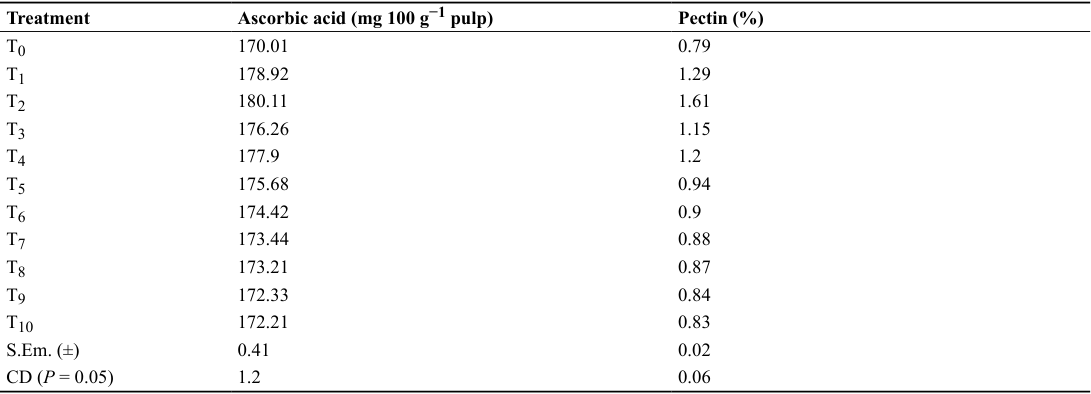 Table 4
Introduction
Guava (Psidium guajava L.) is an economically important tropical and subtropical fruit crop valued for its distinctive flavour, nutritional composition and adaptability to diverse growing conditions. The commercial value of guava is determined not only by fruit yield but also by a range of physical and biochemical attributes, including fruit weight, total soluble solids (TSS), acidity, sugars, ascorbic acid and pectin. These characteristics are influenced by cultivar, season, environmental conditions and crop-management practices. Plant growth regulators (PGRs) are important tools for modifying physiological processes associated with flowering, fruit retention, fruit development and fruit quality. Auxins such as naphthalene acetic acid (NAA) can influence fruit retention and development, whereas gibberellic acid (GA 3 ) is associated with cell enlargement and changes in fruit growth and quality. Other growth regulators, including Ethrel and cycocel (CCC), can alter vegetative and reproductive growth and may consequently influence yield and fruit composition. Previous studies have demonstrated considerable variation in the response of guava to PGR type and concentration. In Allahabad Safeda, foliar application of NAA and GA 3 has been reported to improve yield and several fruit-quality attributes, although the magnitude of response differed among concentrations and experimental conditions. Field studies have also reported favourable effects of NAA on winter-season production of Allahabad Safeda, supporting the potential of PGR-based crop regulation for improving productivity. More recent investigations continue to demonstrate that PGR responses in guava are concentration-dependent and can influence both yield attributes and biochemical quality characteristics. Despite these findings, the relative response of guava cv. Allahabad Safeda to different concentrations of NAA, GA 3 , Ethrel and CCC may vary under specific agro-climatic conditions. In particular, comparative information on these regulators under the growing conditions of Sri Ganganagar, Rajasthan, remains limited. Evaluating these treatments under local conditions is therefore relevant for identifying responses in fruit productivity and quality and for developing region-specific crop management recommendations. Therefore, the present investigation was undertaken to evaluate the effects of selected plant growth regulators and their concentrations on fruit yield and quality attributes of guava cv. Allahabad Safeda under the agro-climatic conditions of Sri Ganganagar, Rajasthan.
Materials and methods
Materials and methods
Experimental site and plant material
The experiment was conducted during 2025-26 at the Instructionalcum-Research Fruit Orchard, Department of Horticulture, Faculty of Agriculture, Tantia University, Sri Ganganagar, Rajasthan, India. The region experiences an arid to semi-arid climate with pronounced seasonal variation in temperature. Six-year-old, healthy and uniform trees of guava (Psidium guajava L.) cv. Allahabad Safeda, maintained at a spacing of 6 m × 6 m, were selected for the experiment.
Experimental design and treatments
The experiment was laid out in a Randomized Block Design (RBD) comprising 11 treatments and three replications. Two trees were maintained for each treatment in each replication, giving a total of 66 experimental trees. Plant growth regulators were applied as foliar sprays. The first spray was applied on 20 August 2025 and the second spray was applied 30 days after the first application. The treatments were: Treatment Description T 0 Control (water spray) T 1 NAA 50 ppm
Observations recorded
Observations were recorded for yield, physical fruit characteristics and biochemical quality attributes. Yield parameters included number of fruits tree -1 , average fruit weight and yield tree -1 . Fruit quality was evaluated in terms of acidity, total soluble solids (TSS), TSS ratio, reducing sugars, non-reducing sugars, total sugars, ascorbic acid and pectin. For fruit set estimation, four branches were randomly selected and tagged on each tree. Flowers and subsequently formed fruits were counted, and fruit set was calculated as:
CCC 800 ppm T 10 CCC 1200 ppm
Four mature fruits were randomly selected from each tree for quality analysis. Acidity was determined by acid-alkali titration following A.O.A.C. (1970), while TSS was measured using a hand refractometer and expressed as °Brix. The TSS ratio was calculated from the respective TSS and acidity values.
Reducing and total sugars were estimated by the Fehling's solution titration procedure, while nonreducing sugars were calculated as the difference between total and reducing sugars. Ascorbic acid was estimated by the method of Ranganna (1977) [1] , and pectin content was determined following Kertesz (1951). Average fruit weight was calculated as the total fruit weight divided by the number of fruits, while the number of fruits tree -1 was obtained by summing the fruits harvested at successive pickings. Yield tree -1 was calculated from the cumulative fruit weight recorded over all pickings.
Statistical analysis
The experimental data were subjected to analysis of variance (ANOVA) appropriate for a Randomized Block Design following Panse et al. (1984) [2] . Treatment effects were tested using the F-test, and the critical difference (CD) at the 5% probability level was calculated when the treatment effect was signifi-cant. The standard error of the mean [S.Em. (±)] was calculated from the error mean square and number of replications.
Results
Results
Fruit yield and yield attributes
The results presented in Table 1 revealed that the application of plant growth regulators significantly influenced the yield attributes of guava cv. Allahabad Safeda. Among the treatments, NAA at 100 ppm (T 2 ) recorded the highest number of fruits tree -1 (251.17), average fruit weight (223.37 g) and fruit yield (56.10 kg tree -1 ). The corresponding values under the control (T 0 ) were 190.50 fruits tree -1 , 170.00 g and 32.38 kg tree -1 , respectively. Thus, T 2 increased fruit number, average fruit weight and fruit yield by approximately 31.9, 31.4 and 73.2%, respectively, over the control. The treatment effect was statistically significant for all three yield attributes. The treatment mean squares for fruit number, average fruit weight and yield were 1433.52, 503.86 and 139.01, respectively, compared with error mean squares of 215.14, 6.82 and 0.55. The corresponding calculated F-values were 6.66, 73.88 and 252.75, indicating significant treatment effects at the 5% probability level.
| Treatment | Fruits tree−1 | Average fruit weight (g) | Yield (kg tree−1) |
|---|---|---|---|
| S.Em. (±) | 8.46 | 1.51 | 0.43 |
| CD (P = 0.05) | 24.99 | 4.45 | 1.27 |
Table text extracted from the original PDF; superscript letters are shown inline. The original table image is below.
View original table image
| Treatment | Fruits tree−1 | Average fruit weight (g) | Yield (kg tree−1) |
|---|---|---|---|
| T0 | 190.5 | 170.0 | 32.38 |
| T1 | 227.33 | 210.67 | 47.89 |
| T2 | 251.17 | 223.37 | 56.1 |
| T3 | 235.83 | 203.0 | 47.87 |
| T4 | 249.67 | 204.1 | 50.95 |
| T5 | 223.33 | 200.63 | 44.8 |
| T6 | 214.17 | 203.0 | 43.47 |
| T7 | 209.5 | 198.0 | 41.48 |
| T8 | 195.67 | 196.0 | 38.35 |
| T9 | 204.5 | 194.6 | 39.79 |
| T10 | 191.17 | 194.0 | 37.08 |
Table text extracted from the original PDF; superscript letters are shown inline. The original table image is below.
View original table image
Acidity, TSS and TSS ratio
The results presented in Table 2 revealed that plant growth regulator treatments significantly affected acidity, total soluble solids and TSS ratio of guava fruits. The lowest acidity was recorded with NAA 100 ppm (T 2 ; 0.25%), followed by T 1 (0.27%), whereas the control recorded the highest acidity (0.39%). The highest TSS was recorded with GA 3 150 ppm (T 4 ; 12.67 °Brix), followed by T
| Treatment | Acidity (%) | TSS (°Brix) | TSS:acid ratio |
|---|---|---|---|
| T0 | 0.39 | 9.6 | 24.61 |
| T1 | 0.27 | 11.4 | 42.22 |
| T2 | 0.25 | 11.62 | 46.48 |
| T3 | 0.3 | 12.0 | 40.0 |
| T4 | 0.35 | 12.67 | 36.2 |
| T5 | 0.32 | 11.33 | 35.4 |
| T6 | 0.31 | 11.25 | 36.29 |
| T7 | 0.32 | 11.0 | 34.37 |
| T8 | 0.33 | 10.67 | 32.33 |
| T9 | 0.33 | 9.87 | 29.9 |
| T10 | 0.34 | 9.67 | 28.44 |
| S.Em. (±) | 0.02 | 0.65 | 3.55 |
| CD (P = 0.05) | 0.05 | 1.89 | 10.46 |
Table text extracted from the original PDF; superscript letters are shown inline. The original table image is below.
View original table image
Sugars
The results presented in Table 3 revealed that the application of plant growth regulators significantly influenced the sugar content of guava fruits. GA 3 150 ppm (T 4 ). Significant differences were observed among plant growth regulator treatments for reducing, nonreducing and total sugars. GA 3 150 ppm (T 4 ) recorded the highest reducing sugar (5.82%), nonreducing sugar (4.60%) and total sugar (10.42%).
| Treatment | Reducing sugar (%) | Non-reducing sugar (%) | Total sugar (%) |
|---|---|---|---|
| T0 | 5.51 | 3.52 | 9.03 |
| T1 | 5.66 | 3.95 | 9.61 |
| T2 | 5.7 | 4.25 | 9.94 |
| T3 | 5.75 | 3.27 | 10.02 |
| T4 | 5.82 | 4.6 | 10.42 |
| T5 | 5.65 | 3.84 | 9.49 |
| T6 | 5.63 | 3.72 | 9.35 |
| T7 | 5.62 | 3.72 | 9.33 |
| T8 | 5.57 | 3.66 | 9.22 |
| T9 | 5.57 | 3.64 | 9.21 |
| T10 | 5.55 | 3.57 | 9.11 |
| S.Em. (±) | 0.02 | 0.09 | 0.11 |
| CD (P = 0.05) | 0.08 | 0.27 | 0.33 |
Table text extracted from the original PDF; superscript letters are shown inline. The original table image is below.
View original table image
The corresponding values under the control were 5.51, 3.52 and 9.03%, respectively. The treatment mean squares for reducing sugar, non-reducing sugar and total sugar were 0.025, 0.36 and 0.57, respectively, compared with error mean squares of 0.0023, 0.024 and 0.035. The calculated F-values were 10.87, 15.00 and 16.29, respectively, indicating significant treatment effects.
Ascorbic acid and pectin
The results presented in Table 4 revealed that the application of plant growth regulators significantly affected the ascorbic acid and pectin content of guava fruits. NAA 100 ppm (T 2 ) recorded the highest ascorbic acid content (180.11 mg 100 g -1 pulp) and pectin content (1.61%). The corresponding values in the control were 170.01 mg 100 g -1 pulp and 0.79%, respectively. The S.Em. (±) values were 0.41 mg 100 g -1 pulp and 0.02%, while the corresponding CD values were 1.20 mg 100 g -1 pulp and 0.06%, respectively.
| Treatment | Ascorbic acid (mg 100 g−1 pulp) | Pectin (%) |
|---|---|---|
| T0 | 170.01 | 0.79 |
| T1 | 178.92 | 1.29 |
| T2 | 180.11 | 1.61 |
| T3 | 176.26 | 1.15 |
| T4 | 177.9 | 1.2 |
| T5 | 175.68 | 0.94 |
| T6 | 174.42 | 0.9 |
| T7 | 173.44 | 0.88 |
| T8 | 173.21 | 0.87 |
| T9 | 172.33 | 0.84 |
| T10 | 172.21 | 0.83 |
| S.Em. (±) | 0.41 | 0.02 |
| CD (P = 0.05) | 1.2 | 0.06 |
Table text extracted from the original PDF; superscript letters are shown inline. The original table image is below.
View original table image
Discussion
The present study showed that plant growth regulators modified both productivity and biochemical quality of guava cv. Allahabad Safeda, with the magnitude of response depending on the regulator treatment. NAA 100 ppm (T 2 ) produced the highest fruit number, fruit weight and yield, together with the lowest acidity, highest TSS ratio, ascorbic acid and pectin content. In contrast, GA 3 150 ppm (T 4 ) produced the highest TSS and sugar concentrations, indicating that the response of individual quality attributes was treatment-specific. The superior yield under NAA 100 ppm may be related to improved fruit retention and fruit development associated with auxin-mediated regulation of reproductive growth and assimilate partitioning. The increase in fruit number and fruit weight under T 2 consequently resulted in the highest fruit yield of 56.10 kg tree -1 . The comparatively lower yield observed with the higher growth regulator treatments suggests that the response was concentration dependent. Fruit quality parameters also exhibited distinct treatment responses. NAA 100 ppm resulted in the lowest acidity and the highest TSS ratio, indicating a more favourable balance between soluble solids and organic acids. The same treatment recorded the maximum ascorbic acid and pectin contents, suggesting that an appropriate concentration of NAA influenced not only fruit production but also selected biochemical attributes. GA 3 150 ppm, however, produced the maximum TSS, reducing sugar, non-reducing sugar and total sugar. This response indicates that GA 3 was particularly effective in modifying soluble-solids and sugar accumulation under the conditions of the experiment. The higher TSS under GA 3 150 ppm was not accompanied by the highest TSS ratio because acidity remained higher than under NAA 100 ppm. This distinction is important when interpreting fruit-quality responses. Overall, NAA 100 ppm showed the most consistent response across yield and several quality parameters, whereas GA 3 150 ppm showed a specific advantage for TSS and sugar accumulation. The differential responses among treatments may reflect differences in the physiological actions of the regulators and their concentration-dependent effects. However, the present experiment evaluates predefined regulator treatments rather than a factorial combination; therefore, the results should be interpreted as treatment responses rather than evidence of interaction or synergism among growth regulators.
Conclusion
Under the conditions of the present study, foliar application of plant growth regulators substantially influenced the yield and fruit quality of guava cv. Allahabad Safeda. NAA 100 ppm (T 2 ) produced the highest fruit number (251.17 tree -1 ), average fruit weight (223.37 g) and fruit yield (56.10 kg tree -1 ), along with the lowest acidity (0.25%), highest TSS ratio (46.48), ascorbic acid (180.11 mg 100 g -1 pulp) and pectin content (1.61%). GA 3 150 ppm (T 4 ) was superior for TSS (12.67 °Brix) and reducing, non-reducing and total sugars (5.82, 4.60 and 10.42%, respectively). These findings indicate that NAA 100 ppm provided the most consistent improvement in productivity and several quality attributes, while GA 3 150 ppm was particularly effective for soluble-solids and sugar accumulation. Further evaluation across seasons, locations and application schedules would be useful for confirming the consistency of these responses under different production conditions.
Acknowledgement
The authors gratefully acknowledge the facilities and technical support provided by the Faculty of Agriculture, Tantia University, Sri Ganganagar, Rajasthan, for experimenting.
References
6 in the original paper- Ranganna S. Manual of Analysis of Fruit and Vegetable Products. Tata McGraw-Hill Publishing Company, New Delhi; 1977.
- Panse VG, Sukhatme PV. Statistical Methods for Agricultural Workers. Indian Council of Agricultural Research, New Delhi; 1984.
- Jain MC, Dashora LK. Growth, flowering, fruiting and yield of guava (Psidium guajava L.) cv. Sardar as influenced by various plant growth regulators. International Journal of Agricultural Sciences. 2007;3(1):4-7.
- Katiyar PN, Singh JP, Singh PC. Effect of nutrients and plant growth regulators on physico-chemical parameters and yield of guava (Psidium guajava L.) fruit cv. Allahabad Safeda. International Journal of Agricultural Sciences. 2009;5(1):173174.
- Kumari M, Dashora LK, Jain M, Meena R, Tak Y. Effect of auxin and cytokinin on grafting and growth of sapling of guava (Psidium guajava L.). International Journal of Environment and Climate Change. 2023;13(11):702-706.
- Sharma S, Sharma R, Chandra N, Singh A, Tanvi, Singh J, Singh A. Impact of plant bioregulators on growth, yield, quality and economic feasibility of guava (Psidium guajava L.) in central region of Punjab, India. Journal of Experimental Agriculture International. 2024;46(11):700-708.