
Research article · 2026 · Full text
International Journal of Horticulture and Food ScienceGenetic variability, character association and path coefficient analysis in field pea (Pisum sativum L.)
Volume 8(9) · Pages 84–90 · DOI: 10.33545/26631067.2026.v8.i9b.859 ↗
Research areasGenetic and Environmental Crop StudiesGenetics and Plant BreedingAgricultural Practices and Plant Genetics
Abstract
Author-writtenThe present investigation evaluated genetic variability, character association and path coefficient relationships for grain yield and related traits in field pea (Pisum sativum L.). Eight named genotypes - IPFD 15-1, IPFD 19-3, IPFD 18-3, Pant P 455, Pant P 462, Pant P 480, Pant P 484 and Rachna - were assessed during Rabi 2025-26 at the Genetics and Plant Breeding Research Farm, Kamla Nehru Institute of Physical & Social Sciences, Sultanpur, Uttar Pradesh. Grain yield per plant showed the highest phenotypic and genotypic coefficients of variation (54.3 and 52.8%), followed by plant height (45.7 and 44.5%). Broad-sense heritability was high for all seven traits included in the complete numerical results, ranging from 84.2% for days to flowering to 94.8% for plant height. High heritability coupled with high genetic advance as percentage of mean was recorded for grain yield (103.4%), plant height (85.4%) and pods per plant (57.3%). Grain yield was positively associated with pods per plant (0.85), plant height (0.72), seeds per pod (0.65) and 100-seed weight (0.38), while days to flowering showed a negative association with grain yield (-0.62). The reported path analysis identified the largest positive direct effects for pods per plant (0.684), plant height (0.538), seeds per pod (0.307) and 100-seed weight (0.215). Pant P 484 recorded the highest grain yield (11.731 g plant-1) and maximum pods per plant (15.426), whereas IPFD 15-1 was the earliest flowering and earliest maturing entry. These results identify pod number, plant stature and seeds per pod as useful selection criteria for field pea improvement, subject to validation of the reported path components against the original statistical output.
Summary
Source-checkedPlain-language reading of the full paper, prepared with AI and checked against the text. Each point links to the authors' own words.
Why it matters
- Field pea is a significant cool-season grain legume used for both food and animal feed in diverse cropping systems. View evidence ↗
What they did
- The study evaluated eight specific field pea genotypes, including various IPFD and Pant series entries and Rachna. View evidence ↗
- The research was conducted during the Rabi 2025-26 season at the KNIPSS Research Farm in Sultanpur, Uttar Pradesh. View evidence ↗
- The experiment utilized a randomized block design with three replications. View evidence ↗
What they found
- Grain yield exhibited the highest phenotypic (54.3%) and genotypic (52.8%) coefficients of variation, followed by plant height and pods per plant. View evidence ↗
- Broad-sense heritability was high across all seven traits, with values between 84.2% (days to flowering) and 94.8% (plant height). View evidence ↗
- The highest genetic advance as a percentage of the mean was found for grain yield (103.4%), plant height (85.4%), and pods per plant (57.3%). View evidence ↗
- Grain yield was positively correlated with pods per plant (0.85), plant height (0.72), seeds per pod (0.65), and 100-seed weight (0.38). View evidence ↗
- Days to flowering showed a negative association with grain yield (-0.62), 100-seed weight (-0.42), and pods per plant (-0.35). View evidence ↗
- Path analysis identified pods per plant as having the largest positive direct effect on yield (0.684), followed by plant height (0.538), seeds per pod (0.307), and 100-seed weight (0.215). View evidence ↗
- Pant P 484 achieved the highest grain yield (11.731 g/plant) and most pods per plant (15.426), while IPFD 15-1 was the earliest to flower and mature. View evidence ↗
What it means
- The authors conclude that selecting for high pod number, appropriate plant height, and increased seeds per pod is the most effective way to increase grain yield in this material. View evidence ↗
- The study is limited by its use of a small sample of eight genotypes and its execution in a single location over one season. View evidence ↗
Visual summary
3 visualsIllustrations explain the paper; charts are replotted from the paper's own table values.
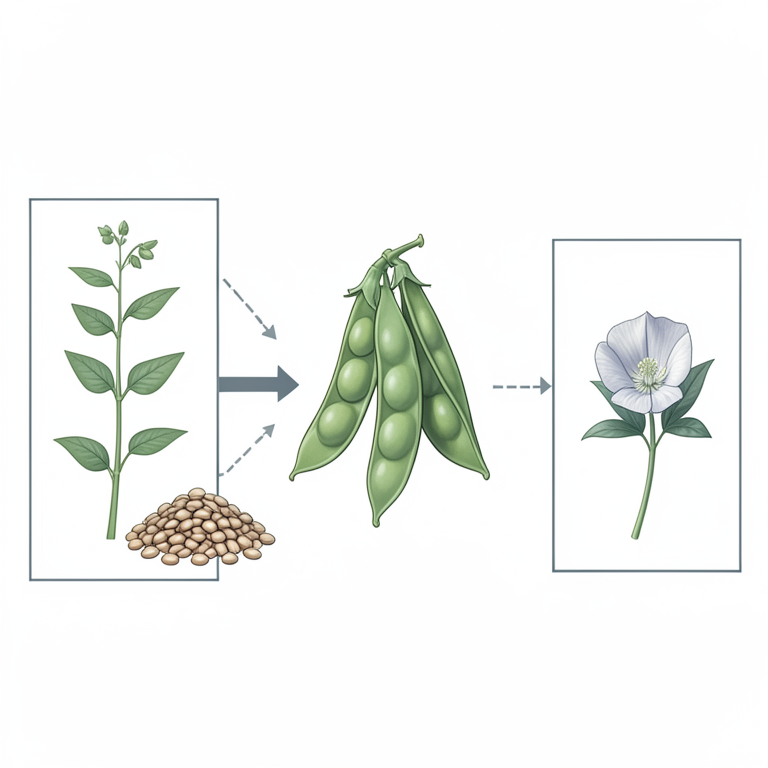
Yield Component Influence Map
AI-generated conceptual illustration (field pea plants (Pisum sativum L.)). It explains the idea and does not show study data.
View source evidence ↗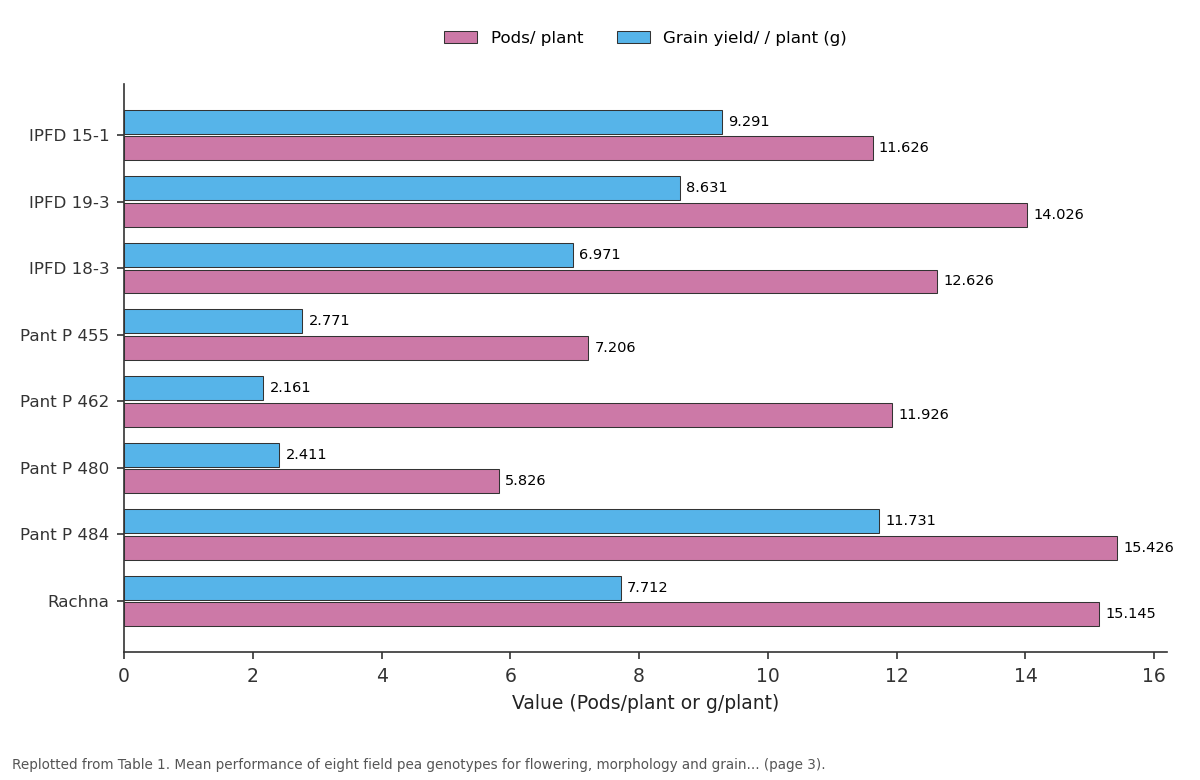
Pods/ plant and Grain yield/ / plant (g): IPFD 15-1 vs IPFD 19-3 vs IPFD 18-3 vs Pant P 455 vs Pant P 462
Replotted from Table 1 (page 3) of the original paper. Every bar is the paper's own table value.
View source evidence ↗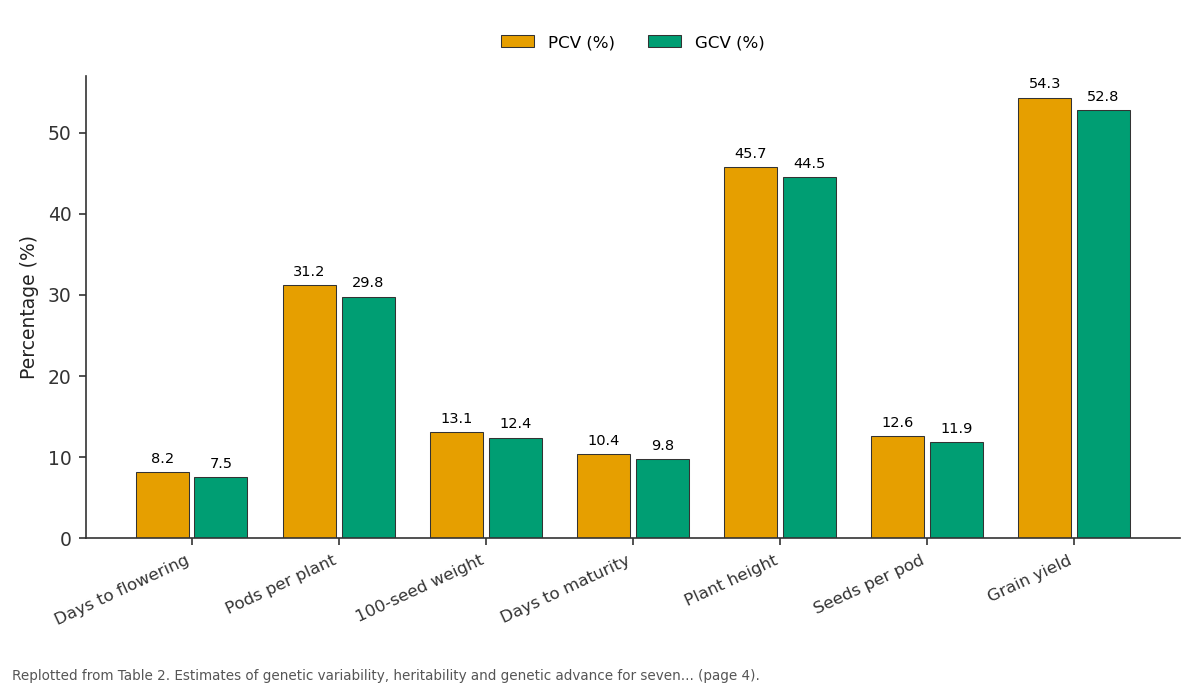
PCV (%) and GCV (%): Days to flowering vs Pods per plant vs 100-seed weight vs Days to maturity vs Plant height
Replotted from Table 2 (page 4) of the original paper. Every bar is the paper's own table value.
View source evidence ↗Figures & tables
From the original paper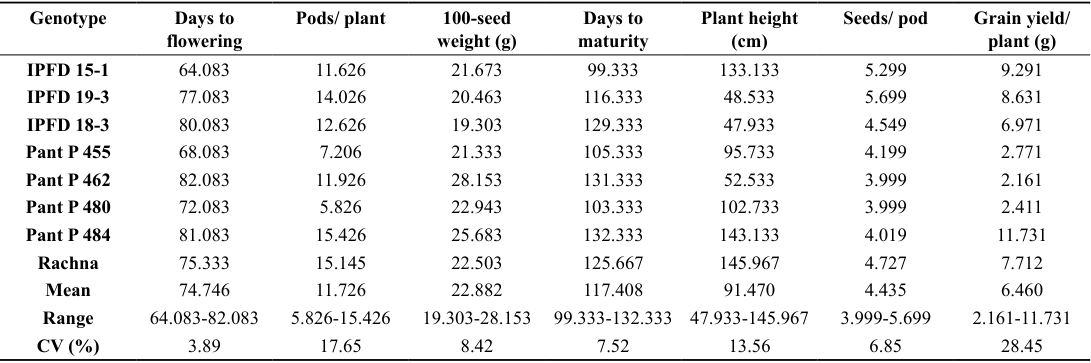 Table 1
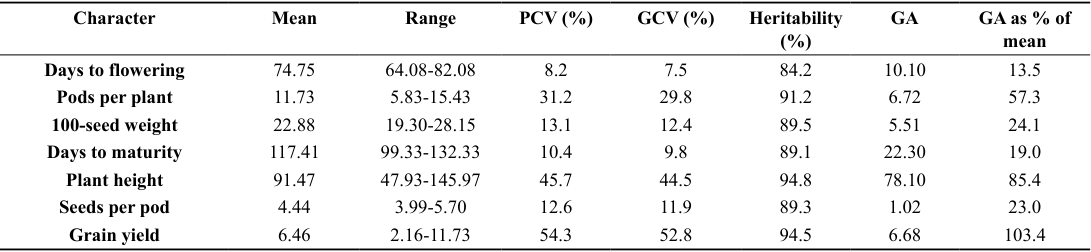 Table 2
 Table 3
 Table 4
Introduction
Field pea (Pisum sativum L.) is an important cool-season grain legume used for food and feed and valued within diversified cropping systems. Pea seed contains substantial protein together with starch, dietary fibre, minerals and nutritionally important amino acids, while pulse-based rotations can contribute to biological nitrogen inputs and improved resource use in cereal-dominated systems (Wu et al., 2023; Kumar et al., 2023) [2, 1] . The crop nevertheless remains sensitive to several production constraints, including drought and terminal heat during reproductive development, making genetic improvement for yield stability and adaptation an important breeding objective (Devi et al., 2023) [3] . The effectiveness of any crop improvement programme depends on the amount and nature of genetic variability available in the breeding material. Germplasm evaluation allows breeders to identify superior phenotypes, determine the relative importance of yield components and select parents with useful combinations of traits. Classical plant-breeding theory therefore places genetic variability at the centre of selection and recombination strategies (Allard, 1960) [4] . Because the phenotype reflects both genetic and environmental influences, coefficients of variation, heritability and genetic advance are commonly interpreted together rather than in isolation. Broad-sense heritability measures the proportion of phenotypic variance attributable to genetic variance, whereas genetic advance provides an indication of the expected gain under selection (Lush, 1949; Comstock et al., 1952) [6,5] . Grain yield is a complex quantitative trait produced through the combined expression of several developmental and yield-component characters. Simple comparison of mean yield is therefore insufficient for identifying the biological basis of superior performance. Character-association analysis provides information on the direction and strength of relationships among traits and can help identify component characters that may be used as indirect selection criteria (Johnson et al., 1955) [7] . In field pea, positive associations of yield with pods per plant, seeds per pod, seed weight and plant stature have been reported in diverse germplasm and breeding material, although the magnitude of these relationships varies across studies and environments (Jeberson et al., 2016; Khan et al., 2017; Singh et al., 2018) [8,9,10] . Correlation, however, does not distinguish a direct contribution to yield from an association mediated through other characters. Path coefficient analysis, developed from Wright's causal framework and widely used in crop breeding after the work of Dewey et al. (1959) [11] , partitions a correlation into direct and indi rect components. This helps breeders identify traits whose relationship with yield is likely to remain useful when correlated characters are considered simultaneously (Dewey et al., 1959) [11] . Recent pea studies continue to use variability, correlation and path analyses together to identify practical selection criteria for yield improvement (Kumar et al., 2021; Dhangrah et al., 2023) [13,12] . The present investigation was therefore undertaken to (i) assess the magnitude of variability among field pea genotypes for major phenological, morphological and yield traits, (ii) estimate heritability and genetic advance for the traits for which complete numerical estimates were available, and (iii) examine character associations and the reported direct and indirect effects of major yield components on grain yield per plant.
Materials and Methods
Materials and Methods
Experimental site and season
The experiment was conducted during Rabi 2025-26 at the Genetics and Plant Breeding Research Farm of Kamla Nehru Institute of Physical & Social Sciences, Sultanpur, Uttar Pradesh. The thesis describes the local climate as semi-arid, with hot summers and cool winters. The experimental soil was silty loam, low in organic carbon, nitrogen and phosphorus, rich in potash and alkaline in reaction, with a reported pH range of 8.5-8.7. The trial was conducted under irrigated normal-soil conditions. The crop season extended from October to April; the thesis records cool winter temperatures during vegetative and reproductive development and a progressive rise in temperature toward March and April. Recommended cultural practices were followed to raise a healthy crop.
Experimental material and design
Eight named field pea genotypes were included: IPFD 15-1, IPFD 19-3, IPFD 18-3, Pant P 455, Pant P 462, Pant P 480, Pant P 484 and Rachna. The material was obtained from the pulse collection of the Department of Genetics and Plant Breeding, KNIPSS, Sultanpur. The field layout was a randomized block design with three replications. Each entry was grown in a single row of 2.75 m length at 30 cm between rows and 10 cm between plants, over a reported experimental area of 72 m 2 . Four competitive plants from each plot were randomly selected for plant-based observations, whereas days to 50% flowering and days to maturity were recorded on a line basis. The thesis methods list ten characters, including primary branches, biological yield and harvest index. However, the complete variability, correlation and path-analysis tables reported in the Results chapter are available for seven characters: days to flowering, days to maturity, plant height, pods per plant, seeds per pod, 100-seed weight and grain yield per plant. The present article is therefore restricted to these seven traits and does not impute missing numerical results.
Statistical analysis
Mean values were used to compare genotype performance, and analysis of variance appropriate to the randomized block design was used in the thesis to assess differences among entries. Genetic variability was summarized through phenotypic and genotypic coefficients of variation, broad-sense heritability and genetic advance expressed both in absolute units and as percentage of the mean. Interpretation of heritability together with genetic advance followed the quantitative-genetic rationale that high values for both parameters are consistent with a comparatively strong transmissible component of variation (Lush, 1949; Comstock et al., 1952) [6,5] . Simple character associations were reported as genotypic correlation coefficients. Grain yield per plant was treated as the outcome trait for path analysis, and the reported direct and indirect effects were interpreted following the approach of Dewey et al. (1959) [11] . Because several indirect components in the thesis path table do not algebraically reconcile with the listed total correlations, the path coefficients are reproduced as reported and should be checked against the original statistical output before journal submission. The residual effect is therefore reported as a coefficient only, without converting it to a percentage of explained variation.
Results and Discussion
Results and Discussion
Mean performance and extent of phenotypic variation
Substantial differences were recorded among the eight genotypes for flowering, maturity, plant stature and yield components. Days to flowering ranged from 64.083 days in IPFD 15-1 to 82.083 days in Pant P 462, while days to maturity ranged from 99.333 days in IPFD 15-1 to 132.333 days in Pant P 484. The presence of both early and late types indicates useful phenological diversity. Earliness may be valuable where terminal heat shortens the reproductive period, although its advantage should be tested across environments because heat sensitivity and phenology can interact strongly in pea (Devi et al., 2023) [3] . Plant height varied widely, from 47.933 cm in IPFD 18-3 to 145.967 cm in Rachna. Pant P 484 was also tall (143.133 cm). Pods per plant ranged from 5.826 in Pant P 480 to 15.426 in Pant P 484, and seeds per pod ranged from 3.999 to 5.699. The highest 100-seed weight was recorded by Pant P 462 (28.153 g), followed by Pant P 484 (25.683 g). Grain yield per plant displayed the widest practical separation among entries, ranging from 2.161 g in Pant P 462 to 11.731 g in Pant P 484. IPFD 15-1 (9.291 g) and IPFD 19-3 (8.631 g) also performed comparatively well. This broad spread in component and yield traits is consistent with earlier reports of exploitable variability in pea germplasm (Lal et al., 2011; Pujari et al., 2021; Kumar et al., 2022) [15,14] .
Trait-wise interpretation of genotype performance
Phenological variation was sufficiently wide to distinguish early and late materials. IPFD 15-1 flowered at 64.083 days and matured at 99.333 days, making it the earliest entry for both traits. Pant P 462 was the latest to flower (82.083 days), while Pant P 484 required the longest period to maturity (132.333 days). Such differences are relevant in field pea because the duration of vegetative and reproductive phases determines whether a genotype can escape terminal heat or fit within intensive cropping sequences. In the present material, earliness also tended to be favourably associated with grain yield, as shown by the negative correlation between days to flowering and yield. Nevertheless, phenological response is strongly environment-dependent and should be verified across locations and sowing dates before it is used as a stand-alone selection criterion (Azam et al., 2020; Devi et al., 2023) [16,3] . Plant height showed one of the widest ranges in the experiment. Rachna (145.967 cm), Pant P 484 (143.133 cm) and IPFD 15-1 (133.133 cm) represented the taller group, whereas IPFD 18-3 (47.933 cm) and IPFD 19-3 (48.533 cm) were markedly shorter. Height had a strong positive correlation with grain yield (0.72) and a reported direct effect of 0.538, suggesting that, in this dataset, taller plants generally accumulated more yield. However, breeding for height requires balance because excessive stature can increase the risk of lodging in some production environments. Earlier field-pea studies have also reported positive yield associations with plant height, although the preferred plant type depends on management and target environment (Jeberson et al., 2016; Singh et al., 2018) [8,10] . Pods per plant emerged as the clearest yield component. Pant P 484 produced 15.426 pods per plant and Rachna 15.145, whereas Pant P 480 produced only 5.826. Pod number also exhibited the highest correlation with grain yield (0.85) among the component traits and the highest reported direct effect (0.684). The concurrence of high mean performance, high variability, high heritability and a strong association with yield makes this character especially useful for selection in the present population. Similar emphasis on pods per plant has been reported in pea by Khan et al. (2017) [9] , Gupta et al. (2020) [17] and Kumar et al. (2021) [13] . Seed number and seed size showed complementary rather than strongly antagonistic relationships in this group of genotypes. IPFD 19-3 recorded the highest seeds per pod (5.699), followed by IPFD 15-1 (5.299), while Pant P 462 had the highest 100-seed weight (28.153 g) and Pant P 484 the second highest (25.683 g). Seeds per pod was positively correlated with grain yield (0.65), and 100-seed weight showed a moderate positive correlation (0.38). The positive association between seeds per pod and 100-seed weight (0.32) indicates that, within these entries, improvement in seed number did not necessarily involve a reduction in seed size. Positive relationships of these characters with yield have also been observed in diverse pea materials (Bhuvaneswari et al., 2017; Tasnim et al., 2022) [18,19] . Grain yield itself ranged from 2.161 to 11.731 g plant-1, with Pant P 484 clearly superior in the reported environment. Its performance was associated with high pod number, tall stature and relatively heavy seed. IPFD 15-1 achieved the second-highest grain yield while combining earliness, tall plant stature and a comparatively high seed number per pod, whereas IPFD 19-3 combined a high pod number with the highest seeds per pod. These different trait combinations illustrate why yield improvement should be based on component characters rather than on yield alone, and they reinforce the value of simultaneous consideration of variability and association parameters (Lal et al., 2011; Pujari et al., 2021) [15] .
Genetic variability, heritability and genetic advance
For each of the seven traits, the phenotypic coefficient of variation (PCV) was slightly greater than the corresponding genotypic coefficient of variation (GCV), indicating some environmental contribution to phenotypic expression but also suggesting that much of the observed variation was genetically structured. Grain yield showed the highest PCV (54.3%) and GCV (52.8%), followed by plant height (45. [20,18,8] . Broad-sense heritability was high for all traits, ranging from 84.2% for days to flowering to 94.8% for plant height. Grain yield (94.5%), pods per plant (91.2%), 100-seed weight (89.5%), seeds per pod (89.3%) and days to maturity (89.1%) also showed high values. High heritability alone does not guarantee a large response to selection, because dominance, epistasis and environmental interaction may contribute to total genetic variance. The combined consideration of heritability and genetic advance is therefore more informative for breeding decisions (Lush, 1949; Comstock et al., 1952) [6,5] . The largest genetic advance as percentage of mean was reported for grain yield (103.4%), followed by plant height (85.4%) and pods per plant (57.3%). The thesis interprets these combinations of high heritability and high genetic advance as evidence of substantial additive genetic control and good prospects for straightforward phenotypic selection. Similar conclusions have been drawn in field pea populations where high heritability and genetic advance were observed for yield and major component traits (Lal et [15,12] .
Character association with grain yield
Grain yield per plant was positively associated with pods per plant (r = 0.85), plant height (r = 0.72), seeds per pod (r = 0.65) and 100-seed weight (r = 0.38). The strongest association was therefore between grain yield and pod number. [8,9,17,13] . Pods per plant also showed positive correlations with seeds per pod (0.48), plant height (0.31) and 100-seed weight (0.25). Plant height was positively associated with seeds per pod (0.41), while seeds per pod and 100-seed weight were positively associated (0.32). These positive relationships suggest that, within this group of genotypes, improvement of one component need not necessarily occur at the expense of another. Similar positive interrelationships among pod number, seed number and yield-related characters have been observed by Bhuvaneswari et al. (2017) [18] , Singh et al. (2018) [10] , Asha et al. (2020) [21] and Tasnim et al. (2022) [19] . Days to flowering was negatively associated with grain yield (-0.62), 100-seed weight (-0.42) and pods per plant (-0.35), but positively associated with plant height (0.28). Within this single environment, the pattern suggests that earlier flowering entries tended to express more favourable yield relationships. However, this result should not be generalized without multi-environment testing, because maturity duration, temperature and moisture availability can change the direction and magnitude of phenology-yield associations. Studies in pea have likewise reported environment-dependent relationships between flowering, maturity and yield components (Azam et al., 2020; Assen, 2020) [16,22] .
Path coefficient analysis
The reported path coefficient analysis was used to separate the association of selected yield components with grain yield into direct and indirect effects. Pods per plant had the largest positive direct effect (0.684), followed by plant height (0.538), seeds per pod (0.307) and 100-seed weight (0.215). The ranking of direct effects broadly agrees with the corresponding correlations with grain yield, particularly for pods per plant and plant height. This strengthens the practical importance of these traits as selection criteria within the present material.
Earlier pea studies have similarly identified pod number and related component characters as important direct contributors to yield (Lal et al., 2018; Kumar et al., 2019; Mohanty et al., 2020) [24,23] . The thesis further reports positive indirect contributions of pods per plant through seeds per pod (0.328) and plant height (0.212), and of plant height through pods per plant (0.167) and seeds per pod (0.221).
Seeds per pod also showed a positive indirect contribution through pods per plant (0.295). Such relationships are consistent with a yield system in which component traits act jointly rather than independently. Similar combined direct and indirect influences of pod number, seed number and plant stature have been discussed in pea by Khan et al. (2017) [9] , Bahadur et al. (2021) [25] and Kumar et al. (2021) [13] . A residual effect of 0.186 is reported in the thesis. The thesis text interprets this value as 81.4% of grain-yield variation being accounted for by the included characters; however, that percentage does not directly follow from the residual coefficient under the usual path-analysis formulation. In addition, some reported direct and indirect components do not sum exactly to the listed total correlations. These internal inconsistencies do not alter the descriptive ranking of the reported direct effects, but the complete path matrix should be recalculated or checked against the original statistical software output before submission to a journal.
Integration with earlier field pea studies
The variability pattern observed here is broadly consistent with the central message of earlier field pea studies: traits related to plant stature, pod production and final yield often retain sufficient genetic variation for effective selection. Jeberson et al. (2016) [8] reported appreciable variability and useful genetic advance for yield-related characters in field pea, while Pujari et al. (2021) also documented broad variation among diverse genotypes. Dhangrah et al. (2023) [12] found significant differences among garden pea genotypes and emphasized the value of combining variability estimates with association analysis. The present dataset follows the same general pattern, but the magnitude of the coefficients is specific to these eight entries. Grain yield and plant height clearly show the widest proportional variation, whereas days to flowering and days to maturity are comparatively less variable. For breeding, this suggests a differentiated strategy: direct selection can be more intense for highly variable yield components, while phenological traits may require selection across larger populations or environments to capture useful differences. The association results also align with much of the published pea literature. Positive relationships of yield with pod number, seed number and plant height have been reported by Khan et al. (2017) [9] , Singh et al. (2018) [10] , Gupta et al. (2020) [17] and Kumar et al. (2021) [13] . In the present experiment, pods per plant showed by far the strongest positive correlation with grain yield, making it the most obvious component trait for simultaneous selection. Seeds per pod and plant height were also strongly associated with yield, whereas 100-seed weight had a more moderate relationship. These differences are important because a breeding index that assigns equal importance to all yield components would not reflect the structure of the present data. A more efficient selection approach would give greater emphasis to pod number and seeds per pod while retaining acceptable seed size and plant stature. Correlation should nevertheless be treated as a screening tool rather than proof of causation, particularly in a single-environment trial. Path analysis is intended to address that limitation by separating direct effects from effects transmitted through other characters. Previous pea studies have repeatedly identified pods per plant and related reproductive characters as important direct contributors to yield (Lal et al., 2018; Kumar et al., 2019; Kumar et al., 2021) [13,23,24] . The direct-effect ranking reported in the present thesis -pods per plant, plant height, seeds per pod and 100-seed weight -is therefore biologically and empirically plausible. When a trait combines a strong positive correlation with a substantial positive direct effect, direct selection is usually more defensible than when the association is created mainly through indirect pathways. On that basis, pod number is the most promising criterion in the present material. However, because the reported component effects do not fully reconcile with the listed correlations, only the relative pattern should be used at this stage; the numerical path matrix requires re-analysis before it is presented as final evidence. The genotype means further show that favourable yield can arise from different trait combinations. Pant P 484 achieved the highest yield mainly in association with a high number of pods, tall plant stature and relatively heavy seed. IPFD 15-1 reached a high yield through a different profile that included very early flowering and maturity, tall stature and comparatively high seeds per pod. IPFD 19-3 combined high pod number with the highest seeds per pod but had much shorter plants. Such complementary phenotypes are valuable in breeding because they provide contrasting sources of useful alleles rather than a single ideal parent. Crossing high-yielding, high-pod material with early or seed-number-rich material could create segregating populations in which recombination generates new combinations of maturity, plant architecture and reproductive capacity. This interpretation is consistent with the broader breeding principle that parental choice should consider complementary attributes rather than yield alone (Allard, 1960) [4] . The practical value of these characters will ultimately depend on their stability under target environments. Terminal heat is especially important in pea because reproductive processes, pod set and seed filling are sensitive to elevated temperature (Devi et al., 2023) [3] . The early phenology of IPFD 15-1 may therefore be useful in environments where crop escape is advantageous, while the high pod-bearing ability of Pant P 484 may be valuable where a longer season allows full expression of reproductive potential. Plant height must likewise be interpreted in relation to management because taller plants can support greater biomass and yield but may also face lodging risk under favourable conditions. Multi-environment testing would allow breeders to determine whether the high heritability and strong correlations observed here persist across sowing dates, soil conditions and climatic regimes. Until such validation is available, the present study should be viewed as a targeted characterization of useful genetic variation and selection signals within the evaluated material.
Breeding implications of genotype performance
The combination of mean performance, variability parameters and character associations provides a practical basis for identifying useful parental material. Pant P 484 produced the highest grain yield per plant (11.731 g) and the highest pod number (15.426), while also having relatively high 100-seed weight (25.683 g). Its flowering and maturity were late relative to most other entries, so it is best viewed as a source of yield and pod-bearing ability rather than earliness. IPFD 15-1, in contrast, was the earliest flowering (64.083 days) and earliest maturing (99.333 days) entry, while maintaining a comparatively high grain yield of 9.291 g plant-1. IPFD 19-3 combined high seed number per pod (5.699) with 14.026 pods per plant and 8.631 g grain yield per plant. These contrasting profiles indicate scope for combining complementary attributes through selection and hybridization. Pant P 484 may be useful where pod number and grain yield are priorities, whereas IPFD 15-1 offers early phenology with favourable yield. IPFD 19-3 may contribute high seed number per pod. Selection strategies emphasizing pods per plant, moderate plant stature, seeds per pod and acceptable seed weight are supported by the association analysis and by earlier field-pea studies reporting these traits as important contributors to yield (Jeberson et al., 2016; Singh et al., 2018; Kumar et al., 2021) [8,10,13] . Multi-location and multi-season evaluation would be necessary to determine the stability of these relationships before recommending specific genotypes for broader cultivation or use as parents.
Limitations and validation needs
The experiment was conducted in a single season and at one location using a relatively small set of eight named genotypes. Consequently, the magnitude of variance components, broad-sense heritability and character associations should be interpreted for this experimental material and environment rather than as fixed properties of field pea gen erally. Replicated testing across locations and years would be required to determine genotype x environment interaction, stability of yield performance and the repeatability of the observed correlations. The present results are therefore most useful for identifying promising traits and entries for further evaluation rather than for making broad varietal recommendations. The thesis also contains internal reporting differences that should be resolved before external submission: the methods refer to ten characters and to additional checks, whereas the complete numerical variability, correlation and path tables are reported for seven traits and eight named entries. Most importantly, the reported path coefficients require verification because several component effects do not sum to the stated total correlations. Retaining the mean-performance, variability and correlation results while re-running the path analysis from the original dataset would substantially strengthen the manuscript and ensure that the causal interpretation is statistically defensible.
Conclusion
The study revealed substantial exploitable variation among the evaluated field pea genotypes. Grain yield, plant height and pods per plant showed particularly high variability, while high broad-sense heritability combined with high genetic advance indicated strong prospects for selection in these traits. Grain yield was most strongly associated with pods per plant, followed by plant height and seeds per pod. The reported path coefficients likewise placed pods per plant and plant height among the most important direct contributors to yield. Pant P 484 was the highest-yielding and highest pod-bearing genotype, whereas IPFD 15-1 combined earliness with comparatively high grain yield. IPFD 19-3 also expressed favourable pod and seed-number attributes. These entries provide complementary material for future field pea improvement. For a final journal submission, the raw statistical output should be used to verify the path-analysis matrix and resolve the internal inconsistencies noted in the thesis reporting. Subject to that verification, selection for high pod number, suitable plant height and improved seeds per pod appears to offer the clearest route for increasing grain yield in this material.
Figures and tables from the paper
| Genotype | Days to | Pods/ plant | 100-seed | Days to | Plant height | Seeds/ pod | Grain yield/ |
|---|---|---|---|---|---|---|---|
| flowering | weight (g) | maturity | (cm) | plant (g) | |||
| IPFD 15-1 | 64.083 | 11.626 | 21.673 | 99.333 | 133.133 | 5.299 | 9.291 |
| IPFD 19-3 | 77.083 | 14.026 | 20.463 | 116.333 | 48.533 | 5.699 | 8.631 |
| IPFD 18-3 | 80.083 | 12.626 | 19.303 | 129.333 | 47.933 | 4.549 | 6.971 |
| Pant P 455 | 68.083 | 7.206 | 21.333 | 105.333 | 95.733 | 4.199 | 2.771 |
| Pant P 462 | 82.083 | 11.926 | 28.153 | 131.333 | 52.533 | 3.999 | 2.161 |
| Pant P 480 | 72.083 | 5.826 | 22.943 | 103.333 | 102.733 | 3.999 | 2.411 |
| Pant P 484 | 81.083 | 15.426 | 25.683 | 132.333 | 143.133 | 4.019 | 11.731 |
| Rachna | 75.333 | 15.145 | 22.503 | 125.667 | 145.967 | 4.727 | 7.712 |
| Mean | 74.746 | 11.726 | 22.882 | 117.408 | 91.470 | 4.435 | 6.460 |
| Range | 64.083-82.083 | 5.826-15.426 | 19.303-28.153 | 99.333-132.333 | 47.933-145.967 | 3.999-5.699 | 2.161-11.731 |
| CV (%) | 3.89 | 17.65 | 8.42 | 7.52 | 13.56 | 6.85 | 28.45 |
Table text extracted from the original PDF; superscript letters are shown inline. The original table image is below.
View original table image
| Character | Mean | Range | PCV (%) | GCV (%) | Heritability | GA | GA as % of |
|---|---|---|---|---|---|---|---|
| (%) | mean | ||||||
| Days to flowering | 74.75 | 64.08-82.08 | 8.2 | 7.5 | 84.2 | 10.10 | 13.5 |
| Pods per plant | 11.73 | 5.83-15.43 | 31.2 | 29.8 | 91.2 | 6.72 | 57.3 |
| 100-seed weight | 22.88 | 19.30-28.15 | 13.1 | 12.4 | 89.5 | 5.51 | 24.1 |
| Days to maturity | 117.41 | 99.33-132.33 | 10.4 | 9.8 | 89.1 | 22.30 | 19.0 |
| Plant height | 91.47 | 47.93-145.97 | 45.7 | 44.5 | 94.8 | 78.10 | 85.4 |
| Seeds per pod | 4.44 | 3.99-5.70 | 12.6 | 11.9 | 89.3 | 1.02 | 23.0 |
| Grain yield | 6.46 | 2.16-11.73 | 54.3 | 52.8 | 94.5 | 6.68 | 103.4 |
Table text extracted from the original PDF; superscript letters are shown inline. The original table image is below.
View original table image
| Trait | Days flowering | Pods/ plant | 100-seed weight | Plant height | Seeds/ pod | Grain yield |
|---|---|---|---|---|---|---|
| Days flowering | 1.00 | -0.35 | -0.42 | 0.28 | 0.15 | -0.62 |
| Pods/plant | 1.00 | 0.25 | 0.31 | 0.48 | 0.85 | |
| 100-seed weight | 1.00 | -0.18 | 0.32 | 0.38 | ||
| Plant height | 1.00 | 0.41 | 0.72 | |||
| Seeds/pod | 1.00 | 0.65 | ||||
| Grain yield | 1.00 |
Table text extracted from the original PDF; superscript letters are shown inline. The original table image is below.
View original table image
| Character | Direct effect | Indirect via | Indirect via 100- | Indirect via plant | Indirect via | Total correlation |
|---|---|---|---|---|---|---|
| pods/plant | seed wt | height | seeds/pod | |||
| Pods/plant | 0.684 | - | 0.171 | 0.212 | 0.328 | 0.85 |
| 100-seed weight | 0.215 | 0.138 | - | -0.039 | 0.085 | 0.38 |
| Plant height | 0.538 | 0.167 | -0.097 | - | 0.221 | 0.72 |
| Seeds/pod | 0.307 | 0.295 | 0.102 | 0.126 | - | 0.65 |
| Residual effect | 0.186 |
Table text extracted from the original PDF; superscript letters are shown inline. The original table image is below.
View original table image
References
26 in the original paper- Kumar S, Gopinath KA, Sheoran S, Meena RS, Srinivasarao C, Bedwal S, Jangir CK, Mrunalini K, Jat R, Praharaj CS. Pulsebased cropping systems for soil health restoration, resources conservation, and nutritional and environmental security in rainfed agroecosystems. Frontiers in Microbiology. 2023;13:1041124.
- Wu DT, Li WX, Wan JJ, Hu YC, Gan RY, Zou L. A comprehensive review of pea (Pisum sativum L.): Chemical composition, processing, health benefits, and food applications. Foods. 2023;12(13):2527.
- Devi J, Sagar V, Mishra GP, Jha PK, Gupta N, Dubey RK, Singh PM, Behera TK, Prasad PVV. Heat stress tolerance in peas (Pisum sativum L.): Current status and way forward. Frontiers in Plant Science. 2023;13:1108276.
- Comstock RE, Robinson HF. Genetic parameters, their estimation and significance. Proceedings of the Sixth International Grassland Congress. 1952;9:284-291.
- Lush JL. Heritability of quantitative traits in farm animals. Proceedings of the 8th International Congress of Genetics, Hereditas (Supplement). 1949:336-357.
- Johnson HW, Robinson HF, Comstock RE. Genotypic and phenotypic correlations in soybeans and their implication in selection. Agronomy Journal. 1955;47(10):477-483.
- Jeberson MS, Shashidhar KS, Iyanar K. Estimation of genetic variability, expected genetic advance, correlation and path analysis in field pea (Pisum sativum L.). Electronic Journal of Plant Breeding. 2016;7(4):1074-1078.
- Khan MRA, Mahmud F, Reza MA, Mahbub MM, Shirazy BJ, Rahman MM. Genetic diversity, correlation and path analysis for yield and yield components of pea (Pisum sativum L.). World Journal of Agricultural Sciences. 2017;13(1):11-16.
- Singh SK, Singh VP, Srivastava S, Singh AK, Chaubey BK, Srivastava RK. Estimation of correlation coefficient among yield and attributing traits of field pea (Pisum sativum L.). Legume Research. 2018;41(1):20-26.
- Dewey DR, Lu KH. A correlation and path-coefficient analysis of components of crested wheatgrass seed production. Agronomy Journal. 1959;51(9):515-518.
- Dhangrah VK, Singh YP, Kaur N. Studies on genetic variability and character association for quantitative traits of garden pea (Pisum sativum L.). International Journal of Bio-resource and Stress Management. 2023;14(5):667-676.
- Kumar MS, Singh NB, Jeberson MS, Ramaiah KS, Singh LN, Singh NG. Correlation and path coefficient analysis for yield and its contributing characters in advanced breeding lines of field pea (Pisum sativum L.). Journal of Food Legumes. 2021;34(3):199204.
- Kumar S, Ali B, Ahmed W, Islam R, Rahman MM, Chakma M, Miah MS. Assessment of the genetic variability for various agronomic traits of pea (Pisum sativum L.) genotypes. Plant Archives. 2022;22(1):87-94.
- Lal GM, Meena ML, Kunj C, Singh CM. Assessment of genetic variability and interrelation between yield and its contributing components in field pea (Pisum sativum L.). Environment and Ecology. 2011;29(3):1235-1239.
- Azam MG, Iqbal MS, Hossain MA, Hossain J, Hossain MF. Evaluation of field pea (Pisum sativum L.) genotypes based on genetic variation and association among yield and yield-related traits under high Ganges River Floodplain. International Journal of Plant Biology Research. 2020;8(2):1120.
- Gupta A, Singh B, Prakash S, Rout S, Singh J. Correlation coefficient and path analysis in table pea (Pisum sativum var. hortense L.). Current Journal of Applied Science and Technology. 2020;39(31):56-60.
- Bhuvaneswari S, Sharma SK, Punitha P, Shashidhar KS, Naveenkumar KL, Prakash N. Evaluation of morphological diversity of field pea [Pisum sativum subsp. arvense (L.)] germplasm under sub-tropical climate of Manipur. Legume Research. 2017;40(2):215-223.
- Tasnim S, Ivy NA, Raihan MS, Akter N, Islam MZ, Jahan N, Khan AU. Evaluation of genetic variation in segregating population of pea (Pisum sativum L.). SAARC Journal of Agriculture. 2022;20(1):29-39.
- Bhardwaj A, Sharma A, Lata H. Genetic variability for pod yield and related traits in garden pea (Pisum sativum L.). Electronic Journal of Plant Breeding. 2020;11(4):1233-1238.
- Asha AB, Srinivasa V, Hanumantappa M, Aghora TS, Ganapathi M, Chithra K. Correlation and path analysis in garden pea (Pisum sativum L.). Journal of Pharmacognosy and Phytochemistry. 2020;9(5):1728-1731.
- Assen KY. Trait associations in prostrate and semi-leafless type field pea (Pisum sativum L.) gene pools. American Journal of Environmental Science and Engineering. 2020;4(4):54-60.
- Kumar TV, Alloli TB, Hadimani HP, Ajjappalavar PS, Satish D, Abdul K, Hanchinamani CN. Studies on correlation and path coefficient analysis in garden pea (Pisum sativum L.) varieties. International Journal of Current Microbiology and Applied Sciences. 2019;8:3024-3031.
- Lal K, Kumar R, Shrivastav SP, Kumar A, Singh Y. Genetic variability, character association and path analysis of seed yield and its contributing traits in field pea (Pisum sativum L. var. arvense). International Journal of Current Microbiology and Applied Sciences. 2018;7(6):1815-1820.
- International Journal of Horticulture and Food Science https://www.hortijournal.com 26631075, 2026, 8(9), Downloaded from https://www.doi.org/10.33545/26631067.2026.v8.i9b.859 by International Journal of Horticulture and Food Science on [25/09/2026]. See the Terms and Conditions (https://www.hortijournal.com) for rules of use; OA articles are governed by the applicable Creative Commons License
- Bahadur L, Devi B. Estimation of correlation and path analysis coefficient among yield and yield attribution traits of field pea (Pisum sativum L.). Journal of Pharmacognosy and Phytochemistry. 2021;10(1):1696-1699.
- How to cite this article: Singh A, Tripathi SN. Genetic variability, character association and path coefficient analysis in field pea (Pisum sativum L.). International Journal of Horticulture and Food Science. 2026;8(9):84-90. doi: https://www.doi.org/10. 33545/26631067.2026.v8.i9b.859