
Research article · 2026 · Full text
International Journal of Horticulture and Food SciencePhysicochemical changes and overall acceptability of guava-based fruit bar during ambient storage
Volume 8(9) · Pages 78–83 · DOI: 10.33545/26631067.2026.v8.i9b.857 ↗
Research areasFood Drying and ModelingPostharvest Quality and Shelf Life ManagementFood and Agricultural Sciences
Abstract
Author-writtenphysicochemical changes and overall acceptability of guava-based fruit bar during 90 days of ambient storage. Eight pulp blends of guava, sapota and papaya were dried, packed in plastic boxes and stored at 20–35 °C. Observations were recorded at 0, 30, 60 and 90 days. pH declined in all treatments (T8: 4.01 to 3.87; T1: 3.44 to 3.26), while titratable acidity increased (T1: 1.42 to 1.50%; T8: 0.93 to 1.05%). TSS and reducing sugars increased, whereas non-reducing and total sugars decreased, indicating inversion of sucrose. Overall acceptability declined only slightly. Treatment T8 (Guava:Sapota:Papaya, 40:30:30) retained the highest overall acceptability (8.95 at 0 days to 8.73 at 90 days) together with the most favourable chemical values. The 40:30:30 blend is recommended as a chemically stable and acceptable fruit bar for 90 days of ambient storage.
Summary
Source-checkedPlain-language reading of the full paper, prepared with AI and checked against the text. Each point links to the authors' own words.
Why it matters
- The quality of fruit bars during storage is affected by moisture migration, the formation of organic acids, and the inversion of sucrose, which alter pH, total soluble solids (TSS), and sugar levels. View evidence ↗
The question
- The study aimed to measure how pH, TSS, acidity, various sugar types, and overall acceptability of guava-based fruit bars change over 90 days of storage at ambient temperature. View evidence ↗
What they did
- The researchers used a Completely Randomized Design with three replications and eight different pulp ratios of guava, sapota, and papaya (T1 to T8). View evidence ↗
- Fruit bars were made by mixing 1 kg of pulp with 200 g sugar and 1 g citric acid, concentrating to 75 °Brix, drying at 50 °C for approximately 20 hours, and storing 2.5 x 5 cm pieces in plastic boxes at 20–35 °C. View evidence ↗
- A trained five-member panel evaluated the overall acceptability of the bars using a 9-point hedonic scale at four time intervals: 0, 30, 60, and 90 days. View evidence ↗
What they found
- Total soluble solids (TSS) rose continuously during storage, with T8 reaching the maximum of 75.25 °Brix and T1 the minimum of 73.30 °Brix by day 90. View evidence ↗
- Titratable acidity increased across all blends during storage, ranging from 1.42% to 1.50% in T1 (highest) and 0.93% to 1.05% in T8 (lowest). View evidence ↗
- Reducing sugars increased in all treatments, with T8 rising from 8.39% to 8.90% and T1 from 7.42% to 8.10% over the storage period. View evidence ↗
- Total sugar content showed a modest decline, though T8 retained the highest levels, moving from 67.38% to 66.54%. View evidence ↗
- Overall acceptability decreased slightly but stayed within the acceptable range, with T8 scoring the highest throughout (starting at 8.95 and ending at 8.73). View evidence ↗
Visual summary
3 visualsIllustrations explain the paper; charts are replotted from the paper's own table values.
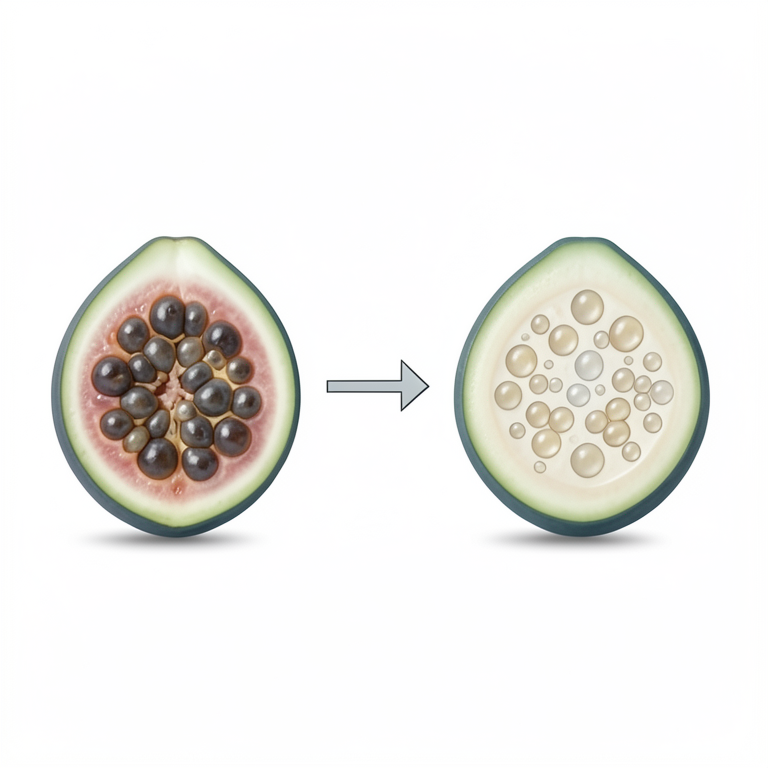
Sugar Inversion Process
AI-generated conceptual illustration (guava-based fruit bars). It explains the idea and does not show study data.
View source evidence ↗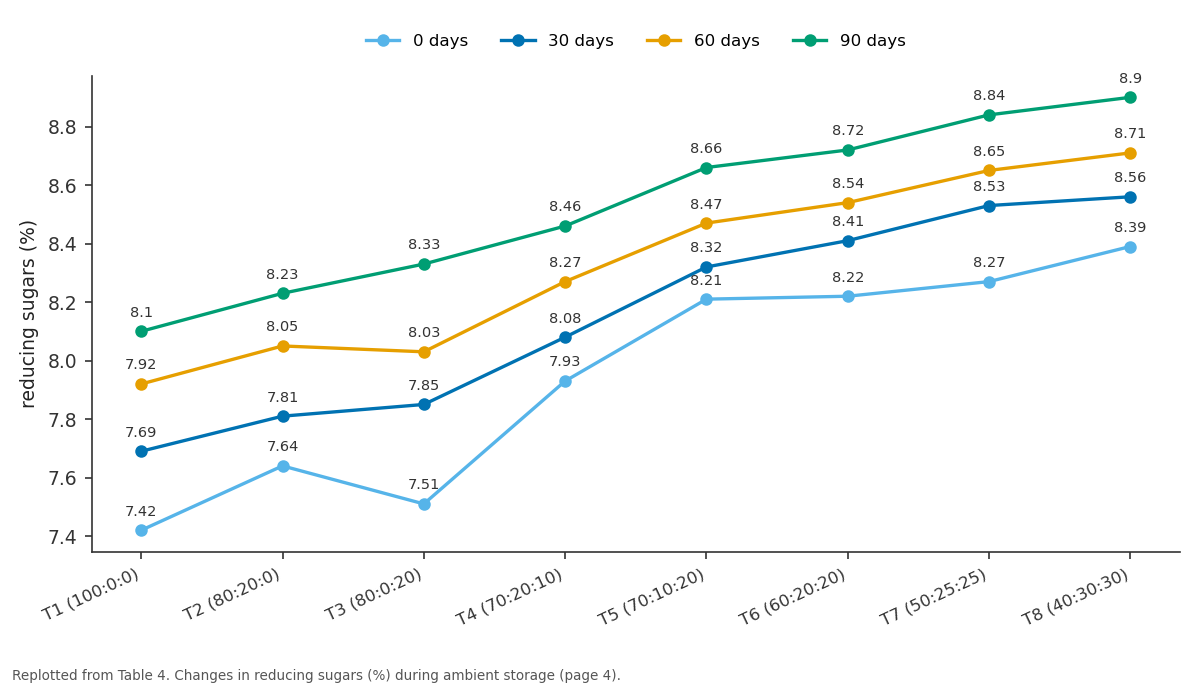
0 days and 30 days and more: T1 (100:0:0) vs T2 (80:20:0) vs T3 (80:0:20) vs T4 (70:20:10) vs T5 (70:10:20)
Replotted from Table 4 (page 4) of the original paper. Every bar is the paper's own table value.
View source evidence ↗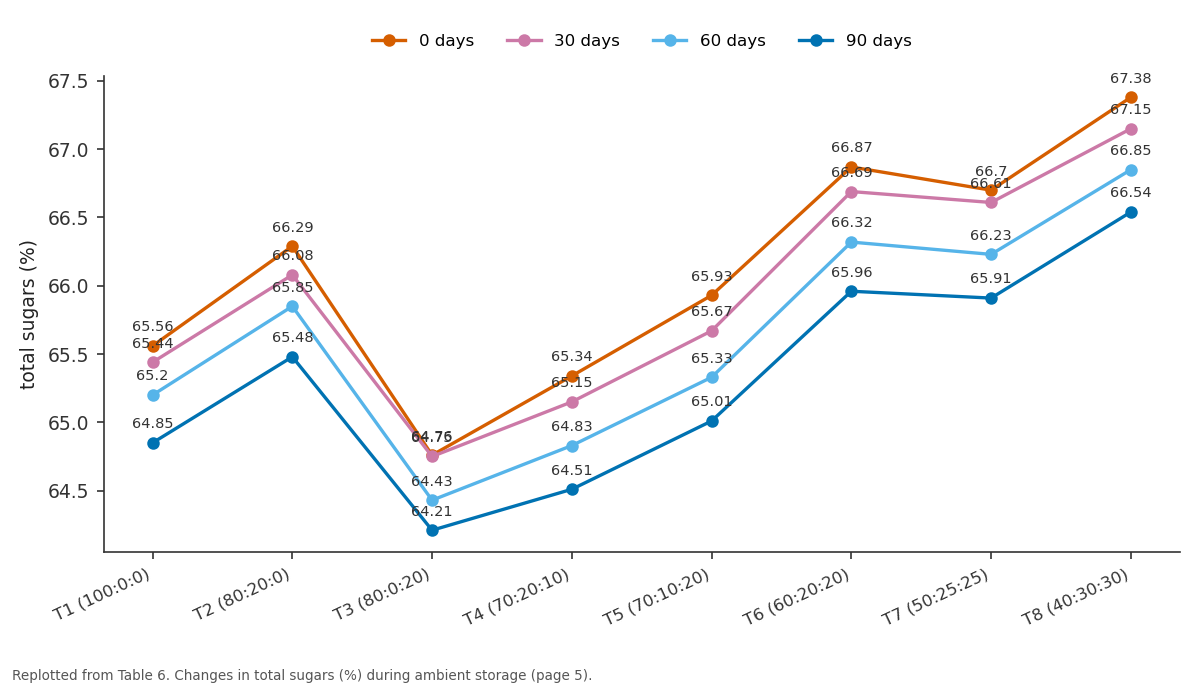
0 days and 30 days and more: T1 (100:0:0) vs T2 (80:20:0) vs T3 (80:0:20) vs T4 (70:20:10) vs T5 (70:10:20)
Replotted from Table 6 (page 5) of the original paper. Every bar is the paper's own table value.
View source evidence ↗Figures & tables
From the original paper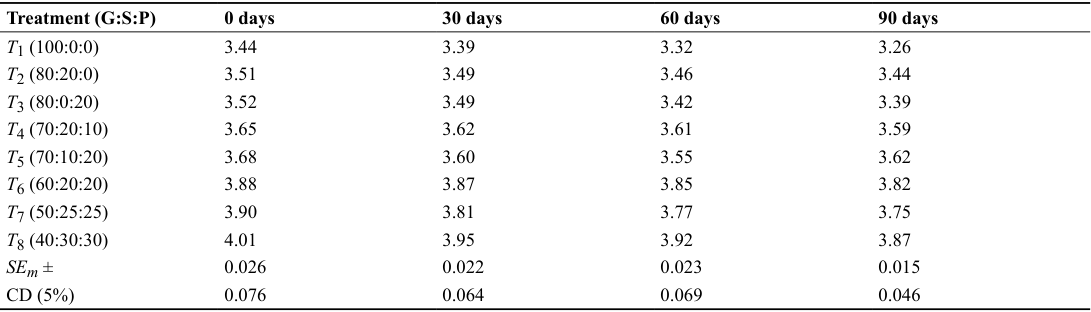 Table 1
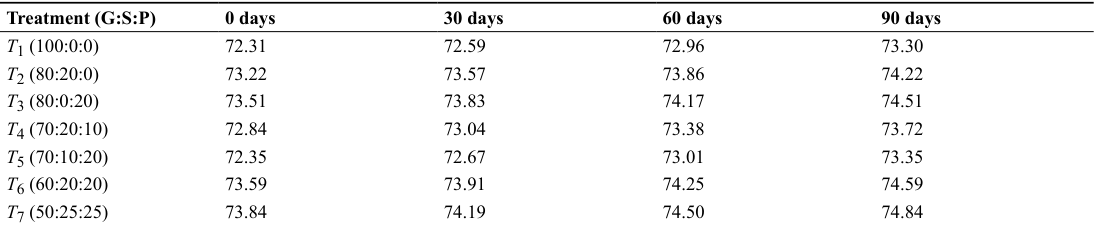 Table 2
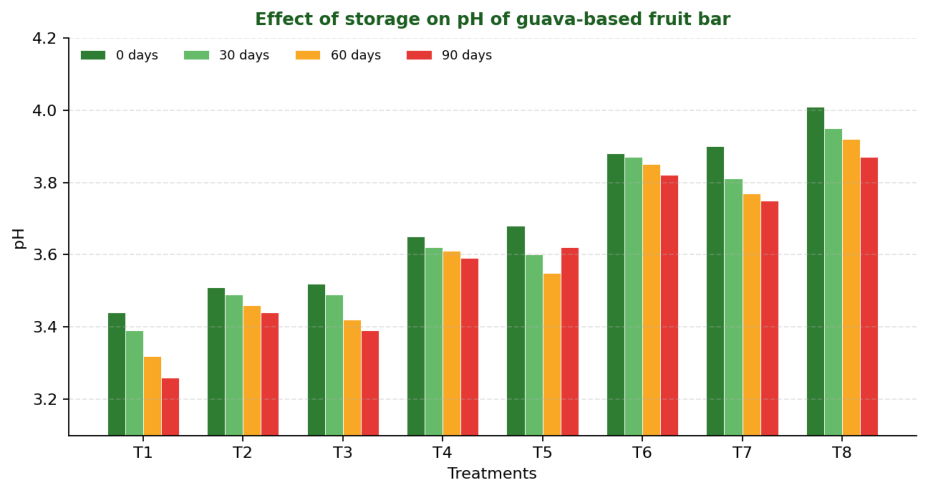 Figure 1
 Table 2
 Table 3
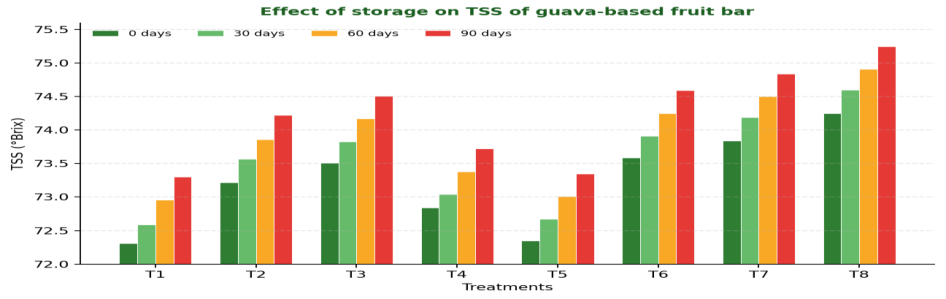 Figure 2
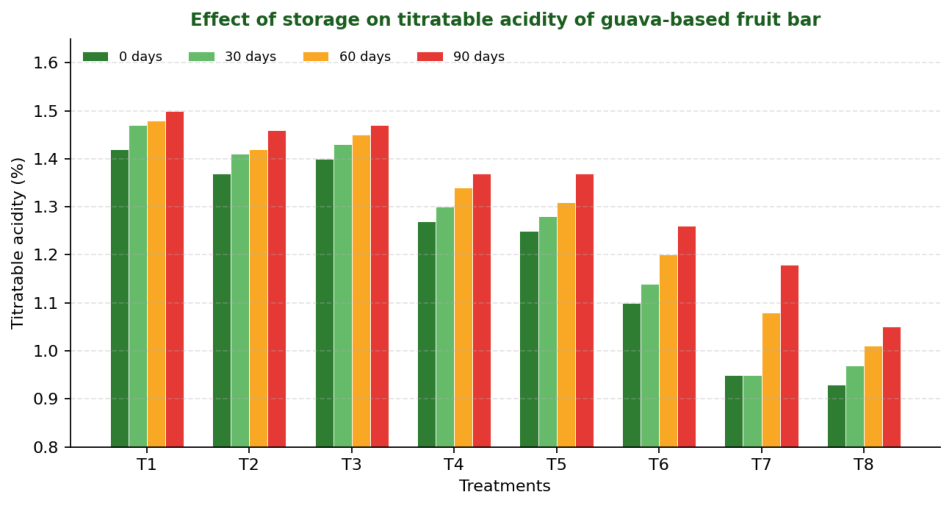 Figure 3
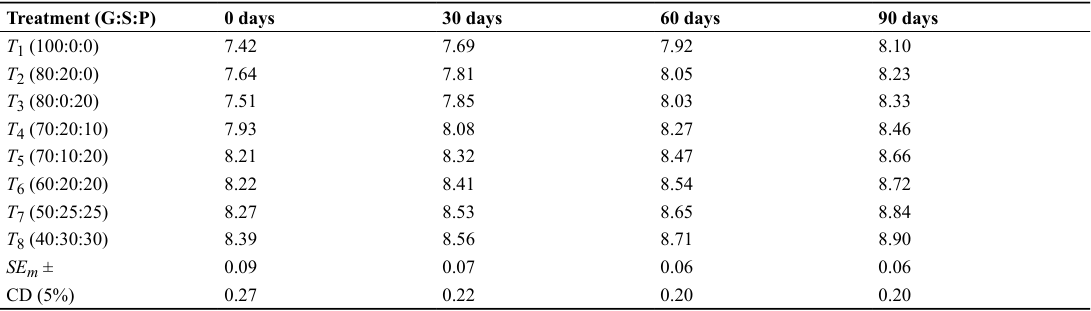 Table 4
 Table 3
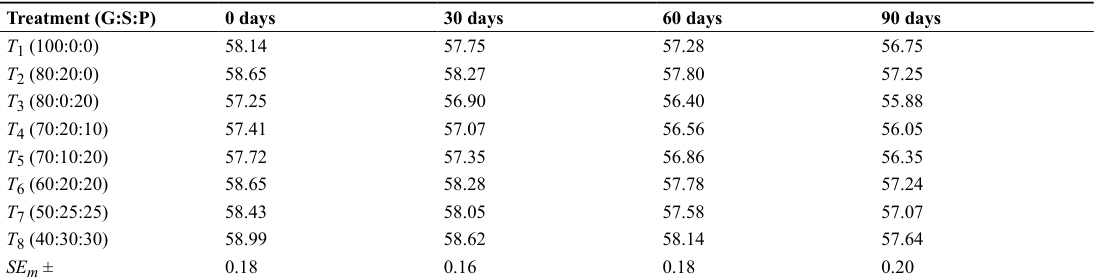 Table 5
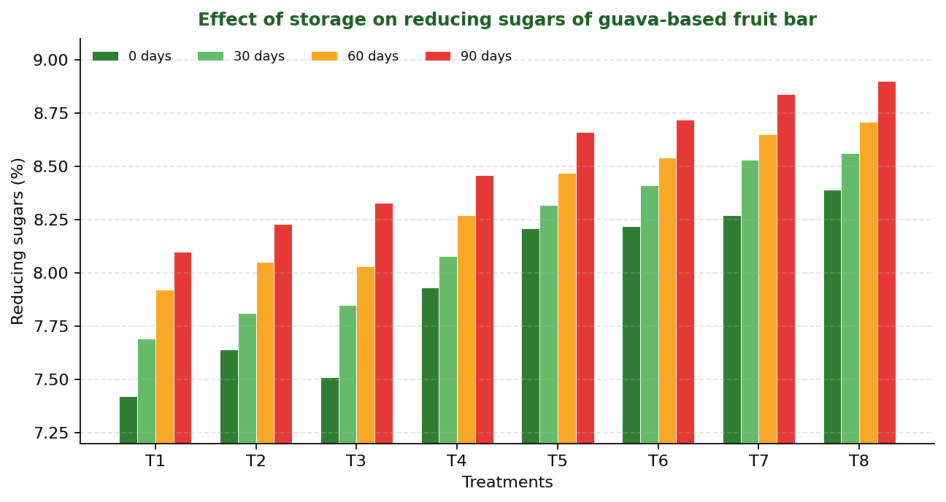 Figure 4
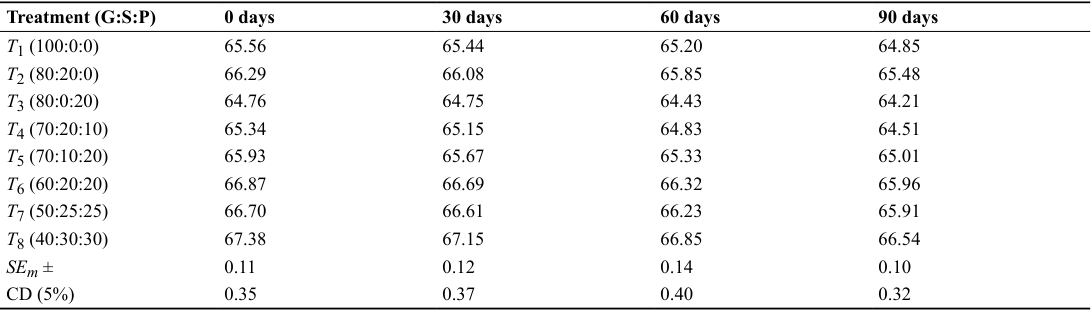 Table 6
 Table 5
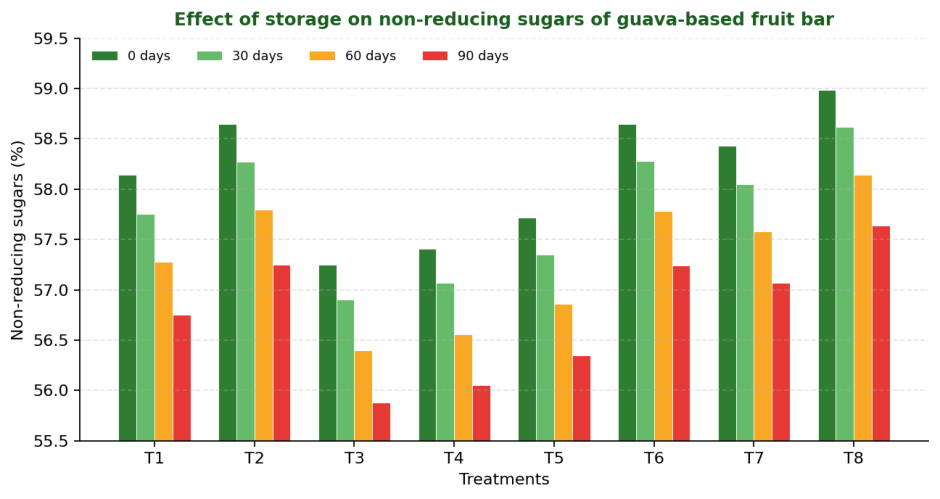 Figure 5
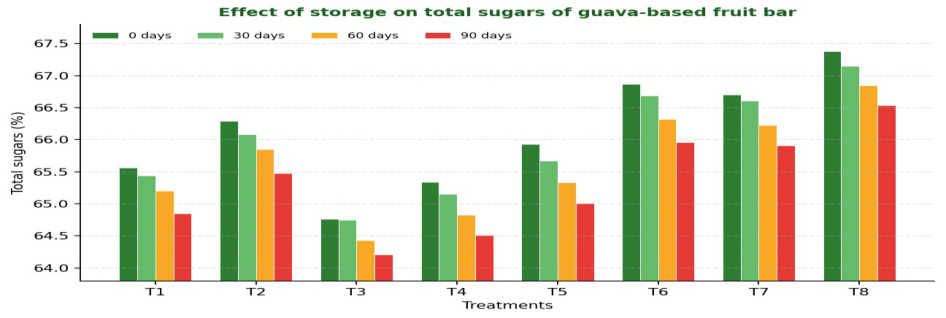 Figure 6
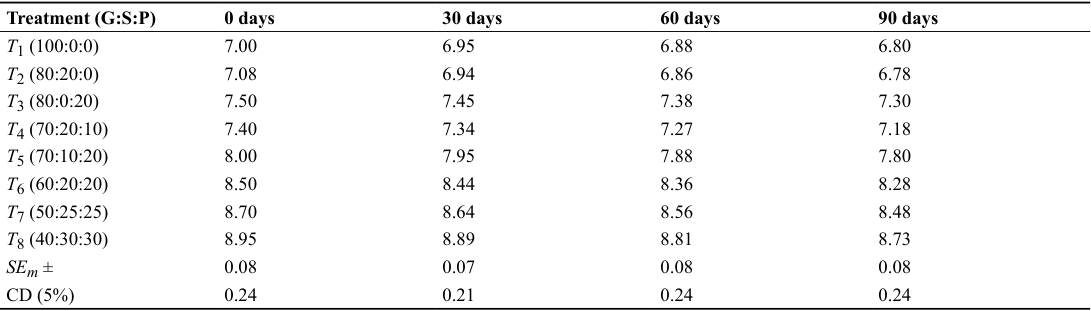 Table 7
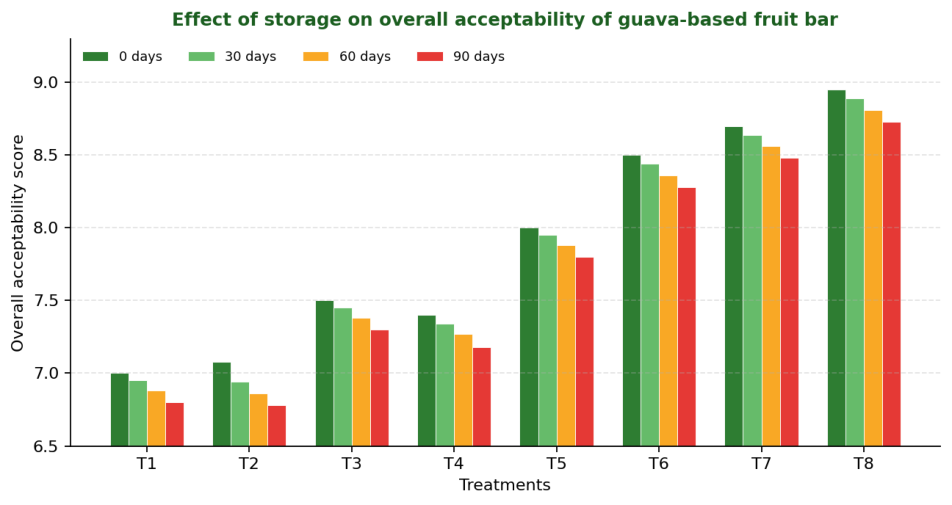 Figure 7
Introduction
Guava (Psidium guajava L.), sapota (Manilkara zapota L.) and papaya (Carica papaya L.) are highly perishable climacteric fruits. Post-harvest losses of 13-26% are common. Conversion of surplus pulp into a dehydrated fruit bar extends availability beyond the glut season. During storage, moisture migration, inversion of sucrose and formation of organic acids change pH, TSS, acidity and sugar fractions (Ranganna, 1997; Sreemathi et al., 2008) [1,2] . Overall acceptability on a 9-point hedonic scale is the single sensory index used here to confirm that chemical change does not make the product unacceptable. Binary-blend bars of guava-papaya and sapota-papaya have shown a rise in TSS and reducing sugars and a fall in pH and acceptability with storage (Avhad et al., 2019; Verma et al., 2020) [3,4] . Storage behaviour of a ternary guava-sapota-papaya bar under Durg conditions is less documented. The objective of this paper is to quantify changes in pH, TSS, titratable acidity, reducing sugar, non-reducing sugar, total sugar and overall acceptability of guava-based fruit bar during 90 days of ambient storage.
Material and methods
Material and methods
Location, design and treatments
The experiment was conducted during 2025-26 at the Fruit Science Laboratory, College of Horticulture and Research Station, Sankara-Patan, Durg (20°54′ N; 81°10′-81°36′ E). A Completely Randomized Design with eight treatments and three replications was used. Pulp ratios of guava : sapota : papaya were T 1 100:0:0, T 2 80:20:0, T 3 80:0:20, T 4 70:20:10, T 5 70:10:20, T 6 60:20:20, T 7 50:25:25 and T 8 40:30:30.
Preparation and storage
One kilogram of blended pulp was mixed with 200 g sugar and 1 g citric acid and concentrated to 75 °Brix. The slurry was spread in 1 cm layers on glycerine-smeared trays and dried at 50 °C (about 20 h). Dried sheets were cut into 2.5 × 5 cm pieces, packed in food-grade plastic boxes and stored at 20-35 °C. No chemical preservative was added.
Observations
pH was measured with a digital pH meter and TSS (°Brix) with a hand refractometer. Titratable acidity (as citric acid) and sugars were estimated by the methods of Ranganna (1997) [1] . Overall acceptability was scored by a five-member trained panel on a 9-point hedonic scale at 0, 30, 60 and 90 days.
Statistical analysis
Data were analysed by ANOVA for CRD. Means were compared by critical difference at 5% (Panse et al., 1985) [5] .
Result and discussion
1. pH pH declined during storage in seven of the eight treatments (Table 1; Fig. 1). The highest pH throughout storage was recorded in T 8 (4.01 at 0 days to 3.87 at 90 days) and the lowest in T 1 (3.44 to 3.26).
| Treatment (G:S:P) | 0 days | 30 days | 60 days | 90 days |
|---|---|---|---|---|
| T1 (100:0:0) | 3.44 | 3.39 | 3.32 | 3.26 |
| T2 (80:20:0) | 3.51 | 3.49 | 3.46 | 3.44 |
| T3 (80:0:20) | 3.52 | 3.49 | 3.42 | 3.39 |
| T4 (70:20:10) | 3.65 | 3.62 | 3.61 | 3.59 |
| T5 (70:10:20) | 3.68 | 3.60 | 3.55 | 3.62 |
| T6 (60:20:20) | 3.88 | 3.87 | 3.85 | 3.82 |
| T7 (50:25:25) | 3.90 | 3.81 | 3.77 | 3.75 |
| T8 (40:30:30) | 4.01 | 3.95 | 3.92 | 3.87 |
| SEm ± | 0.026 | 0.022 | 0.023 | 0.015 |
| CD (5%) | 0.076 | 0.064 | 0.069 | 0.046 |
Table text extracted from the original PDF; superscript letters are shown inline. The original table image is below.
View original table image
Treatment T 5 showed a slight rise at 90 days (3.55 to 3.62), which remained within the CD and did not change the overall ranking. The general decline is due to accumulation of organic acids and slow breakdown of ascorbic acid. Treatments with less guava pulp (T 7 and T 8 ) stayed at a higher pH because sapota and papaya pulps are less acidic.
Total soluble solids
TSS increased continuously during storage (Table 2; Fig. 2). Maximum TSS was recorded in T 8 (74.25 °Brix at 0 days to 75.25 °Brix at 90 days) and minimum in T 1 (72.31 to 73.30 °Brix). The rise is due to hydrolysis of polysaccharides into simpler sugars and slight concentration from moisture loss (Pareek et al., 2010) [6] . Treatment ranking did not change with time.
| Treatment (G:S:P) | 0 days | 30 days | 60 days | 90 days |
|---|---|---|---|---|
| T8 (40:30:30) | 74.25 | 74.60 | 74.91 | 75.25 |
| SEm ± | 0.034 | 0.065 | 0.051 | 0.035 |
| CD (5%) | 0.10 | 0.19 | 0.15 | 0.10 |
Table text extracted from the original PDF; superscript letters are shown inline. The original table image is below.
View original table image
| Treatment (G:S:P) | 0 days | 30 days | 60 days | 90 days |
|---|---|---|---|---|
| T1 (100:0:0) | 72.31 | 72.59 | 72.96 | 73.30 |
| T2 (80:20:0) | 73.22 | 73.57 | 73.86 | 74.22 |
| T3 (80:0:20) | 73.51 | 73.83 | 74.17 | 74.51 |
| T4 (70:20:10) | 72.84 | 73.04 | 73.38 | 73.72 |
| T5 (70:10:20) | 72.35 | 72.67 | 73.01 | 73.35 |
| T6 (60:20:20) | 73.59 | 73.91 | 74.25 | 74.59 |
| T7 (50:25:25) | 73.84 | 74.19 | 74.50 | 74.84 |
Table text extracted from the original PDF; superscript letters are shown inline. The original table image is below.
View original table image
Titratable acidity
Titratable acidity increased with storage in all blends (Table 3; Fig. 3). Highest acidity was in T 1 (1.42% to 1.50%) and lowest in T 8 (0.93% to 1.05%). Higher acidity in high-guava treatments reflects the acid content of guava pulp (0.38%). The slow rise is consistent with formation of organic acids during storage (Kuchi et al., 2014) [7] .
| Treatment (G:S:P) | 0 days | 30 days | 60 days | 90 days |
|---|---|---|---|---|
| T6 (60:20:20) | 1.10 | 1.14 | 1.20 | 1.26 |
| T7 (50:25:25) | 0.95 | 0.95 | 1.08 | 1.18 |
| T8 (40:30:30) | 0.93 | 0.97 | 1.01 | 1.05 |
| SEm ± | 0.015 | 0.013 | 0.011 | 0.012 |
| CD (5%) | 0.045 | 0.039 | 0.034 | 0.037 |
Table text extracted from the original PDF; superscript letters are shown inline. The original table image is below.
View original table image
| Treatment (G:S:P) | 0 days | 30 days | 60 days | 90 days |
|---|---|---|---|---|
| T1 (100:0:0) | 1.42 | 1.47 | 1.48 | 1.50 |
| T2 (80:20:0) | 1.37 | 1.41 | 1.42 | 1.46 |
| T3 (80:0:20) | 1.40 | 1.43 | 1.45 | 1.47 |
| T4 (70:20:10) | 1.27 | 1.30 | 1.34 | 1.37 |
| T5 (70:10:20) | 1.25 | 1.28 | 1.31 | 1.37 |
Table text extracted from the original PDF; superscript letters are shown inline. The original table image is below.
View original table image
Reducing, non-reducing and total sugars
Reducing sugars increased in every treatment (Table 4; Fig. 4). T 8 rose from 8.39% to 8.90% and T 1 from 7.42% to 8.10%. Non-reducing sugars declined (Table 5; Fig. 5): T 8 from 58.99% to 57.64% and T 3 from 57.25% to 55.88%. Total sugars also declined modestly (Table 6; Fig. 6), with T 8 retaining the highest content (67.38% to 66.54%). . Inversion proceeded at a similar rate in all blends; T 8 remained the most sugar-rich bar at every interval.
| Treatment (G:S:P) | 0 days | 30 days | 60 days | 90 days |
|---|---|---|---|---|
| T1 (100:0:0) | 65.56 | 65.44 | 65.20 | 64.85 |
| T2 (80:20:0) | 66.29 | 66.08 | 65.85 | 65.48 |
| T3 (80:0:20) | 64.76 | 64.75 | 64.43 | 64.21 |
| T4 (70:20:10) | 65.34 | 65.15 | 64.83 | 64.51 |
| T5 (70:10:20) | 65.93 | 65.67 | 65.33 | 65.01 |
| T6 (60:20:20) | 66.87 | 66.69 | 66.32 | 65.96 |
| T7 (50:25:25) | 66.70 | 66.61 | 66.23 | 65.91 |
| T8 (40:30:30) | 67.38 | 67.15 | 66.85 | 66.54 |
| SEm ± | 0.11 | 0.12 | 0.14 | 0.10 |
| CD (5%) | 0.35 | 0.37 | 0.40 | 0.32 |
Table text extracted from the original PDF; superscript letters are shown inline. The original table image is below.
View original table image
| Treatment (G:S:P) | 0 days | 30 days | 60 days | 90 days |
|---|---|---|---|---|
| T1 (100:0:0) | 58.14 | 57.75 | 57.28 | 56.75 |
| T2 (80:20:0) | 58.65 | 58.27 | 57.80 | 57.25 |
| T3 (80:0:20) | 57.25 | 56.90 | 56.40 | 55.88 |
| T4 (70:20:10) | 57.41 | 57.07 | 56.56 | 56.05 |
| T5 (70:10:20) | 57.72 | 57.35 | 56.86 | 56.35 |
| T6 (60:20:20) | 58.65 | 58.28 | 57.78 | 57.24 |
| T7 (50:25:25) | 58.43 | 58.05 | 57.58 | 57.07 |
| T8 (40:30:30) | 58.99 | 58.62 | 58.14 | 57.64 |
| SEm ± | 0.18 | 0.16 | 0.18 | 0.20 |
Table text extracted from the original PDF; superscript letters are shown inline. The original table image is below.
View original table image
| Treatment (G:S:P) | 0 days | 30 days | 60 days | 90 days |
|---|---|---|---|---|
| T1 (100:0:0) | 7.42 | 7.69 | 7.92 | 8.10 |
| T2 (80:20:0) | 7.64 | 7.81 | 8.05 | 8.23 |
| T3 (80:0:20) | 7.51 | 7.85 | 8.03 | 8.33 |
| T4 (70:20:10) | 7.93 | 8.08 | 8.27 | 8.46 |
| T5 (70:10:20) | 8.21 | 8.32 | 8.47 | 8.66 |
| T6 (60:20:20) | 8.22 | 8.41 | 8.54 | 8.72 |
| T7 (50:25:25) | 8.27 | 8.53 | 8.65 | 8.84 |
| T8 (40:30:30) | 8.39 | 8.56 | 8.71 | 8.90 |
| SEm ± | 0.09 | 0.07 | 0.06 | 0.06 |
| CD (5%) | 0.27 | 0.22 | 0.20 | 0.20 |
Table text extracted from the original PDF; superscript letters are shown inline. The original table image is below.
View original table image
Overall acceptability
Overall acceptability declined slightly with storage but remained in the acceptable range on the 9-point scale (Table 7; Fig. 7). T 8 recorded the highest score at every interval (8.95, 8.89, 8.81 and 8.73). T 7 ranked second (8.70 to 8.48). T 1 declined from 7.00 to 6.80.
| Treatment (G:S:P) | 0 days | 30 days | 60 days | 90 days |
|---|---|---|---|---|
| T1 (100:0:0) | 7.00 | 6.95 | 6.88 | 6.80 |
| T2 (80:20:0) | 7.08 | 6.94 | 6.86 | 6.78 |
| T3 (80:0:20) | 7.50 | 7.45 | 7.38 | 7.30 |
| T4 (70:20:10) | 7.40 | 7.34 | 7.27 | 7.18 |
| T5 (70:10:20) | 8.00 | 7.95 | 7.88 | 7.80 |
| T6 (60:20:20) | 8.50 | 8.44 | 8.36 | 8.28 |
| T7 (50:25:25) | 8.70 | 8.64 | 8.56 | 8.48 |
| T8 (40:30:30) | 8.95 | 8.89 | 8.81 | 8.73 |
| SEm ± | 0.08 | 0.07 | 0.08 | 0.08 |
| CD (5%) | 0.24 | 0.21 | 0.24 | 0.24 |
Table text extracted from the original PDF; superscript letters are shown inline. The original table image is below.
View original table image
The small, parallel decline across treatments is typical of fruit bars stored at ambient temperature and is linked to slow loss of volatiles and slight darkening (Vennilla, 2004; Avhad et al., 2019) [10,3] . Because the loss was small, the blend that started best (T 8 ) also finished best. A 90-day ambient shelf life is therefore supported by both chemistry and overall acceptability.
References
11 in the original paper- Ranganna S. Handbook of Analysis and Quality Control for Fruit and Vegetable Products (2nd ed.). Tata McGraw-Hill, New Delhi; 1997.
- Sreemathi M, Sankaranarayanan R, Balasubramanian S. Preparation and storage behaviour of sapota-papaya fruit bar. Madras Agricultural Journal. 2008;95(1-6):170-173.
- Avhad SB, Ghadge PN, Chavan UD. Studies on preparation and storage of papaya-guava fruit bar. International Journal of Chemical Studies. 2019;7(3):2154-2158.
- Verma S, Bisen BP. Sensory evaluation of guava-papaya mixed fruit bar. Journal of Pharmacognosy and Phytochemistry. 2020;9(5):1234-1238.
- Panse VG, Sukhatme PV. Statistical Methods for Agricultural Workers. ICAR, New Delhi; 1985.
- Pareek S, Paliwal R, Mukherjee S. Effect of juice extraction methods and processing temperature-time on juice quality of Nagpur mandarin during storage. Journal of Food Science and Technology. 2010;48(2):197-203.
- Kuchi VS, Gupta R, Tamang S. Standardization of recipe for preparation of guava jelly bar. Journal of Crop and Weed. 2014;10(2):77-81.
- Gowri R, Peter KV. Changes in the quality of papaya jam during storage. Journal of Food Science and Technology. 2007;44(6):620-622.
- Khan RU, Afridi SR, Ilyas M, Sohail M, Abid H. Development of strawberry jam and its quality evaluation during storage. Pakistan Journal of Biochemistry and Molecular Biology. 2012;45(1):2325.
- Vennilla P. Studies on the storage behaviour of guava-papaya fruit bar. Beverage and Food World. 2004;31(2):63-66.
- How to cite this article: Sahu P, Dixit A, Das Khunte S, Netam N, Sao R. Physicochemical changes and overall acceptability of guava-based fruit bar during ambient storage. International Journal of Horticulture and Food Science. 2026;8(9):78-83. doi: https://www.doi.org/10.33545/26631067.2026.v8.i9b.857