
Research article · 2026 · Full text
International Journal of Horticulture and Food ScienceThe impact of technologies on operational efficiency and post-harvest loss reduction in agribusiness supply chains with cold chain integration
Volume 8(9S) · Pages 16–21 · DOI: 10.33545/26631067.2026.v8.i9sa.858 ↗
Research areasFood Supply Chain TraceabilitySustainable Supply Chain ManagementSupply Chain and Inventory Management
Abstract
Author-writtenPerishable agricultural commodities suffer heavy post-harvest losses because of weak handling, storage and transportation systems. This study examines how modern technologies influence operational efficiency and how cold chain integration contributes to minimizing post-harvest losses in agribusiness supply chains in Maharashtra, India. A descriptive and analytical design was adopted, and primary data were collected from 60 respondents comprising 30 supply chain stakeholders and 30 cold chain operators, selected through convenience sampling. Data were analysed using percentage analysis, Karl Pearson's correlation and multiple regression. Cold chain technology and GPS-based transportation tracking emerged as the most widely adopted technologies (18.18% each), while IoT sensors and blockchain remained at an early stage. All seven technology variables showed positive and significant effects on operational efficiency, with cold chain technology explaining the largest variation in product quality maintenance (R2 = 0.9211). Five cold chain integration factors jointly explained 81.76 per cent of the variation in minimizing post-harvest losses, leading to rejection of the null hypothesis.
Summary
Source-checkedPlain-language reading of the full paper, prepared with AI and checked against the text. Each point links to the authors' own words.
Why it matters
- Post-harvest losses are a significant global issue, with fruits and vegetables experiencing the highest loss rate of 25.4% in 2023. View evidence ↗
- In India, post-harvest losses for fruits are estimated between 6.02% and 15.05%, while vegetables range from 4.87% to 11.61%. View evidence ↗
The question
- The research also evaluates how the integration of cold chains is perceived to minimize post-harvest losses. View evidence ↗
What they did
- The researchers used a five-point Likert scale to measure the perceptions of the respondents. View evidence ↗
What they found
- Blockchain technology had the lowest adoption rate at 6.06%. View evidence ↗
- Cold chain technology was the most effective for maintaining product quality, explaining 92.11% of the variation. View evidence ↗
- GPS and transportation tracking systems explained 89.66% of the variation in delivery and coordination efficiency. View evidence ↗
- Five integrated cold chain factors jointly explained 81.76% of the variation in the reduction of post-harvest losses. View evidence ↗
What it means
- The authors conclude that refrigerated capacity must be combined with sensor monitoring and controlled transport to effectively reduce post-harvest losses. View evidence ↗
- The study's generalizability is limited by its small sample size, use of convenience sampling, and reliance on perception-based data from a single state. View evidence ↗
Visual summary
2 visualsIllustrations explain the paper; charts are replotted from the paper's own table values.
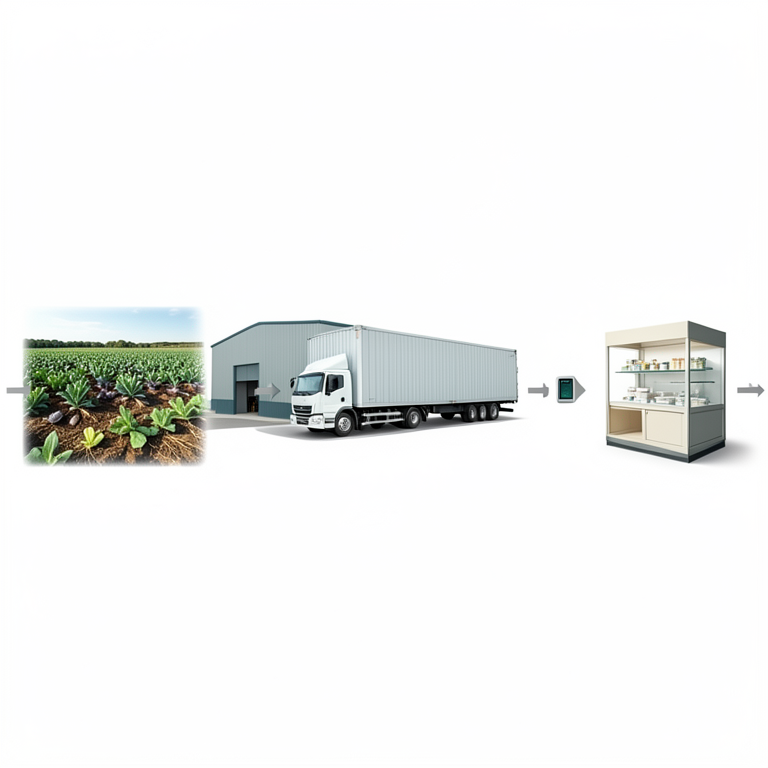
Integrated Cold Chain System
AI-generated conceptual illustration (Fresh produce in a cold chain supply chain). It explains the idea and does not show study data.
View source evidence ↗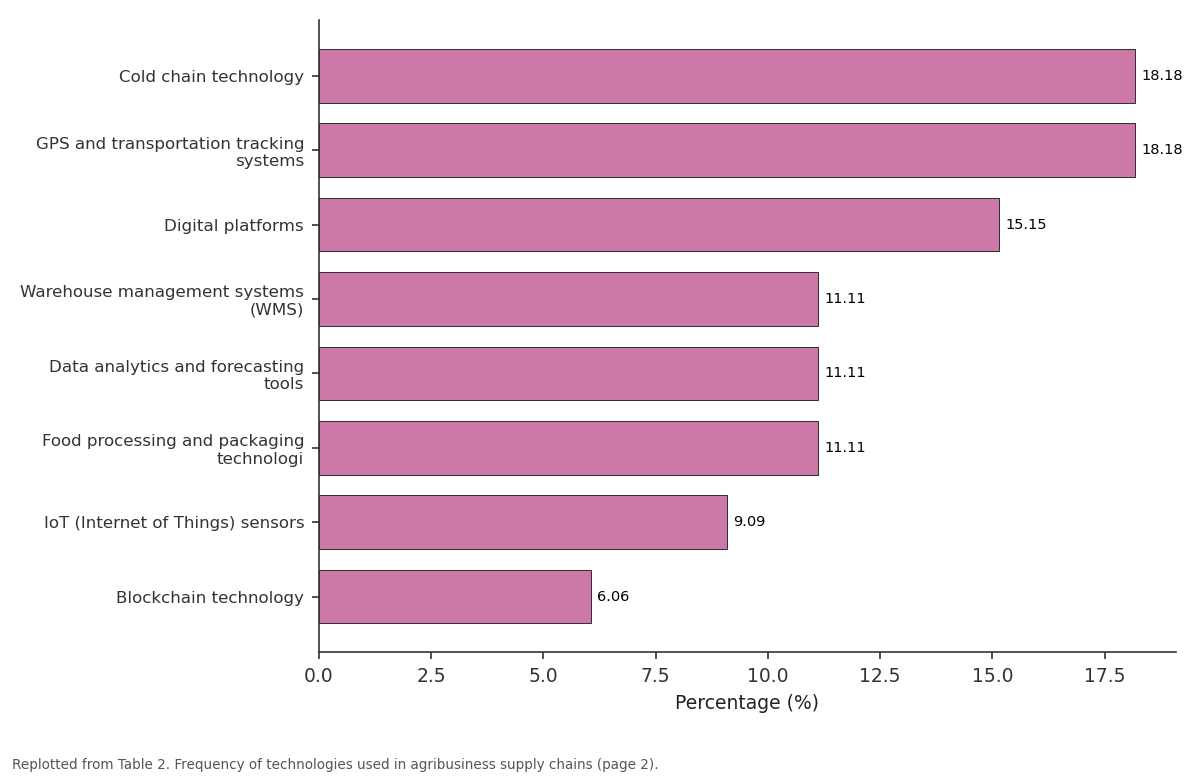
Percentage (%): Cold chain technology vs GPS and transportation... vs Digital platforms vs Warehouse management... vs Data analytics and...
Replotted from Table 2 (page 2) of the original paper. Every bar is the paper's own table value.
View source evidence ↗Figures & tables
From the original paper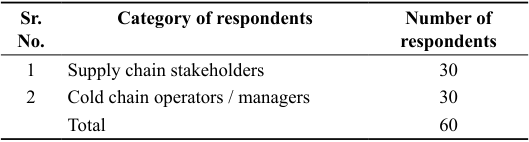 Table 1
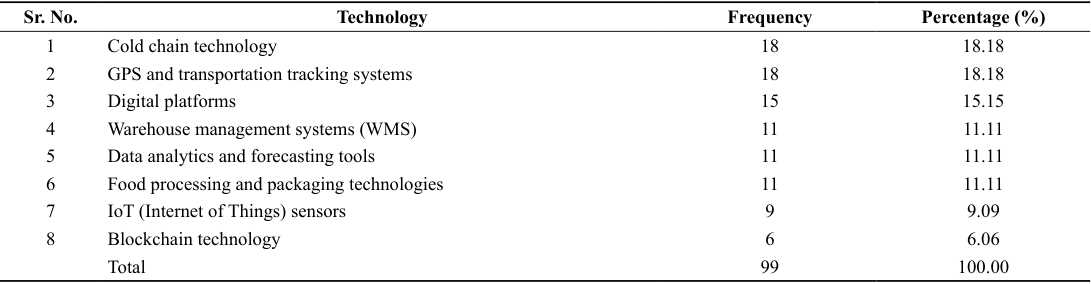 Table 2
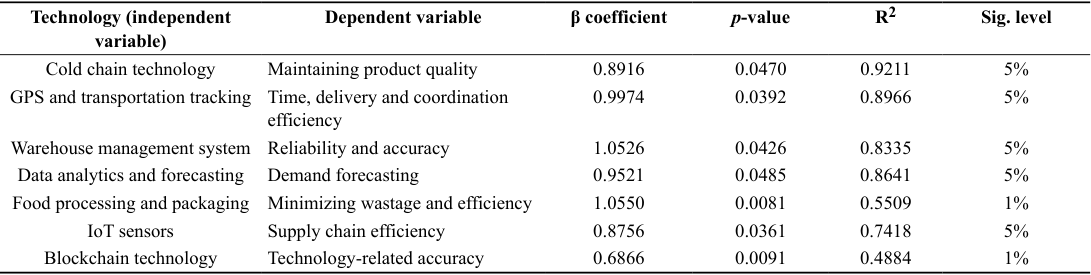 Table 3
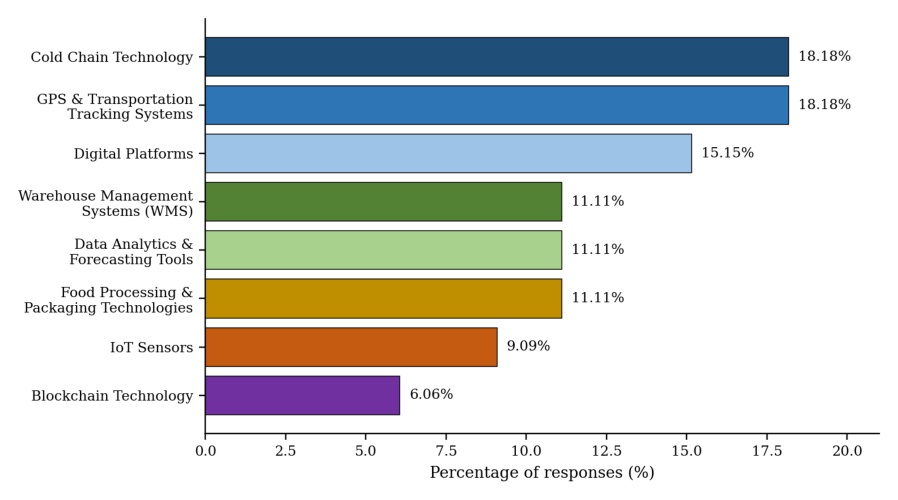 Figure 1
 Table 4
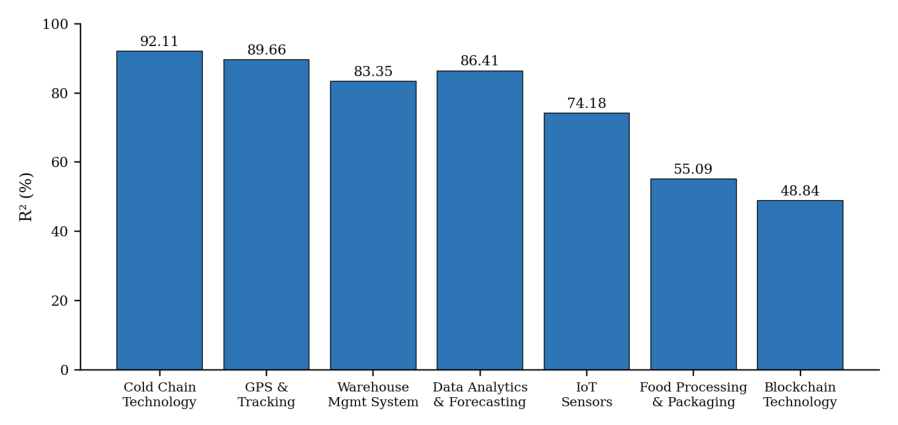 Figure 2
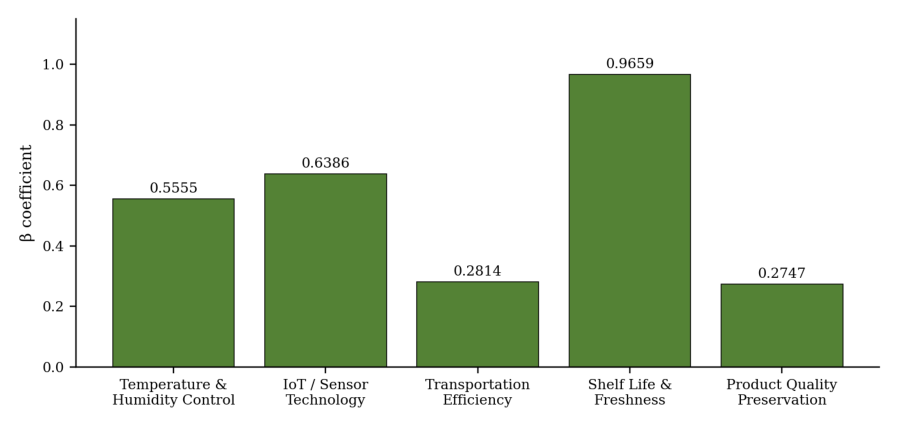 Figure 3
Introduction
Agribusiness supply chains link farmers with final consumers through a sequence of interdependent activities that include production, collection, transportation, storage, processing, packaging, distribution and marketing. Because a large share of agricultural output is biologically active and highly perishable, the efficiency of each of these stages directly determines the quantity and quality of produce that finally reaches the consumer. Fruits, vegetables, dairy products and flowers are particularly sensitive to temperature, relative humidity, handling intensity and transit time, and any weakness in the chain translates quickly into physical loss, quality deterioration and reduced farm-gate realisation. The magnitude of the problem is well documented. Globally, an estimated 13.3 per cent of food produced was lost between the post-harvest stage and the retail stage in 2023, with fruits and vegetables recording the highest loss rate of 25.4 per cent. In India, a study conducted by NABCONS in 2022 for the Ministry of Food Processing Industries estimated post-harvest losses of 6.02 to 15.05 per cent for fruits and 4.87 to 11.61 per cent for vegetables. Inadequate cold chain infrastructure has been identified as one of the principal reasons for these losses; national assessments have indicated a requirement of approximately 61 million tonnes of cold storage capacity against about 32 million tonnes of available capacity, pointing to a substantial infrastructure deficit (Aamer et al., 2025; Afreen et al., 2021) [1,2] . Technology has consequently become a central component of modern supply chain management. Traditional agribusiness chains rely largely on manual processes, conventional transportation, physical record keeping and limited information sharing among participants. In contrast, digital and automated technologies -including cold chain technology, GPS and transportation tracking systems, warehouse management systems (WMS), Internet of Things (IoT) sensors, data analytics and forecasting tools, blockchain, and food processing and packaging technologies -improve inventory control, transportation visibility, demand forecasting, temperature monitoring, traceability and managerial decision making (Ben-Daya et al., 2019; Christopher, 2016; Gardas et al., 2018) [3,4,5] . Cold chain integration is especially critical for perishables, since maintaining appropriate temperature and humidity conditions across the chain slows physiological, biochemical and microbial deterioration and extends shelf life (Gligor et al., 2018; Kamble et al., 2020) [6,7] . Although both technology adoption and cold chain integration are widely recognised as important, they have largely been studied in isolation. There is limited empirical evidence on how multiple technologies jointly influence operational efficiency under Indian field conditions, and on how stakeholders perceive the effectiveness of integrated cold chain systems in reducing post-harvest losses. The present paper addresses these To study the impact of technologies on operational efficiency in agribusiness supply chains.
2.
To evaluate the perceived impact of cold chain integration on minimizing post-harvest losses.
Corresponding to the second objective, the following hypotheses were formulated: H 0 : Cold chain integration has no significant impact on minimizing post-harvest losses in agricultural supply chains. H 1 : Cold chain integration has a significant effect on minimizing post-harvest losses in agricultural supply chains.
Materials and Methods
The study followed a descriptive, analytical and exploratory research design and was primarily quantitative in nature. It was conducted in Maharashtra, India, a state selected for its substantial horticultural production, diversified agribusiness activity and expanding cold chain infrastructure. Respondents were selected through convenience sampling, and for the two objectives reported in this paper a total of 60 respondents were surveyed, comprising 30 supply chain stakeholders and 30 cold chain operators or managers (Table 1). Both primary and secondary data were used. Primary data were collected through a structured questionnaire administered online through Google Forms and offline through personal interaction. Separate schedules were designed for the three respondent categories so that questions on technology use, cold chain practice and loss experience were framed appropriately for each group. Perception items were measured on a five-point Likert scale ranging from strongly disagree to strongly agree. Secondary data were drawn from the Food and Agriculture Organization (FAO), the Ministry of Food Processing Industries, ICAR-CIPHET, NABARD, NITI Aayog, FSSAI, APEDA, government reports and published research. The collected data were analysed using frequency distribution and percentage analysis, Karl Pearson's coefficient of correlation and multiple regression analysis, with Microsoft Excel used for processing.
| Sr. | Category of respondents | Number of |
|---|---|---|
| No. | respondents | |
| 1 | Supply chain stakeholders | 30 |
| 2 | Cold chain operators / managers | 30 |
| Total | 60 |
Table text extracted from the original PDF; superscript letters are shown inline. The original table image is below.
View original table image
For the first objective, simple regression models were estimated in which each technology variable -cold chain technology, GPS and transportation tracking, warehouse management systems, data analytics and forecasting tools, food processing and packaging technologies, IoT sensors and blockchain -was regressed on the corresponding dimension of operational efficiency reported by stakeholders. For the second objective, a multiple regression model of the following form was estimated:
where Y denotes the perceived minimization of post-harvest losses, X 1 is temperature and humidity control, X 2 is IoT and sensor technology, X 3 is transportation efficiency, X 4 is shelf life and freshness, X 5 is product quality preservation, α is the intercept, β 1 to β 5 are the regression coefficients and e is the error term. The significance of individual coefficients was tested using p-values, and the overall fit of the model was assessed using the coefficient of determination (R 2 ), the adjusted R 2 and the F-statistic, with significance judged at the 1, 5 and 10 per cent levels.
Results and Discussion
Results and Discussion
Impact of technologies on operational efficiency
Among the 30 supply chain stakeholders surveyed, supply chain managers (36.66%) and operations managers (30.00%) formed the largest designation groups, followed by assistant managers-operations (13.33%), while managers, logistics managers and procurement executives accounted for 6.66 per cent each. This distribution indicates that the respondents were directly involved in supply chain planning, technology adoption and operational decision making, and were therefore in a position to report reliably on the effects of technology on day-to-day performance. Table 2 presents the frequency with which different technologies were reported in use. Since respondents could report more than one technology, the responses total 99. Cold chain technology and GPS-based transportation tracking systems were the most frequently reported technologies, each accounting for 18.18 per cent of responses. This reflects the immediate operational priorities of perishable supply chains, namely preserving produce condition and maintaining visibility over goods in transit. Digital platforms followed at 15.15 per cent, supporting communication, market linkage and coordination among chain participants. Warehouse management systems, data analytics and forecasting tools, and food processing and packaging technologies were each reported by 11.11 per cent of respondents. IoT sensors (9.09%) and blockchain technology (6.06%) recorded the lowest adoption, indicating that technologies demanding greater digital infrastructure, capital outlay and technical expertise remain at an early stage of diffusion. A similar pattern of selective and infrastructure-constrained adoption of Industry 4.0 technologies in agri-food chains has been reported in the literature (Christopher, 2016; Kamilaris et al., 2019) [4,8] . The regression results summarising the influence of individual technologies on the corresponding dimensions of operational efficiency are presented in Table 3. ) of technology variables for operational efficiency All seven technology variables recorded positive regression coefficients that were statistically significant, five at the 5 per cent level and two at the 1 per cent level. Cold chain technology showed the highest explanatory power, accounting for 92.11 per cent of the variation in the maintenance of product quality, which confirms its central role in perishable handling and is consistent with earlier evidence that temperature management is the single most decisive determinant of quality assurance in perishable food chains (Gligor et al., 2018) [6] . GPS and transportation tracking systems explained 89.66 per cent of the variation in time, delivery and coordination efficiency, and warehouse management systems explained 83.35 per cent of the variation in reliability and accuracy, indicating that visibility over movement and over stock position are the two most immediate operational gains from digitalisation. Data analytics and forecasting tools explained 86.41 per cent of the variation in demand forecasting capability, supporting the view that data-driven planning improves responsiveness in agricultural supply chains (Kumar et al., 2023; MoFPI et al., 2015) [9,10] . Food processing and packaging technologies recorded the largest coefficient (β = 1.0550) but a lower R 2 of 0.5509, which suggests a strong but narrower effect confined mainly to wastage reduction at the handling and packing stage. IoT sensors explained 74.18 per cent of the variation in overall supply chain efficiency, while blockchain technology recorded the lowest explanatory power (R 2 = 0.4884), which is unsurprising given that only 6.06 per cent of respondents reported using it and that its benefits in traceability accrue only when adoption extends across the whole chain (Mustafa et al., 2024) [11] . Taken together, these results indicate that technology adoption significantly improves the speed, accuracy, visibility, coordination and reliability of agribusiness supply chain operations, and that the technologies delivering the largest measured gains are precisely those addressing the physical condition of the produce and the movement of goods.
| Technology (independent | Dependent variable | β coefficient | p-value | R2 | Sig. level |
|---|---|---|---|---|---|
| variable) | |||||
| Cold chain technology | Maintaining product quality | 0.8916 | 0.0470 | 0.9211 | 5% |
| GPS and transportation tracking | Time, delivery and coordination | 0.9974 | 0.0392 | 0.8966 | 5% |
| efficiency | |||||
| Warehouse management system | Reliability and accuracy | 1.0526 | 0.0426 | 0.8335 | 5% |
| Data analytics and forecasting | Demand forecasting | 0.9521 | 0.0485 | 0.8641 | 5% |
| Food processing and packaging | Minimizing wastage and efficiency | 1.0550 | 0.0081 | 0.5509 | 1% |
| IoT sensors | Supply chain efficiency | 0.8756 | 0.0361 | 0.7418 | 5% |
| Blockchain technology | Technology-related accuracy | 0.6866 | 0.0091 | 0.4884 | 1% |
Table text extracted from the original PDF; superscript letters are shown inline. The original table image is below.
View original table image
| Sr. No. | Technology | Frequency | Percentage (%) |
|---|---|---|---|
| 1 | Cold chain technology | 18 | 18.18 |
| 2 | GPS and transportation tracking systems | 18 | 18.18 |
| 3 | Digital platforms | 15 | 15.15 |
| 4 | Warehouse management systems (WMS) | 11 | 11.11 |
| 5 | Data analytics and forecasting tools | 11 | 11.11 |
| 6 | Food processing and packaging technologies | 11 | 11.11 |
| 7 | IoT (Internet of Things) sensors | 9 | 9.09 |
| 8 | Blockchain technology | 6 | 6.06 |
| Total | 99 | 100.00 |
Table text extracted from the original PDF; superscript letters are shown inline. The original table image is below.
View original table image
Perceived impact of cold chain integration on minimizing post-harvest losses
Among the cold chain operators and managers surveyed, fruits were the dominant commodity handled (52.27%), followed by vegetables (25.00%), processed and packaged food products (9.09%), dairy products (6.81%), flowers (4.54%) and grains and cereals (2.27%). Cold chain capacity in the study area is therefore concentrated on highly perishable horticultural produce, which is consistent with the commodity pattern of post-harvest loss reported nationally. The results of the multiple regression model specified in Equation ( 1) are presented in Table 4. (continued on next page) ). The null hypothesis that cold chain integration has no significant impact on minimizing post-harvest losses is therefore rejected, and the alternative hypothesis is accepted. Shelf life and freshness emerged as the strongest individual contributor (β = 0.9659, p = 0.0109), implying that operators judge a cold chain primarily by the additional marketable life it confers on the produce rather than by the presence of refrigeration as such. IoT and sensor technology recorded the second largest coefficient (β = 0.6386), which is notable given that IoT was among the least adopted technologies in Table 2; where sensor-based monitoring has been installed, it is perceived as materially reducing losses through early detection of temperature excursions. This supports earlier findings that real-time monitoring and notification systems in cold storage substantially improve loss prevention (Singh et al., 2018; Wamba et al., 2020) [12,13] . Temperature and humidity control followed (β = 0.5555), while transportation efficiency (β = 0.2814) and product quality preservation (β = 0.2747) recorded smaller but positive coefficients. Three of the five coefficients were significant only at the 10 per cent level, which should be read alongside the modest sample size and the use of perception-based measures; the overall model, however, is strongly significant. Substantively, the pattern of coefficients indicates that cold chain integration operates as a system rather than as a single asset. Refrigerated storage in isolation delivers limited benefit unless it is combined with sensor-based monitoring, temperature-controlled movement and coordinated handling across the chain. This interpretation is consistent with studies that identify the transport and last-mile segments as the weakest links in the Indian fruit and vegetable cold chain (Afreen et al., 2021; Yadav et al., 2022) [2,14] , and with evidence from other developing economies that fragmented, partially integrated cold chains fail to convert investment into loss reduction [15].
| Sr. No. | Factor | β coefficient | p-value | Significance |
|---|---|---|---|---|
| 1 | Temperature and humidity control | 0.5555 | 0.0834 | 10% |
| 2 | IoT / sensor technology | 0.6386 | 0.0579 | 10% |
| 3 | Transportation efficiency | 0.2814 | 0.0877 | 10% |
| 4 | Shelf life and freshness | 0.9659 | 0.0109 | 5% |
| 5 | Product quality preservation | 0.2747 | 0.0332 | 5% |
| 2 2 | 7 |
Table text extracted from the original PDF; superscript letters are shown inline. The original table image is below.
View original table image
Conclusions
The study concludes that technology adoption and cold chain integration both make a statistically significant contribution to the performance of agribusiness supply chains in Maharashtra. With respect to the first objective, cold chain technology and GPS-based transportation tracking were the most widely adopted technologies (18.18% each), whereas IoT sensors and blockchain remained at an early stage of diffusion. All seven technology variables exerted a positive and significant influence on operational efficiency, with cold chain technology explaining the largest share of variation in product quality maintenance (R 2 = 0.9211), followed by GPS and transportation tracking (R 2 = 0.8966) and warehouse management systems (R 2 = 0.8335). With respect to the second objective, the five dimensions of cold chain integration -temperature and humidity control, IoT and sensor technology, transportation efficiency, shelf life and freshness, and product quality preservation -jointly explained 81.76 per cent of the variation in minimizing post-harvest losses, and the model was significant at the 1 per cent level. The null hypothesis was accordingly rejected. Shelf life and freshness and IoT-based monitoring were the strongest contributors, indicating that effective cold chain integration extends well beyond refrigerated storage to encompass continuous monitoring, controlled transportation and coordinated handling. The findings suggest that investment in refrigerated capacity alone is unlikely to yield proportionate reductions in post-harvest loss unless it is accompanied by sensor-based monitoring, reliable temperaturecontrolled transport and adequate technical capacity among users. Given the low adoption of IoT and blockchain recorded here alongside their measured contribution, there is a case for targeted support -through farmer producer organisation-based shared facilities, subsidised sensor retrofitting and training -to extend these technologies to small and marginal producers. The study is limited by its reliance on convenience sampling, a modest sample size and perception-based measures within a single state; larger probability-based samples and objective loss measurement across multiple states would allow firmer generalisation.
Acknowledgement
AcknowledgmentsThe author gratefully acknowledges the valuable guidance, constructive suggestions, and continuous support of Dr. M. S. Pisal, Assistant Professor, Division of Agricultural Economics, throughout the course of this research. The author also expresses sincere appreciation to the management, faculty members, and Advisory Committee of Dr. Sharadchandra Pawar College of MBA (Agri.), Baramati, for their academic support and encouragement. Special thanks are extended to all respondents and stakeholders who participated in the study and provided valuable information and insights. The author is also grateful to family members and friends for their constant encouragement and support throughout the research process.
Figures and tables from the paper
References
14 in the original paper- Aamer AM, Al-Awlaqi MA, Rausyan Fikri M. Smart food logistics: design and test of an IoT-based food traceability system. International Journal of Logistics Research and Applications. 2025.
- Afreen H, Bajwa IS. An IoT-based real-time intelligent monitoring and notification system of cold storage. IEEE Access. 2021;9:38236-38253.
- Ben-Daya M, Hassini E, Bahroun Z. Internet of things and supply chain management: a literature review. International Journal of Production Research. 2019;57(15-16):4719-4742.
- Christopher M. Logistics & Supply Chain Management. 5th edition, Pearson Education, Harlow, United Kingdom; 2016.
- Gardas BB, Raut RD, Narkhede B. Evaluating critical causal factors for post-harvest losses (PHL) in the fruit and vegetables supply chain in India using the DEMATEL approach. Journal of Cleaner Production. 2018;199:47-61.
- Gligor D, Tan A, Nguyen TNT. The obstacles to cold chain implementation in developing countries: insights from Vietnam. The International Journal of Logistics Management. 2018;29(3):942958.
- Kamble SS, Gunasekaran A, Gawankar SA. Achieving sustainable performance in a data-driven agriculture supply chain: a review for research and applications. International Journal of Production Economics. 2020;219:179-194.
- Kamilaris A, Fonts A, Prenafeta-Boldú FX. The rise of blockchain technology in agriculture and food supply chains. Trends in Food Science & Technology. 2019;91:640-652.
- Kumar A, Agrawal S. Challenges and opportunities for agri-fresh food supply chain management in India. Computers and Electronics in Agriculture. 2023;212:108161.
- MoFPI, ICAR-CIPHET. Study on cold-chain infrastructure and post-harvest management of agricultural produce in India. Ministry of Food Processing Industries and ICAR-CIPHET, Government of India; 2015.
- Mustafa A, Navaranjan N, Demirovic D. Food cold chain logistics and management: a review of current development and emerging trends. Journal of Agriculture and Food Research. 2024;18:101343.
- Singh BK, Negi S. Cold chain logistics: an impediment in the perishable food industry of India. International Journal of Logistics Economics and Globalisation. 2018;7(4):332-352.
- Wamba SF, Dubey R, Gunasekaran A, Akter S. The performance effects of big data analytics and supply chain ambidexterity. International Journal of Production Economics. 2020;222:107498.
- Yadav VS, Singh AR, Raut RD, Mangla SK, Luthra S, Kumar A. Exploring the application of Industry 4.0 technologies in the agricultural food supply chain: a systematic literature review. Computers & Industrial Engineering. 2022;169:108304. How to cite this article: Deore PP, Pisal M, Gadhave A, Deokate P, Jadhav R. The impact of technologies on operational efficiency and post-harvest loss reduction in agribusiness supply chains with cold chain integration. International Journal of Horticulture and Food Science. 2026;8(9S):16-21. doi: https://w ww.doi.org/10.33545/26631067.2026.v8.i9Sa.858 International Journal of Horticulture and Food Science https://www.hortijournal.com 26631075, 2026, 8(9S), Downloaded from https://www.doi.org/10.33545/26631067.2026.v8.i9Sa.858 by International Journal of Horticulture and Food Science on [24/09/2026]. See the Terms and Conditions (https://www.hortijournal.com) for rules of use; OA articles are governed by the applicable Creative Commons License