
Research article · 2026 · Full text
International Journal of Horticulture and Food ScienceIdentification of yield-contributing traits in bitter gourd (Momordica charantia L.) through correlation and path coefficient analysis
Volume 8(9) · Pages 45–48 · DOI: 10.33545/26631067.2026.v8.i9a.855 ↗
Research areasAdvances in Cucurbitaceae ResearchAgricultural Practices and Plant GeneticsGenetics and Plant Breeding
Abstract
Author-writtenThe present study was undertaken to determine the traits that contribute substantially to fruit yield in bitter gourd (Momordica charantia L.) using correlation and path coefficient analyses. Twenty genotypes were assessed for 15 quantitative characteristics during the Zaid season of 2025. Analysis of variance revealed significant differences among the genotypes for all the characters under investigation, demonstrating the existence of considerable variability within the evaluated material. Fruit yield per vine exhibited positive and significant relationships with days to first male flower appearance, number of flowers per vine, days to first fruit harvest, number of fruits per vine, days to first fruit set, number of branches per vine, fruit weight, fruit diameter, internodal length and fruit length at the phenotypic and/or genotypic levels. In general, the genotypic correlation coefficients were greater than their corresponding phenotypic values, suggesting that environmental effects had a relatively smaller influence on the associations among the traits. Path coefficient analysis showed that number of flowers per vine had the largest positive direct contribution to fruit yield (0.4110). It was followed by days to first fruit harvest (0.3142), number of branches per vine (0.2713), days to first male flower appearance (0.2544) and fruit weight (0.2246). The combined results of correlation and path analyses indicate that number of flowers per vine, number of fruits per vine, number of branches per vine and fruit weight are particularly useful traits for identifying superior genotypes. Therefore, these characters may receive greater emphasis during selection and breeding programmes aimed at increasing fruit productivity in bitter gourd.
Summary
Source-checkedPlain-language reading of the full paper, prepared with AI and checked against the text. Each point links to the authors' own words.
Why it matters
- Bitter gourd is an economically significant vegetable grown in tropical and subtropical regions, valued for both its nutritional and medicinal properties. View evidence ↗
- Improving fruit yield in bitter gourd is challenging because productivity is a complex trait influenced by multiple component characteristics. View evidence ↗
What they did
- The study evaluated 20 bitter gourd genotypes during the Zaid season of 2025 at the Horticulture Research Centre in Meerut, Uttar Pradesh. View evidence ↗
- The researchers used a Randomized Block Design (RBD) with three replications for the evaluation. View evidence ↗
- The analysis focused on 15 different quantitative traits of the plants. View evidence ↗
- Phenotypic, genotypic, and environmental correlations were estimated using Searle's procedure, while path analysis followed methods by Wright, Dewey, and Lu. View evidence ↗
What they found
- Genotypically, the strongest positive correlations with fruit yield were found for number of flowers per vine (r = 0.679), number of fruits per vine (r = 0.623), and days to first male flower appearance (r = 0.619). View evidence ↗
- Other traits with significant positive direct effects on yield included days to first fruit harvest (0.3142), number of branches per vine (0.2713), days to first male flower appearance (0.2544), and fruit weight (0.2246). View evidence ↗
What it means
- The authors conclude that number of flowers per vine, number of fruits per vine, number of branches per vine, and fruit weight are the most useful criteria for selecting high-yielding bitter gourd genotypes. View evidence ↗
Visual summary
2 visualsIllustrations explain the paper; charts are replotted from the paper's own table values.
Direct Effects on Yield
AI-generated conceptual illustration (bitter gourd plants (Momordica charantia L.)). It explains the idea and does not show study data.
View source evidence ↗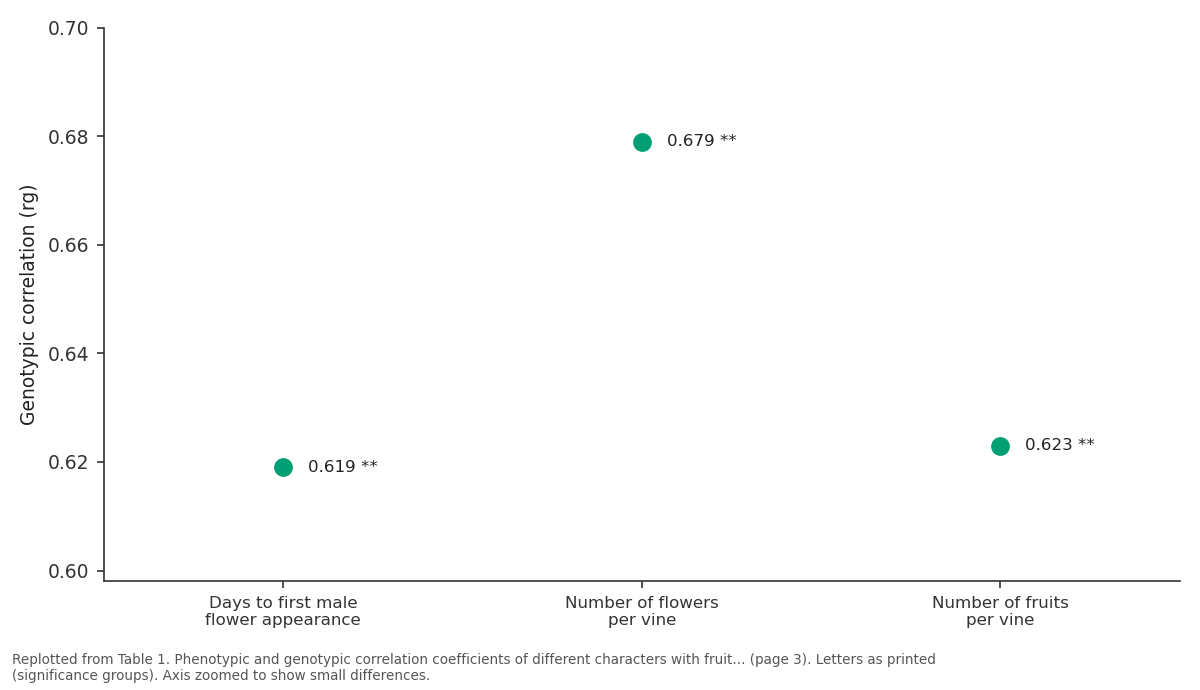
Genotypic correlation (rᵍ): Days to first male... vs Number of flowers per... vs Number of fruits per...
Replotted from Table 1 (page 3) of the original paper. Every bar is the paper's own table value.
View source evidence ↗Figures & tables
From the original paper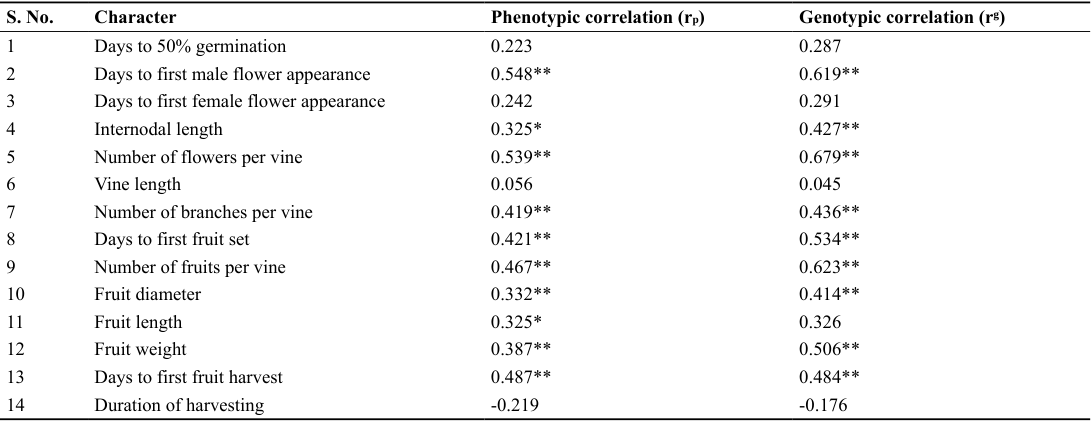 Table 1
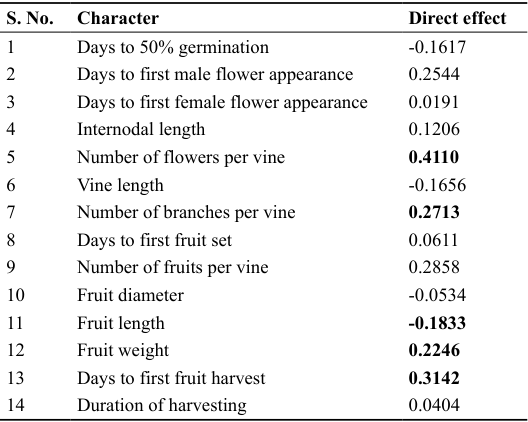 Table 2
Introduction
Bitter gourd (Momordica charantia L.) is an economically important vegetable belonging to the family Cucurbitaceae and is extensively grown in tropical and subtropical environments. Besides its importance as a vegetable crop, it is also recognized for its nutritional and medicinal value. The crop possesses substantial diversity in vegetative growth, flowering behaviour, maturity and fruit characteristics, which provides opportunities for the development of improved genotypes. The availability of genetic variability is fundamental to any successful crop improvement programme. Estimates of heritability and genetic advance further assist in determining whether the observed variation can be effectively exploited through selection. Reddy et al. (2019) [1] highlighted the significance of genetic diversity in bitter gourd for selecting suitable parents and developing improved breeding material. Fruit productivity is a complex quantitative character governed by several component traits. Consequently, improvement in yield requires identification of characters that have a close and reliable relationship with yield. Mahesh et al. (2014) [2] reported a favourable association between number of fruits per vine and fruit yield in bitter gourd. Khan et al. (2015) [3] observed that average fruit weight, number of fruits per plant, days to male flowering and fruit length contributed positively to yield through their direct effects. Similarly, Yadagiri et al. (2017) [4] and Kumar et al. (2018) [5] emphasized the importance of vine growth, branching behaviour, fruit number and fruit weight in determining yield performance. Triveni et al. (2021) [6] and Kumar et al. (2022) also identified fruit weight, fruit length, fruit diameter and number of fruits per vine as important yield-associated characteristics. Correlation analysis provides information regarding the direction and magnitude of association between traits, whereas path coefficient analysis provides additional information by separating the observed correlation into direct and indirect effects. The combined use of these approaches therefore facilitates the identification of characters that can be effectively used as selection criteria.
Keeping this in view, the present investigation was carried out to determine the important yield-associated traits in bitter gourd and to assess their direct and indirect contributions to fruit yield through correlation and path coefficient analyses.
Materials and methods
Materials and methods
Experimental site and duration
The experiment was conducted at the Horticulture Research Centre of Sardar Vallabhbhai Patel University of Agriculture and Technology, Meerut, Uttar Pradesh, during the Zaid season of 2025. The experimental location lies at 29.01° N latitude, 77.75° E longitude, with an elevation of approximately 237 m above mean sea level.
Experimental material
The experimental material comprised 20 bitter gourd genotypes. Most of the germplasm accessions were obtained from the National Bureau of Plant Genetic Resources (NBPGR), New Delhi, while Arka Harit was included from the local collection.
Experimental design and crop management
The genotypes were evaluated in a Randomized Block Design (RBD) with three replications. Direct sowing was carried out in the field during April. Seeds were placed at a depth of approximately 4-5 cm on ridges maintained at a spacing of 1.25 m × 0.80 m. Standard crop management practices, including recommended nutrient application and other agronomic operations, were followed during the growing period to maintain satisfactory crop growth. The experimental design and spacing used in the study are consistent with the uploaded experimental record.
Observations recorded
Observations were obtained from five randomly selected plants from each genotype in every replication. Measurements were taken at the appropriate stages of plant development, and the resulting mean values were used for statistical analysis. A total of 15 quantitative traits were considered: Fruit dimensions were measured using a digital vernier calliper. Average fruit weight was expressed in grams. Fruit yield per vine was calculated from the cumulative produce obtained during successive harvests.
Statistical analysis
Statistical analysis
Analysis of variance
The experimental data were subjected to analysis of variance to determine whether significant differences existed among the genotypes. The analysis was performed using replication means according to the procedure described by Goulden (1959), and significance was tested using the F-test.
Correlation coefficient analysis
Phenotypic, genotypic and environmental correlations among the characters were estimated following the procedure of Searle (1961). The resulting correlation coefficients were used to assess the magnitude and direction of the relationships between fruit yield per vine and the component traits.
Path coefficient analysis
Path analysis was performed according to the methods proposed by Wright (1921) and Dewey and Lu (1959). This approach was used to separate the correlation between each independent trait and fruit yield into direct and indirect effects. Standardized partial regression coefficients were obtained by solving the simultaneous equations through the Doolittle technique.
Results
Results
Phenotypic association with fruit yield
The analysis revealed positive and significant relationships between fruit yield per vine and several morphological and reproductive traits. At the phenotypic level, fruit yield showed a highly significant positive correlation with days to first male flower appearance (r = 0.548) and number of flowers per vine (r = 0.539). Positive associations were also recorded with days to first fruit harvest (r = 0.487), number of fruits per vine (r = 0.467), days to first fruit set (r = 0.421), number of branches per vine (r = 0.419), fruit weight (r = 0.387) and fruit diameter (r = 0.332). In addition, internodal length (r = 0.325) and fruit length (r = 0.325) were positively associated with fruit yield. The correlation table in the uploaded document confirms these phenotypic relationships. The positive relationships observed for flower number, fruit number, branching, fruit weight and fruit diameter indicate that these characteristics are associated with improved yield performance and may therefore be useful in the selection of high-yielding genotypes.
Genotypic association with fruit yield
The genotypic correlations were generally higher than the corresponding phenotypic correlations. Fruit yield per vine recorded highly significant positive relationships with number of flowers per vine (r = 0.679), number of fruits per vine (r = 0.623) and days to first male flower appearance (r = 0.619). Significant positive correlations were also obtained for days to first fruit set (r = 0.534), fruit weight (r = 0.506), days to first fruit harvest (r = 0.484), number of branches per vine (r = 0.436), internodal length (r = 0.427) and fruit diameter (r = 0.414). These values indicate that the genetic component of variation contributed substantially to the observed relationships between fruit yield and several yield-related traits.
Path coefficient analysis
Path coefficient analysis was employed to determine which traits contributed directly to fruit yield and which traits influenced yield indirectly through their relationships with other characters. The analysis demonstrated considerable variation in the magnitude and direction of direct effects among the traits. The number of flowers per vine recorded the highest positive direct effect (0.4110) on fruit yield. This was followed by days to first fruit harvest (0.3142), number of branches per vine (0.2713), days to first male flower appearance (0.2544) and fruit weight (0.2246). Other direct effects obtained from the phenotypic path analysis were: days to 50% germination -0.1617, days to first female flower appearance 0.0191, internodal length 0.1206, vine length -0.1656, days to first fruit set 0.0611, number of fruits per vine 0.2858, fruit diameter -0.0534, fruit length -0.1833, and duration of harvesting 0.0404. The residual effect was 0.0378, indicating that the characters included in the path analysis explained a large proportion of the variation associated with fruit yield.
Thus, the combined correlation and path analyses indicated that number of flowers per vine, number of fruits per vine, number of branches per vine and fruit weight deserve particular attention when selecting bitter gourd genotypes for higher fruit productivity.
Discussion
The significant differences observed among the evaluated genotypes indicate the presence of adequate variability for yield and related attributes. Such variability provides an important foundation for selecting promising genotypes and undertaking further breeding work. The correlation analysis demonstrated that fruit yield was favourably associated with several flowering, growth and fruit characteristics. In particular, number of flowers per vine, number of fruits per vine, number of branches per vine and fruit weight exhibited positive relationships with yield. This indicates that genotypes possessing favourable values for these traits may have greater potential for higher fruit productivity. The positive relationship between number of fruits per vine and fruit yield is particularly important because an increase in productive fruit number can directly increase cumulative yield. Likewise, fruit weight represents an important component of individual fruit productivity. Similar associations between yield and its component traits have been documented by Mahesh et al. (2014) [2] , Gupta et al. (2015) [7] , Khan et al. (2015) [3] , Yadagiri et al. (2017) [4] , Kumar et al. (2018) [5] , Sowmya et al. (2019) [8] and Triveni et al. (2021) [6] . An important feature of the present results was that genotypic correlations were generally stronger than phenotypic correlations. This suggests that the relationships among the characters were influenced considerably by genetic factors, while environmental variation reduced the observable magnitude of some associations. Comparable trends have been reported by Dubey et al. (2019) [9] and Sowmya et al. (2019) [8] . Path analysis provided additional information beyond the correlation coefficients. The number of flowers per vine had the greatest positive direct effect (0.4110), indicating that this character can be particularly valuable as a selection criterion. Days to first fruit harvest, number of branches per vine, days to first male flower appearance and fruit weight also showed appreciable positive direct contributions. The importance of fruit weight and fruit number as contributors to yield is consistent with the findings of Khan et al. (2015) [3] , who reported positive direct effects of average fruit weight, number of fruits per plant, days to male flowering and fruit length. Triveni et al. (2021) [6] similarly reported positive direct contributions of average fruit weight, number of fruits per vine and fruit length. The present findings therefore indicate that simultaneous consideration of correlation coefficients and direct effects can provide a more reliable basis for selecting superior bitter gourd genotypes than correlation analysis alone.
Conclusion
The evaluation of 20 bitter gourd genotypes demonstrated significant variation for the quantitative traits considered, indicating the availability of useful genetic diversity for crop improvement. Fruit yield per vine exhibited positive associations with several flowering, growth and fruit-related characteristics. Among these, number of flowers per vine, number of fruits per vine, days to first male flower appearance, days to first fruit set, number of branches per vine, fruit weight and fruit diameter showed particularly favourable relationships with yield at the phenotypic and/or genotypic levels. The genotypic correlations were generally stronger than the corresponding phenotypic associations, suggesting that genetic factors played an important role in determining these relationships. Path coefficient analysis identified number of flowers per vine (0.4110) as the trait with the largest positive direct effect on fruit yield. It was followed by days to first fruit harvest (0.3142), number of branches per vine (0.2713), days to first male flower appearance (0.2544) and fruit weight (0.2246). The phenotypic pathanalysis table in the uploaded document supports these direct-effect values. On the basis of the combined results, number of flowers per vine, number of fruits per vine, number of branches per vine and fruit weight can be given greater emphasis during selection for improving fruit yield in bitter gourd. These traits may therefore serve as useful selection criteria in future breeding programmes.
Figures and tables from the paper
| S. No. | Character | Phenotypic correlation (rₚ) | Genotypic correlation (rᵍ) |
|---|---|---|---|
| 1 | Days to 50% germination | 0.223 | 0.287 |
| 2 | Days to first male flower appearance | 0.548** | 0.619** |
| 3 | Days to first female flower appearance | 0.242 | 0.291 |
| 4 | Internodal length | 0.325* | 0.427** |
| 5 | Number of flowers per vine | 0.539** | 0.679** |
| 6 | Vine length | 0.056 | 0.045 |
| 7 | Number of branches per vine | 0.419** | 0.436** |
| 8 | Days to first fruit set | 0.421** | 0.534** |
| 9 | Number of fruits per vine | 0.467** | 0.623** |
| 10 | Fruit diameter | 0.332** | 0.414** |
| 11 | Fruit length | 0.325* | 0.326 |
| 12 | Fruit weight | 0.387** | 0.506** |
| 13 | Days to first fruit harvest | 0.487** | 0.484** |
| 14 | Duration of harvesting | -0.219 | -0.176 |
Table text extracted from the original PDF; superscript letters are shown inline. The original table image is below.
View original table image
References
9 in the original paper- Reddy TVK, Singh D. Genetic variability, heritability and correlation studies in bitter gourd (Momordica charantia L.). Journal of Pharmacognosy and Phytochemistry. 2019;8:2360-65.
- Mahesh M, Reddy RVSK, Saidaiah P. Correlation and path analysis in bitter gourd (Momordica charantia L.). Research Journal of Agricultural Sciences. 2014;5(5):894-897.
- Khan MH, Bhuiyan SR, Saha KC, Bhuyin MR, Ali ASMY. Variability, correlation and path co-efficient analysis of bitter gourd (Momordica charantia L.). Bangladesh Journal of Agricultural Research. 2015;40(4):607-618.
- Yadagiri J, Gupta NK, Tembhre D, Verma S. Genetic variability, correlation studies and path coefficient analysis in bitter gourd (Momordica charantia L.). Journal of Pharmacognosy and Phytochemistry. 2017;6(2):63-66.
- Kumar D, Kumar S, Meena ML, Meena RK, Kumar P. Correlation and characters association studies in bitter gourd (Momordica charantia L.). Journal of Pharmacognosy and Phytochemistry. 2018;7(2):3510-3514.
- Triveni D, Uma Jyothi K, Dorajee Rao AVD, Mamatha K, Uma Krishna K, Saloomi Suneetha DR. Correlation and path analysis for yield and yield contributing traits in bitter gourd (Momordica charantia L.). Vegetos. 2021;34(4):944-950.
- Gupta N, Bhardwaj ML, Singh SP, Sood S. Correlation and path analysis of yield and yield components in some genetic stocks of bitter gourd (Momordica charantia L.). Sabrao Journal of Breeding and Genetics. 2015;47(4):475-481.
- Sowmya HM, Kolakar SS, Lakshmana D, Nadukeri S, Srinivasa V, Jakkeral SA. Character association and path coefficient analysis in bitter gourd (Momordica charantia L.) genotypes. International Journal of Current Microbiology and Applied Sciences. 2019;8(5):2193-2197.
- Dubey S, Pandey AK. Study the Correlation Coefficient and Path Coefficient for the yield and yield Component of Bitter Gourd (Momordica charantia L.). International Journal of Current Microbiology and Applied Sciences. 2019;8(2):952-960.