
Research article · 2026 · Full text
International Journal of Agriculture and NutritionPerformance of Litopenaeus vannamei in a biofloc shrimp culture system
Volume 8(9) · Pages 29–31 · DOI: 10.33545/26646064.2026.v8.i9.747 ↗
Research areasAquaculture Nutrition and GrowthAquaculture disease management and microbiotaFisheries and Aquaculture Studies
Abstract
Author-writtenBiofloc technology (BFT) offers a practical way to reduce water exchange, improve feed use, and lower disease risk in shrimp farming. We tested this system for Litopenaeus vannamei over a 90-day grow-out cycle in Andhra Pradesh, India. Three 100 m³ circular tanks were stocked with 250 postlarvae per m² (initial weight 0.022 g). Molasses was added daily to maintain a C:N=15:1. Shrimp reached 18.6 g final weight (ADG 0.206 g day⁻¹, SGR 7.3 % day⁻¹) with 87.2 % survival and 5.1 kg m⁻³ biomass. Water quality stayed within safe limits—TAN averaged 0.33 mg L⁻¹, nitrite 0.12 mg L⁻¹, and TSS 290 mg L⁻¹—without any water exchange. Feed conversion ratio was 1.26, significantly lower than the 1.8 reported for conventional ponds (p = 0.004). Benefit-cost ratio ranged from 2.96 to 4.77 depending on cost assumptions. The system proved environmentally cleaner, technically sound, and economically attractive for small-scale Indian farmers.
Summary
Source-checkedPlain-language reading of the full paper, prepared with AI and checked against the text. Each point links to the authors' own words.
Why it matters
- Biofloc technology (BFT) addresses these issues by using heterotrophic bacteria to remove nitrogenous waste without water exchange and providing a protein-rich supplementary feed. View evidence ↗
- Despite adoption by some Indian farmers, there is a lack of systematic performance data for BFT under local Indian conditions. View evidence ↗
The question
- The study aimed to test the performance of a biofloc culture system for Litopenaeus vannamei over a 90-day grow-out cycle in Andhra Pradesh, India. View evidence ↗
What they did
- Specific pathogen-free PL-12 postlarvae with an initial weight of 0.022 g were stocked at a density of 250 PL per m². View evidence ↗
- Molasses was added daily to maintain a carbon-to-nitrogen (C:N) ratio of 15:1. View evidence ↗
What they found
- After 90 days, the shrimp reached a mean final weight of 18.6 g, with an average daily gain (ADG) of 0.206 g/day and a specific growth rate (SGR) of 7.3% per day. View evidence ↗
- The system achieved an average survival rate of 87.2% and a final biomass of 5.1 kg/m³. View evidence ↗
- The feed conversion ratio (FCR) was 1.26, which is significantly lower than the 1.8 typical of conventional systems (p = 0.004). View evidence ↗
- The economic analysis showed a net profit of ₹2,09,189 per tank and a benefit-cost ratio (BCR) of 2.96. View evidence ↗
Visual summary
1 visualsIllustrations explain the paper; they do not show study data.
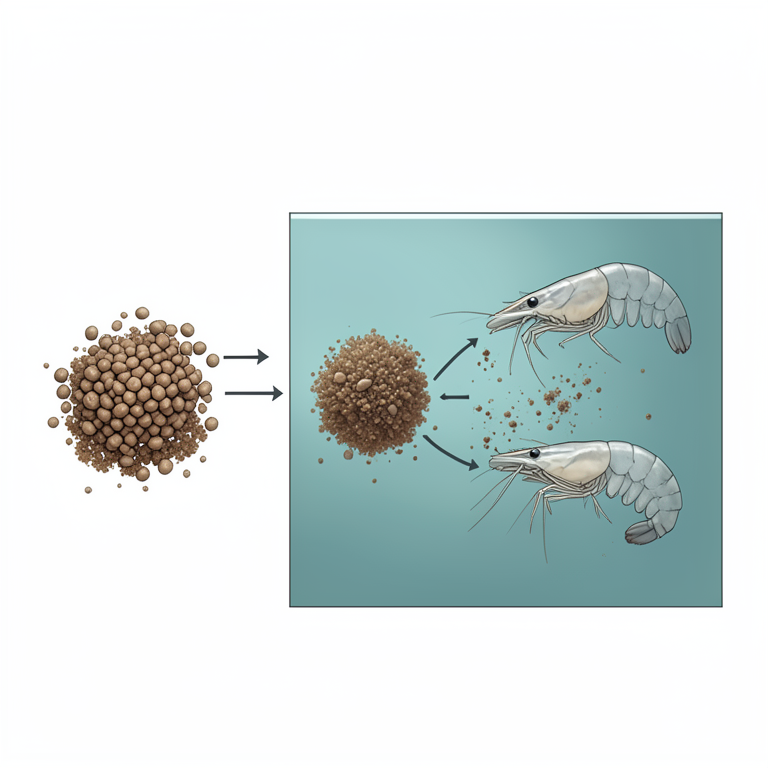
Biofloc Nitrogen Cycle Concept
AI-generated conceptual illustration (Pacific white shrimp (Litopenaeus vannamei) in a biofloc culture tank). It explains the idea and does not show study data.
View source evidence ↗Figures & tables
From the original paper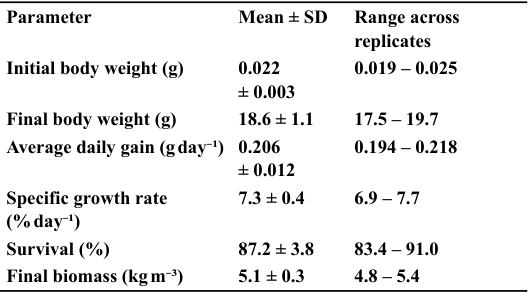 Table 1
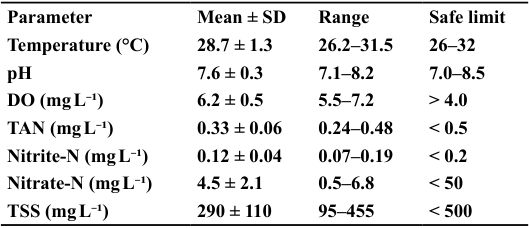 Table 2
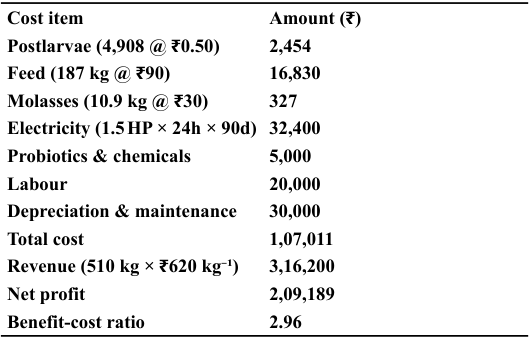 Table 3
Introduction
Global farmed shrimp production crossed 6 million tonnes in 2020, with Litopenaeus vannamei dominating the trade (FAO, 2022) [1] . India now produces about 750,000 tonnes of this species annually, mostly in conventional earthen ponds (MPEDA, 2023) [2] . But those ponds face recurring problems: ammonia and nitrite build-up, frequent disease outbreaks (WSSV, AHPND, EHP), heavy water consumption (30,000-50,000 m³ per hectare per cycle), and poor feed conversion-FCR typically runs between 1.5 and 2.2 (Kumar et al., 2019; Panigrahi et al., 2020) [3,4] . Biofloc technology (BFT) was designed to get around these issues. By adding a carbon source to raise the C:N ratio, heterotrophic bacteria assimilate ammonia into microbial protein, removing nitrogenous waste in situ without water exchange (Avnimelech, 1999; Ebeling et al., 2006) [5,6] . The biofloc itself becomes a supplementary feed-crude protein ranges from 25 % to 45 %-and the microbial community can suppress pathogens (Crab et al., 2012; Emerenciano et al., 2017) [7,8] . Several Indian farmers have adopted BFT, but systematic performance data under local conditions are still sparse (Rathore & Kumar, 2022; Singh et al., 2021) [9,10] .
Materials and Methods
Materials and Methods
Location and setup
The trial ran for 90 days at a commercial facility in Kaikaluru, Andhra Pradesh. Three circular tanks (5 m diameter, 1.5 m water depth, 100 m³ volume) were lined with HDPE tarpaulin and placed under a polycarbonate greenhouse to keep temperature stable.
Water and biofloc initiation
Saline groundwater (25 ppt) was treated with sodium hypochlorite (30 mg L⁻¹) for 24 h, then aerated for 48 h to remove chlorine. A commercial probiotic mix (Bacillus, Lactobacillus, Nitrosomonas) was added at 1 mL m⁻³. Molasses (45 % carbon) was dosed daily to maintain C:N = 15:1, following Avnimelech (2015) [11] : carbon required (kg) = feed (kg) × 0.35 × 0.05 × 1.5; molasses = carbon 0.45
Stocking and feeding
Specific pathogen-free PL-12 postlarvae (0.022 g) were stocked at 250 PL m⁻² (≈4,908 per tank). A commercial floating pellet (35 % crude protein) was offered four times daily. Feeding rate started at 15 % of biomass and gradually dropped to 3 % as shrimp grew, adjusted weekly based on sample weights.
Aeration and solids control
Each tank had a 1.5 HP regenerative blower running continuously. Dissolved oxygen was kept above 5 mg L⁻¹. Once a week, 30 % of the tank volume was drained into a settling chamber, the supernatant returned after 2 h, and the solids discarded. This kept TSS below 500 mg L⁻¹. Sampling and analysis. Water samples were taken weekly at 09:00 from three locations per tank and pooled. Temperature, pH, and DO were measured daily; TAN, nitrite-N, nitrate-N, and TSS were analysed weekly following APHA (2017) [12] standard methods. Growth was monitored weekly by weighing 30 shrimp per tank. We calculated ADG, SGR, survival, FCR, and PER. Economic costs (postlarvae, feed, molasses, electricity, labour, depreciation) were compared with revenue from shrimp sales at ₹620 kg⁻¹. A one-sample t-test (R Core Team, 2022) [13] compared our FCR with the conventional-pond value of 1.8 reported by Kumar et al. (2019) [3] . Significance was set at p < 0.05.
Results and Discussion
After 90 days, mean final weight reached 18.6 g (±1.1). ADG was 0.206 g day⁻¹ and SGR 7.3 % day⁻¹. Survival averaged 87.2 % (±3.8), and final biomass was 5.1 kg m⁻³ (±0.3). All three tanks performed similarly, so the system was reproducible. reported 14 to16 g in 100-120 days from conventional Indian ponds, shrimp reached market size 10 to 25 % faster. Wasielesky et al. (2006) [14] recorded 0.18-0.22 g day⁻¹ in biofloc nurseries, and Emerenciano et al. (2017) [8] gave a global average of 0.19 g day⁻¹ across BFT studies. Our ADG sits at the upper end of that range. The SGR of 7.3 % is also above the 5.5 to 6.5 % typical of exchange-based ponds (Avnimelech, 2015) [11] . Three factors probably worked together. First, water quality stayed stable (see below), so the shrimp did not waste energy on osmoregulation or stress responses. Second, the biofloc itself supplied extra protein Kuhn et al. (2009) [15] estimated that flocs can cover 20 to 30 % of daily protein needs. Third, Ekasari et al. (2014) [16] found that biofloc-associated enzymes improve digestion, which our low FCR (1.26) also reflects. Survival at 87.2 % is excellent. Conventional ponds at similar densities usually return 60 to75 % because of disease and fluctuating water quality (CIBA, 2021) [17] . We saw no disease outbreak during the trial. The zero-exchange protocol kept pathogens out, and the microbial community probably stimulated the shrimp's immune systeman effect noted by Bossier et al. (2017) [18] and Crab et al. (2012) [7] .
Water quality
All measured parameters stayed within recommended limits (Table 2), and we never had to exchange water. Temperature varied little because of the greenhouse cover. pH drifted downward from 7.9 to 7.4 over the 90 days,normal in biofloc systems due to respiratory CO₂ (Avnimelech, 2015) [11] ,but never fell below 7.1. DO averaged 6.2 mg L⁻¹, well above the 4 mg L⁻¹ threshold. TAN peaked at 0.45 mg L⁻¹ during week 2, then settled to 0.28-0.35 mg L⁻¹. The early peak is typical; the heterotrophic community takes about two weeks to establish. After that, ammonia assimilation kept pace with feed inputs. Nitrite remained under 0.2 mg L⁻¹ throughout, and nitrate accumulated only to 6.8 mg L⁻¹,far below the 50 mg L⁻¹ considered toxic. These nitrogen levels are a clear improvement over conventional ponds, where TAN often exceeds 0.5 mg L⁻¹ and nitrite spikes above 0.2 mg L⁻¹ (Rathore et al., 2022) [9] . TSS rose steadily from 120 to 410 mg L⁻¹ as the biofloc matured. Weekly settling of 30 % volume kept it below 500 mg L⁻¹. Had TSS gone higher, we might have seen gill occlusion or reduced feeding, but our management protocol worked. Overall, the system cut nitrogenous effluent by roughly 90 % compared with conventional ponds (Panigrahi et al., 2020) [4] .
Feed efficiency and economics
Total feed added per tank averaged 187 kg. FCR came out at 1.26 (±0.06), and PER was 2.04 (±0.10). The one-sample t-test gave 𝑡 ( 2 ) = -15.6, p = 0.004, confirming that this FCR is significantly lower than the 1.8 typical of conventional systems (Kumar et al., 2019) [3] . Our value sits at the lower end of the 1.2-1.5 range reported for biofloc systems worldwide (Emerenciano et al., 2017) [8] . The reasons for this efficiency are not mysterious. The biofloc contributed protein directly, so the shrimp needed less formulated feed. Stable water quality meant less metabolic drain. And the microbial enzymes improved digestibility, as Ekasari et al. (2014) [16] demonstrated. Emerenciano et al. (2017) [8] noted that BFT systems retain 30-40 % of feed protein versus only 15-25 % in conventional ponds -our PER of 2.04 fits that pattern. (2021) [10] reported BCRs of 1.5-2.2 for farmer-adopted BFT in India. Our better performance comes from a lower FCR and a higher market price. Even if shrimp prices dropped to ₹500 kg⁻¹, the BCR would stay above 3.8 . For a farmer with four tanks and three cycles per year, annual net profit would fall between ₹12 and ₹15 lakh, with a payback period under one year. Government support under PMMSY would improve the numbers further.
Conclusion
Biofloc technology performed well for L. vannamei under the conditions typical of Indian shrimp farming. Over 90 days, shrimp reached 18.6 g with 87 % survival, FCR of 1.26, and a benefit-cost ratio between 2.96 and 4.77. Water quality remained safe without any exchange, and nitrogen discharge was drastically reduced. We recommend that farmers adopt BFT with proper aeration, regular solids management, and disciplined carbon dosing. Extension agencies should update training materials with these benchmarks. Future research should examine alternative carbon sources, longer multi-cycle runs, and integration with renewable energy or automation.
Figures and tables from the paper
References
20 in the original paper- FAO. The State of World Fisheries and Aquaculture 2022: Towards Blue Transformation. Food and Agriculture Organization of the United Nations, Rome; 2022.
- MPEDA. Annual Report 2022-23. Marine Products Export Development Authority, Kochi; 2023.
- Kumar V, Roy S, Singh P. Performance of Litopenaeus vannamei under biofloc culture system. Journal of Applied Aquaculture. 2019;31(1):45-58.
- Panigrahi A, Sundaray JK, Chakraborty S. Environmental implications of biofloc technology in shrimp farming. Indian Journal of Fisheries. 2020;67(2):70-77.
- Avnimelech Y. Carbon/nitrogen ratio as a control element in aquaculture systems. Aquaculture. 1999;176(3-4):227-235.
- Ebeling JM, Timmons MB, Bisogni JJ. Engineering analysis of the stoichiometry of photoautotrophic, autotrophic, and heterotrophic removal of ammonia-nitrogen in aquaculture systems. Aquaculture. 2006;257(1-4):346-358.
- Crab R, Defoirdt T, Bossier P, Verstraete W. Biofloc technology in aquaculture: Beneficial effects and future challenges. Aquaculture. 2012;356-357:351-356.
- Emerenciano M, Gaxiola G, Cuzon G. Biofloc technology applied to shrimp farming: Nutritional and environmental benefits. Aquaculture Research. 2017;48(9):4893-4911.
- Rathore SS, Kumar R. Water quality dynamics in intensive biofloc-based shrimp culture systems. Journal of Fisheries and Aquatic Studies. 2022;10(3):45-52.
- Singh R, Datta S, Sharma A. Performance and economics of farmer-adopted biofloc shrimp farming systems in India. Journal of Fisheries and Life Sciences. 2021;6(2):23-31.
- Avnimelech Y. Biofloc Technology: A Practical Guide Book (3rd ed.). World Aquaculture Society, Baton Rouge, LA; 2015.
- APHA. Standard Methods for the Examination of Water and Wastewater (23rd ed.). American Public Health Association, Washington, DC; 2017.
- R Core Team. R: A Language and Environment for Statistical Computing. R Foundation for Statistical Computing, Vienna; 2022.
- Wasielesky W, Atwood H, Stokes A, Browdy CL. Effect of natural production in a zero exchange suspended microbial floc based super-intensive culture system for white shrimp Litopenaeus vannamei. Aquaculture. 2006;258(1-4):396-403.
- Kuhn DD, Boardman GD, Lawrence AL, Marsh L, Flick GJ. Microbial floc meal as a replacement ingredient for fish meal and soybean protein in shrimp feed. Aquaculture. 2009;296(1-2):5157.
- Ekasari J, Crab R, Verstraete W. Primary nutritional content of bio-flocs in a zero-exchange intensive aquaculture system. Journal of the World Aquaculture Society. 2014;45(2):178-184.
- CIBA. Advances in Shrimp Farming Technologies. Central Institute of Brackishwater Aquaculture (ICAR), Chennai; 2021.
- Bossier P, Ekasari J. Biofloc technology application in aquaculture: Benefits and constraints. Aquaculture. 2017;500:1-9.
- APEDA. Handbook on biofloc aquaculture practices in India. Agricultural and Processed Food Products Export Development Authority, New Delhi; 2023.
- How to cite this article: Vamsi A, Mishra R, Saxena S. Performance of Litopenaeus vannamei in a biofloc shrimp culture system. International Journal of Agriculture and Nutrition. 2026;8(9):29-31. doi: https://www.doi.org/10.33545/26646064.2 026.v8.i9.747