
Research article · 2026 · Full text
International Journal of Geography Geology and EnvironmentTemporal assessment of available NPK status in agricultural soils of Omerga Taluka, Maharashtra: A comparative study of 2022 and 2026
Volume 8(9) · Pages 116–121 · DOI: 10.22271/27067483.2026.v8.i9b.871 ↗
Research areasAgricultural Science and FertilizationPlant Growth and Agriculture TechniquesSoil Science and Environmental Management
Abstract
Author-writtenThe present Research paper aims to assess the temporal changes in the status of available Nitrogen (N), Phosphorus (P) and Potassium (K) in agricultural soils of Omerga taluka, Maharashtra, by comparing soil-test data from 2022 and 2026. The study is based on primary soil-testing data comprising 157 soil samples collected and analysed in 2022 and 64 samples analysed in 2026. The available N, P and K contents were classified into six fertility categories ranging from very low to very high, and their percentage distribution was comparatively assessed to identify changes in soil fertility status over the study period. The results reveal a considerable decline in available nitrogen status. The proportion of soils under very-low and low nitrogen categories increased from 64.90% in 2022 to 78.13% in 2026, indicating increasing nitrogen deficiency. Similarly, the proportion of soils classified as very-low and low in available phosphorus increased from 46.50% to 53.10%, while the very-low phosphorus category increased from 10.20% to 23.40%. In contrast, available potassium showed a marked increase, with the very-high category rising from 29.30% in 2022 to 92.18% in 2026. The findings indicate that nitrogen and phosphorus have emerged as important soil fertility concerns, whereas potassium is generally abundant and is unlikely to be a major limiting nutrient in the analysed soils. The study emphasizes the importance of periodic soil testing, soil-test-based fertilizer application, integrated nutrient management, organic matter incorporation and balanced nutrient management for maintaining sustainable soil fertility and improving nutrient-use efficiency in the study area.
Summary
Source-checkedPlain-language reading of the full paper, prepared with AI and checked against the text. Each point links to the authors' own words.
Why it matters
- Soil fertility, specifically the availability of macronutrients like Nitrogen, Phosphorus, and Potassium, is critical for sustainable crop production and overall plant health. View evidence ↗
- Nutrient availability in soil can change over time due to factors such as continuous cultivation and different nutrient management practices. View evidence ↗
- Regular soil fertility assessments are necessary to create nutrient management strategies that are balanced and specific to a particular site. View evidence ↗
The question
- The study aims to evaluate how the levels of available Nitrogen, Phosphorus, and Potassium in the agricultural soils of Omerga taluka, Maharashtra, changed between 2022 and 2026. View evidence ↗
What they did
- The research utilized primary soil-testing data from 157 samples collected in 2022 and 64 samples collected in 2026. View evidence ↗
- Topsoil samples were gathered from selected fields using a zigzag collection method and then mixed to create representative composite samples. View evidence ↗
- Available N, P, and K levels were categorized into six fertility classes, from very low to very high, to compare their percentage distributions over time. View evidence ↗
What they found
- Nitrogen deficiency increased over the study period, with the combined very-low and low nitrogen categories rising from 64.90% in 2022 to 78.13% in 2026. View evidence ↗
- Phosphorus availability also declined, as the combined very-low and low categories increased from 46.50% to 53.10%, and the very-low category specifically rose from 10.20% to 23.40%. View evidence ↗
- Available potassium increased significantly, with the proportion of soils in the very-high category jumping from 29.30% in 2022 to 92.18% in 2026. View evidence ↗
- There was a general shift toward lower nitrogen fertility, as the combined proportion of medium to very-high nitrogen soils fell from 35.00% in 2022 to 21.87% in 2026. View evidence ↗
- More than half of the soil samples analyzed in 2026 (53.10%) fell into the lower phosphorus fertility classes, compared to 46.50% in 2022. View evidence ↗
- The combined high and very-high potassium soil proportion increased from 63.10% in 2022 to 92.18% in 2026. View evidence ↗
What it means
- The authors conclude that while nitrogen and phosphorus are now significant fertility concerns in the area, potassium is abundant and unlikely to limit crop growth. View evidence ↗
- The authors recommend periodic soil testing and the adoption of integrated nutrient management, including organic matter incorporation, to maintain sustainable soil fertility. View evidence ↗
Visual summary
3 visualsIllustrations explain the paper; charts are replotted from the paper's own table values.
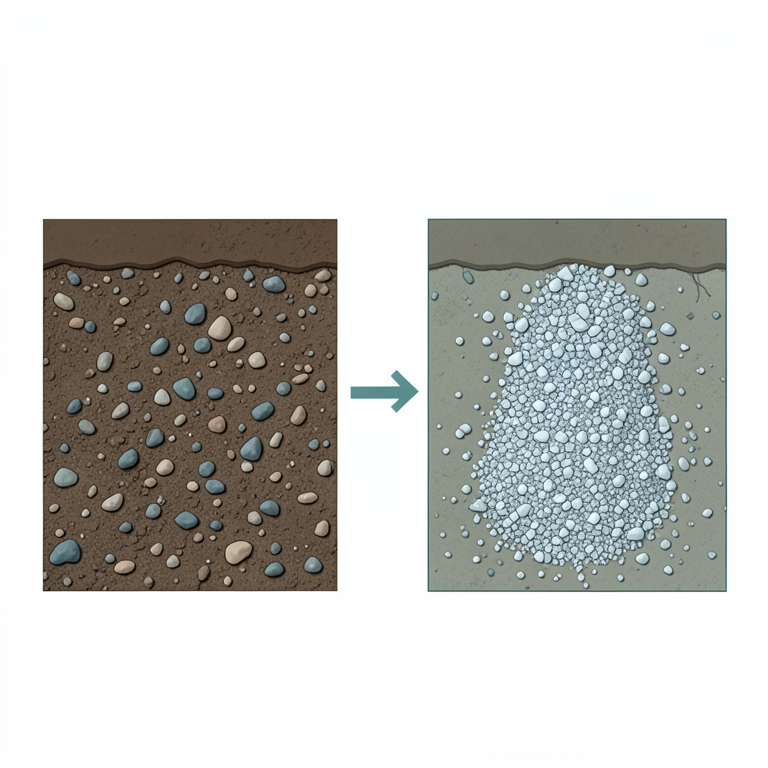
Nutrient Trend Comparison
AI-generated conceptual illustration (agricultural soil profiles from Maharashtra). It explains the idea and does not show study data.
View source evidence ↗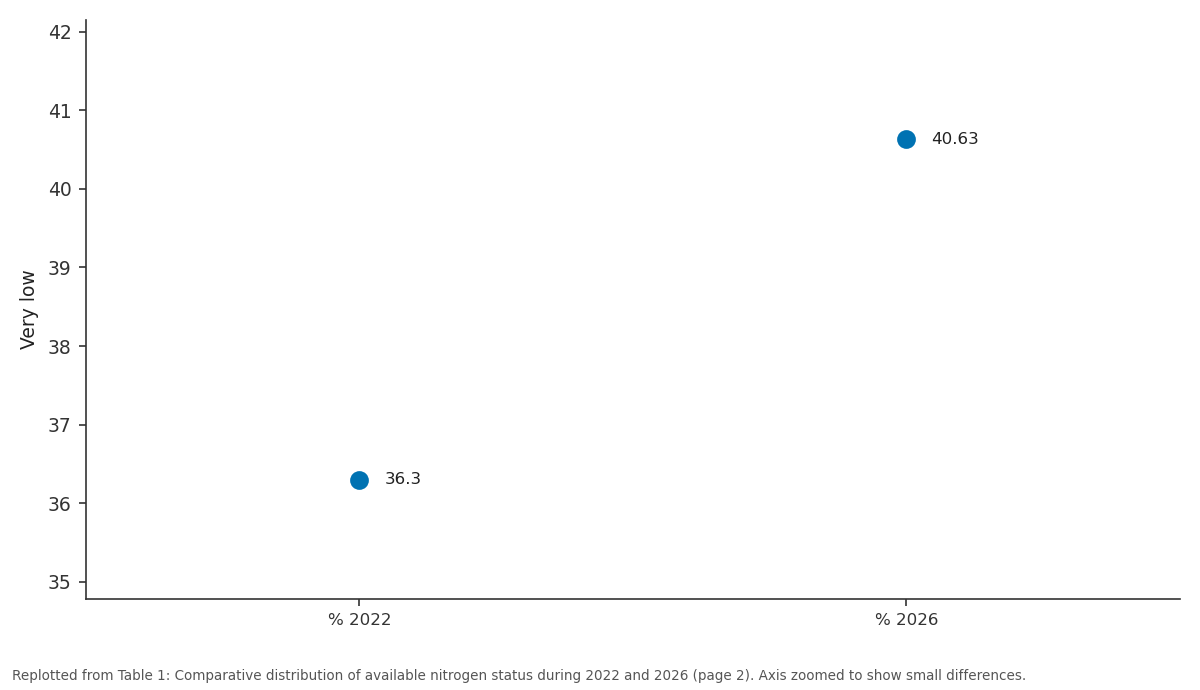
Very low: % 2022 vs % 2026
Replotted from Table 1 (page 2) of the original paper. Every bar is the paper's own table value.
View source evidence ↗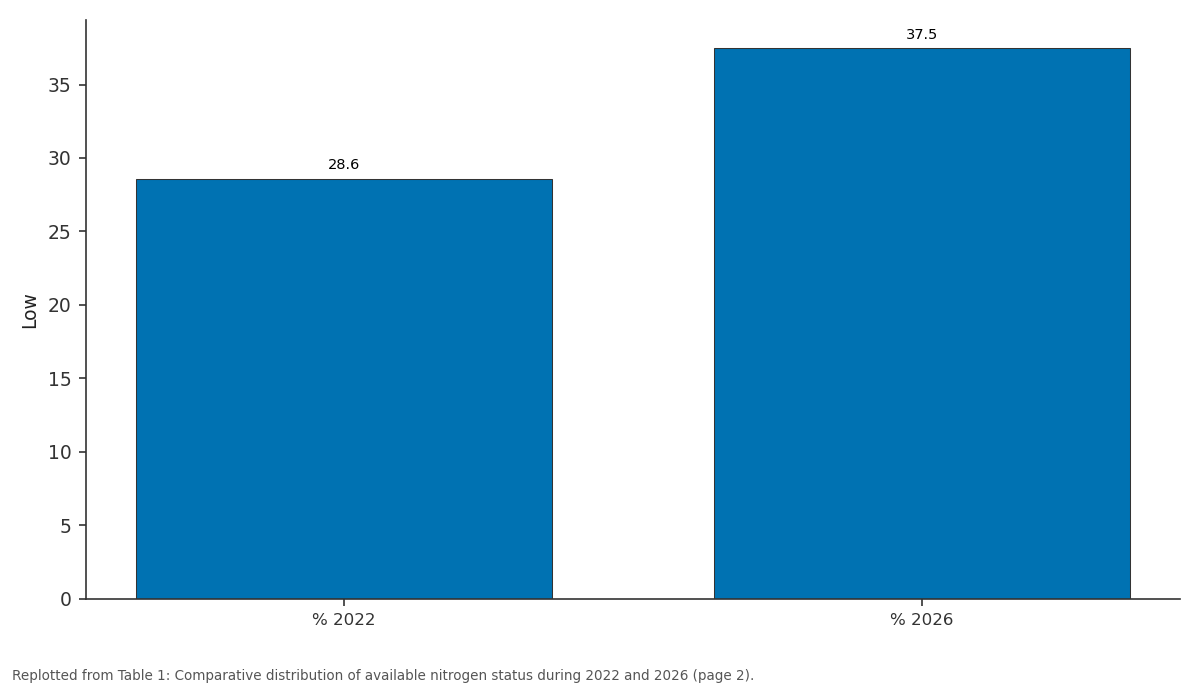
Low: % 2022 vs % 2026
Replotted from Table 1 (page 2) of the original paper. Every bar is the paper's own table value.
View source evidence ↗Figures & tables
From the original paper Table 1
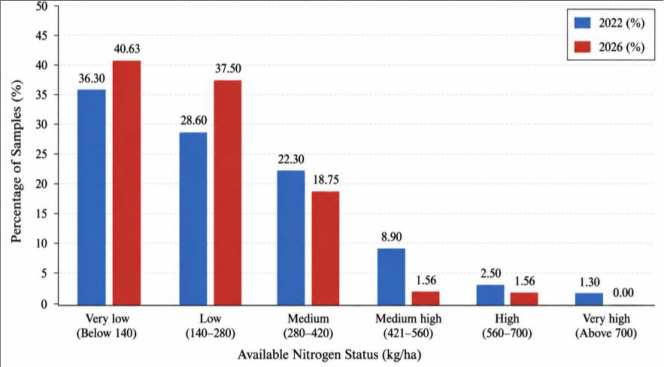 Figure 1
 Table 2
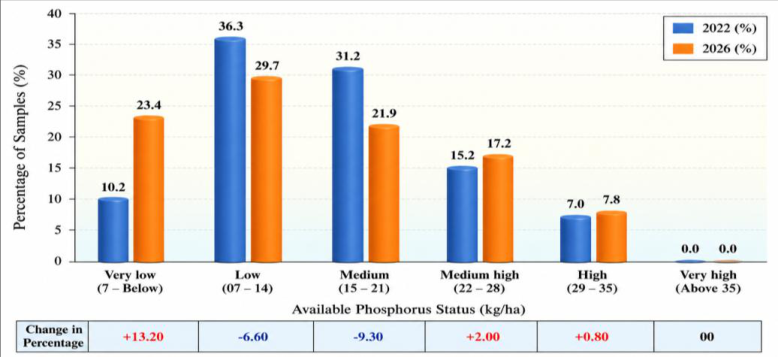 Figure 2
 Table 3
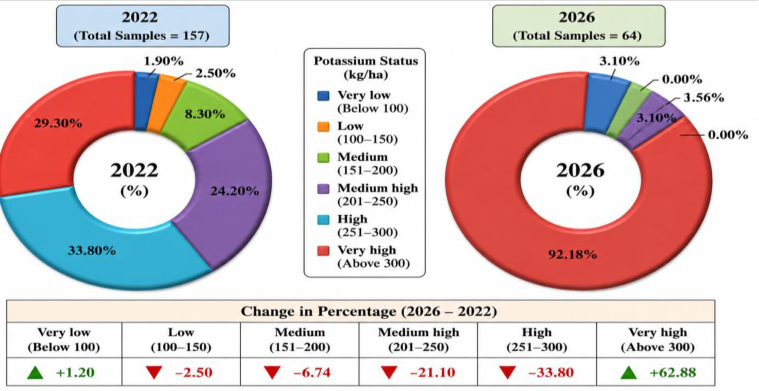 Figure 3
Introduction
Soil fertility is an important determinant of agricultural productivity and sustainable crop production. The availability of essential macronutrients such as Nitrogen (N), Phosphorus (P) and Potassium (K) plays a significant role in plant growth, yield and overall soil health. However, continuous cultivation and variations in nutrient management practices may lead to changes in the availability of these nutrients over time. Therefore, periodic assessment of soil fertility is essential for developing balanced and site-specific nutrient management strategies. The present study focuses on the agricultural soils of Omerga Taluka, Maharashtra, and comparatively assesses the available N, P and K status during 2022 and 2026. The study analyses changes in different nutrient-fertility categories and identifies the major shifts in soil nutrient availability. The comparative assessment is expected to provide useful insights for soil-test-based fertilizer recommendations, balanced nutrient management and sustainable agricultural development in the study area.
Study Area
Omerga taluka is located on the map to south east of Maharashtra. on the border of Maharashtra and Karnataka. The taluka of Omerga lies between 17°38' 32" North latitude to 18°02'10" north latitude and 76°24'30" east longitude to 76°47'17" east longitudes.it has a total area of 998.63 sq kms.omerga taluka is well inhabited and total population is 269519 in 01 urban centre and 96 villages. Objective 1. To assess the status of available Nitrogen (N), Phosphorus (P) and Potassium (K) in agricultural soils of Omerga Taluka during 2022 and 2026. 2. To compare the distribution of different NPK fertility categories between 2022 and 2026. 3. To identify the major changes in available N, P and K status during the study period. 4. To assess the implications of the observed changes in NPK status for soil fertility management in the study area.
Research Methodology and Data Collection
For this study, soil samples will be collected from selected agricultural fields in Omerga Taluka during the years 2022 and 2026. From each field, topsoil samples will be collected using the zigzag method, mixed thoroughly and prepared as representative composite samples. The samples will be shade-dried, cleaned to remove debris and sieved before laboratory analysis.
The available quantities of Nitrogen (N), Phosphorus (P) and Potassium (K) in the soil samples will be determined using standard laboratory methods. The obtained values will be compared with the relevant soil-fertility classes and classified into low, medium and high categories. A comparative presentation of the data from 2022 and 2026 will be prepared to determine changes in nutrient availability, percentage differences and major trends. Based on this analysis, graphs will be prepared to illustrate the variations and comparative trends in the availability of N, P and K during the study period.
Comparative Analysis of Available Phosphorus
The comparative assessment of available nitrogen (N) status was carried out using soil
Comparative Interpretation
The comparative analysis reveals a noticeable deterioration in the available nitrogen status of agricultural soils between 2022 and 2026. In 2022, 36.30% of the analysed soil samples were categorized as very low in available nitrogen. This proportion increased to 40.63% in 2026, representing an increase of 4.33 percentage points. The increase in the very-low nitrogen category indicates that a greater proportion of the sampled soils had inadequate available nitrogen during the later assessment period. A similar increasing trend was observed in the low nitrogen category. The proportion of samples classified as low increased from 28.60% in 2022 to 37.50% in 2026, showing an increase of 8.90 percentage points. This was the largest increase among all nitrogen-fertility classes. The combined proportion of soils falling under the very-low and low nitrogen categories increased from 64.90% in 2022 to 78.13% in 2026 This finding is particularly significant from an agricultural perspective. It indicates that nearly four-fifths of the analysed soil samples in 2026 were characterized by inadequate available nitrogen. Therefore, nitrogen deficiency appears to be an important soil fertility constraint in the study area. In contrast, the proportion of soils under the medium nitrogen category decreased from 22.30% in 2022 to 18.75% in 2026, a decline of 3.55 percentage points. A more substantial reduction was observed in the mediumhigh category, which declined from 8.90% to only 1.56%. The high nitrogen category also decreased from 2.50% to 1.56%. The very-high nitrogen category accounted for 1.30% of the samples in 2022, whereas no sample was recorded in this category in 2026. Thus, the proportion of soils having medium-high to very-high nitrogen status declined considerably during the period under comparison.
Overall Change in Nitrogen Fertility
The overall pattern indicates a shift from relatively better nitrogen availability towards lower nitrogen fertility status between 2022 and 2026. The proportion of soils belonging to the medium, medium-high, high and very-high categories collectively decreased from 35.00% in 2022 to 21.87% in 2026. Conversely, the combined very-low and low categories increased from 64.90% to 78.13%. The increase of approximately 13.23 percentage points in the combined low-fertility classes demonstrates a substantial deterioration in the nitrogen status of the sampled soils. Such a trend may be associated with continuous cultivation, intensive cropping, inadequate incorporation of organic matter, removal of crop residues, insufficient application of organic manures, and an imbalance between nutrient removal and nutrient replenishment. However, these possible causes should be interpreted cautiously unless supported by field-level information on fertilizer use, cropping intensity, organic manure application and crop yields.
Agricultural Implications
The observed increase in very-low and low available nitrogen classes has important implications for agricultural productivity and sustainable soil management. Nitrogen is one of the major macronutrients required for vegetative growth, chlorophyll formation, protein synthesis and yield development. A persistent deficiency of available nitrogen may adversely affect crop growth and productivity. The findings suggest the need for improved nitrogen management practices in the study area. Application of nitrogen fertilizers should preferably be based on soil-test results rather than uniform fertilizer recommendations. Split application of nitrogen, incorporation of farmyard manure and compost, use of crop residues, inclusion of leguminous crops in crop rotations, and adoption of integrated nutrient management practices may help improve nitrogen availability and maintain soil fertility. The results also emphasize the importance of periodic soil testing. Comparison of soil-test results over time can provide valuable information about changes in soil fertility and help farmers and agricultural agencies develop sitespecific nutrient-management strategies. The comparative assessment of available phosphorus (P) was carried out using soil-testing data obtained during 2022 and 2026. A total of 157 soil samples were analysed in 2022, whereas 64 soil samples were analysed in 2026. The available phosphorus status was classified into six categories: very low, low, medium, medium high, high and very high.
Comparative Analysis of Available Phosphorus
Comparative Analysis of Available Phosphorus
Comparative Interpretation
The comparative analysis of available phosphorus indicates a noticeable change in the phosphorus status of the sampled agricultural soils between 2022 and 2026. In 2022, 10.20% of the analysed soil samples were classified under the verylow phosphorus category. This proportion increased substantially to 23.40% in 2026, representing an increase of 13.20 percentage points. In contrast, the proportion of samples under the low phosphorus category declined from 36.30% in 2022 to 29.70% in 2026, showing a decrease of 6.60 percentage points. Similarly, the medium phosphorus category decreased from 31.20% in 2022 to 21.90% in 2026, indicating a decline of 9.30 percentage points. The combined proportion of very-low and low phosphorus soils was 46.50% in 2022 and increased to 53.10% in 2026.Thus the proportion of soils falling within the lower phosphorus fertility classes increased by 6.60 percentage points during the study period. This indicates a gradual shift towards lower phosphorus availability in a considerable proportion of the sampled soils.
Changes in Medium and Higher Phosphorus Categories
The proportion of soils under the medium category declined considerably from 31.20% in 2022 to 21.90% in 2026. However, the medium-high category increased slightly from 15.20% to 17.20%, while the high category increased from 7.00% to 7.80%. No soil sample was recorded in the very-high phosphorus category during either assessment year. Therefore, the study area did not show any significant representation of soils with very-high available phosphorus status. The decline in the medium phosphorus category, together with the increase in the very-low category, suggests a shift in the distribution of available phosphorus towards the lower fertility classes.
Overall Assessment
The comparative findings demonstrate that the phosphorus status of the analysed soils underwent a noticeable change between 2022 and 2026. The proportion of very-low phosphorus soils more than doubled, increasing from 10.20% to 23.40%. At the same time, the proportion of medium phosphorus soils declined from 31.20% to 21.90%.The increase in the combined very-low and low phosphorus categories from 46.50% to 53.10% is particularly important from the perspective of soil fertility management. It indicates that more than half of the soil samples analysed in 2026 belonged to the lower phosphorus fertility classes. Phosphorus is an essential macronutrient involved in root development, energy transfer, flowering, seed formation and crop maturity. The increasing proportion of soils with very-low and low available phosphorus indicates the need for appropriate phosphorus management in the study area. Source: Compiled and analysed by the researcher based on primary soil testing data collected during field investigations, 2022 and 2026. The comparative assessment of available potassium (K) was carried out using soil-testing data collected during 2022 and 2026. A total of 157 soil samples were analysed in 2022, while 64 soil samples were analysed in 2026. The available potassium status was classified into six categories: very low, low, medium, medium high, high and very high.
Comparative Analysis of Available Potassium
Comparative Analysis of Available Potassium
Comparative Interpretation
The comparative analysis reveals a substantial improvement in the available potassium status of the sampled agricultural soils between 2022 and 2026. The most prominent change was observed in the very-high potassium category. In 2022, 29.30% of the analysed soil samples were classified as very high in available potassium. This proportion increased sharply to 92.18% in 2026, representing an increase of 62.88 percentage points. Thus, the majority of the soil samples analysed in 2026 belonged to the very-high potassium category. A decline was observed in almost all the remaining potassium-fertility categories. The medium category decreased from 8.30% in 2022 to 1.56% in 2026. Similarly, the medium-high category declined substantially from 24.20% to 3.10%.The high potassium category accounted for 33.80% of the samples in 2022, whereas no sample was recorded in this category in 2026. The low potassium category also declined from 2.50% in 2022 to zero in 2026.
Change in Higher Potassium Fertility Classes
The combined proportion of soils classified as high and very high in available potassium was 63.10% in 2022 (33.80% high + 29.30% very high). In 2026, the corresponding proportion increased to 92.18%, as all 59 samples falling in the higher category were classified as very high. This represents an increase of 29.08 percentage points in the combined high and very-high potassium classes. The sharp increase in the very-high potassium category indicates that potassium is generally not a major limiting nutrient in the analysed soils. Rather, the soils show a strong tendency towards potassium abundance.
Low and Medium Potassium Status
The combined proportion of very-low and low potassium samples was 4.40% in 2022, comprising 1.90% very low and 2.50% low. In 2026, the corresponding proportion was only 3.10%, with 2 samples classified as very low and no sample classified as low. The medium and medium-high categories also showed a considerable decline. Their combined proportion decreased from 32.50% in 2022 to 4.66% in 2026. These changes further demonstrate the shift in the distribution of available potassium towards the very-high category.
Overall Assessment
The temporal comparison demonstrates a pronounced increase in available potassium in the sampled agricultural soils between 2022 and 2026. The most significant finding is the increase in the very-high potassium category from 29.30% to 92.18%.Unlike nitrogen and phosphorus, where a considerable proportion of samples may fall within low or very-low fertility classes potassium does not appear to be a major fertility constraint in the analysed samples. The very high proportion of potassium-rich soils suggests that indiscriminate application of potassium fertilizers may not be necessary in most parts of the study area. However, fertilizer recommendations should always be based on soiltest results, crop requirements and field-specific conditions rather than on generalized assumptions. Potassium plays an important role in plant water regulation, enzyme activation, disease resistance, photosynthesis and overall crop quality. Although potassium is essential for crop production, excessive or unnecessary application of potassium fertilizers in soils already having very-high available potassium may not provide additional agronomic benefits and may increase production costs.
Conclusion
Conclusion
Figures and tables from the paper
| Sr. No. | Available Nitrogen | Nitrogen Range KG/ Ha. | No.of Samples 2022 | % 2022 | No.of Samples 2026 | % 2026 | Change in Percentage |
|---|---|---|---|---|---|---|---|
| 1 | Very low | Below 140 | 57 | 36.3 | 26 | 40.63 | +4.33 |
| 2 | Low | 140-280 | 45 | 28.6 | 24 | 37.50 | +8.90 |
| 3 | Medium | 280-420 | 35 | 22.3 | 12 | 18.75 | -3.55 |
| 4 | Medium high | 421-560 | 14 | 8.9 | 01 | 1.56 | -7.34 |
| 5 | High | 560-700 | 04 | 2.5 | 01 | 1.56 | -0.94 |
| 6 | Very high | Above 700 | 02 | 1.3 | - | - | -1.30 |
Table text extracted from the original PDF; superscript letters are shown inline. The original table image is below.
View original table image
References
5 in the original paper- Shah K. Analysis of soil samples for its physicochemical parameters. 2017 Jul.
- Department of Agriculture & Cooperation, Ministry of Agriculture, Government of India. Soil testing in India: methods manual. 2011 Jan.
- Bhatt R. Importance of soil testing and techniques of soil sampling. 2014 Aug.
- Tolanur S. Fundamentals of soil science. 2018.
- Joshi PM. Soil testing and use of fertilizers. Nagpur: Payal Prakashan; 1974.