
Research article · 2026 · Full text
International Journal of Biology SciencesAssessment of Genetic Variability, Character Association, and Path Analysis in Mungbean (Vigna radiata L. Wilczek) Genotypes
Volume 8(9) · Pages 37–40 · DOI: 10.33545/26649926.2026.v8.i9a.988 ↗
Research areasGenetics and Plant BreedingGenetic and Environmental Crop StudiesAgricultural Practices and Plant Genetics
Abstract
Author-writtenhe present investigation was carried out to evaluate genetic variability, character associations, and path coefficients for seed yield and its component traits among eight mungbean (Vigna radiata L. Wilczek) genotypes. The field experiment was conducted in a Randomized Block Design (RBD) with three replications during the Kharif 2025 season at the Research Farm of G H Raisoni University, Saikheda. Analysis of variance (ANOVA) indicated significant genetic differences (P < 0.01) among all genotypes for nine quantitative characters studied. High phenotypic coefficient of variation (PCV) and genotypic coefficient of variation (GCV) were recorded for seed yield per plant (31.30% & 31.05%), 1000-seed weight (25.34% & 25.25%), and number of primary branches per plant (19.67% & 18.31%). High broad-sense heritability coupled with high genetic advance as percentage of mean (GAM) was recorded for seed yield per plant (98.43%, 63.46%), 1000-seed weight (99.33%, 51.85%), number of pods per plant (99.34%, 55.62%), and number of seeds per pod (92.37%, 33.38%), demonstrating the predominance of additive gene action. Correlation analysis revealed that seed yield per plant exhibited a highly significant positive association with number of seeds per pod (rg = 0.878), primary branches per plant (rg = 0.872), pod length (rg = 0.736), leaves per plant (rg = 0.697), pods per plant (rg = 0.658), and 1000-seed weight (rg = 0.541). Path coefficient analysis demonstrated that number of seeds per pod (0.689), pods per plant (0.435), and leaves per plant (0.338) had maximum direct positive contributions toward seed yield. Genetic divergence analysis grouped the eight genotypes into four distinct clusters. High inter-cluster distance was recorded between G1 and G6 (D2 = 1.288), suggesting that crossing these entries could generate desirable recombinants in future breeding programs.
Summary
Source-checkedPlain-language reading of the full paper, prepared with AI and checked against the text. Each point links to the authors' own words.
Why it matters
- Mungbean is a critical pulse crop in India, valued for its nutritional content and ability to fix nitrogen in the soil. View evidence ↗
- Current mungbean productivity is low relative to its potential yield, necessitating breeding improvements. View evidence ↗
- Because direct selection for seed yield is often ineffective, breeders focus on yield-contributing traits with high heritability and genetic variability. View evidence ↗
The question
- The study aimed to evaluate genetic parameters, trait associations, and genetic divergence across eight mungbean genotypes to guide future breeding. View evidence ↗
What they did
- The research was conducted during the Kharif season at G H Raisoni University's research farm in Saikheda, India. View evidence ↗
- The study used eight elite mungbean genotypes (G1 through G8) sourced from the Agriculture Research Station in Badnapur. View evidence ↗
- The experiment employed a Randomized Block Design (RBD) with three replications. View evidence ↗
- Nine quantitative traits, including seed yield and pod characteristics, were measured on ten randomly selected plants per genotype per replication. View evidence ↗
What they found
- ANOVA showed highly significant genetic differences (P < 0.01) among all eight genotypes for all nine studied traits. View evidence ↗
- High PCV and GCV were observed for seed yield per plant (31.30% and 31.05%), 1000-seed weight (25.34% and 25.25%), and primary branches per plant (19.67% and 18.31%). View evidence ↗
- Seed yield per plant, 1000-seed weight, pods per plant, and seeds per pod showed high heritability and high genetic advance, suggesting additive gene action. View evidence ↗
- Seed yield per plant had highly significant positive genotypic correlations with several traits, most strongly with seeds per pod (rg = 0.878) and primary branches per plant (rg = 0.872). View evidence ↗
- Path analysis identified seeds per pod (0.689) as having the highest direct positive effect on seed yield, followed by pods per plant (0.435) and leaves per plant (0.338). View evidence ↗
- The eight genotypes were divided into four clusters, with the greatest genetic distance found between G1 and G6 (D2 = 1.288). View evidence ↗
What it means
- The authors recommend using direct phenotypic selection of component traits to improve seed yield. View evidence ↗
- Hybridization between genotypes from Cluster I and Cluster II is suggested to create superior recombinants through heterosis. View evidence ↗
Visual summary
3 visualsIllustrations explain the paper; charts are replotted from the paper's own table values.
Direct Effects on Seed Yield
AI-generated conceptual illustration (mungbean plants (Vigna radiata)). It explains the idea and does not show study data.
View source evidence ↗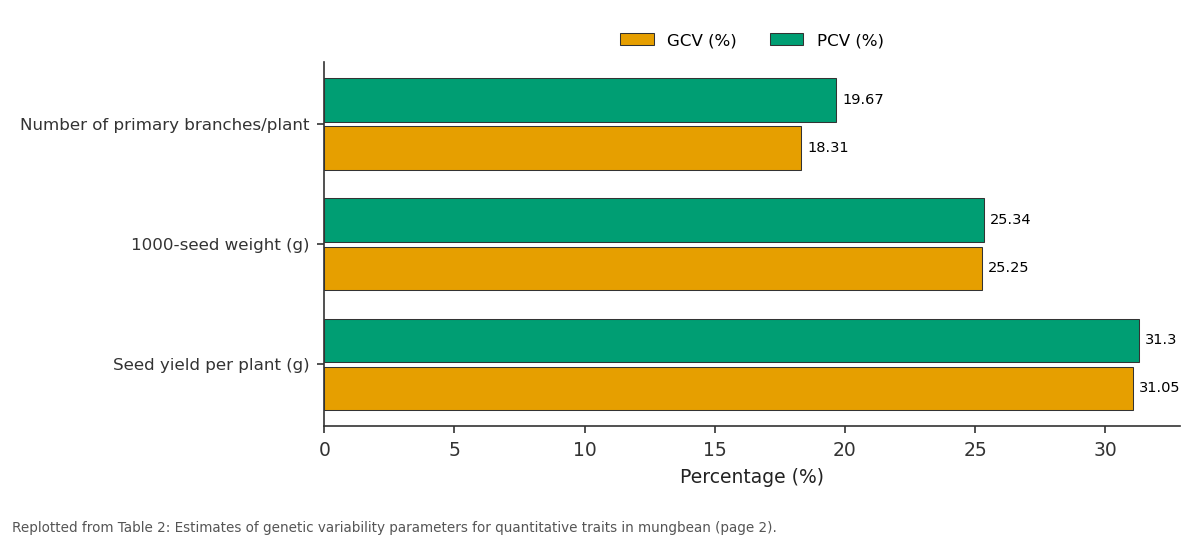
GCV (%) and PCV (%): Number of primary... vs 1000-seed weight (g) vs Seed yield per plant (g)
Replotted from Table 2 (page 2) of the original paper. Every bar is the paper's own table value.
View source evidence ↗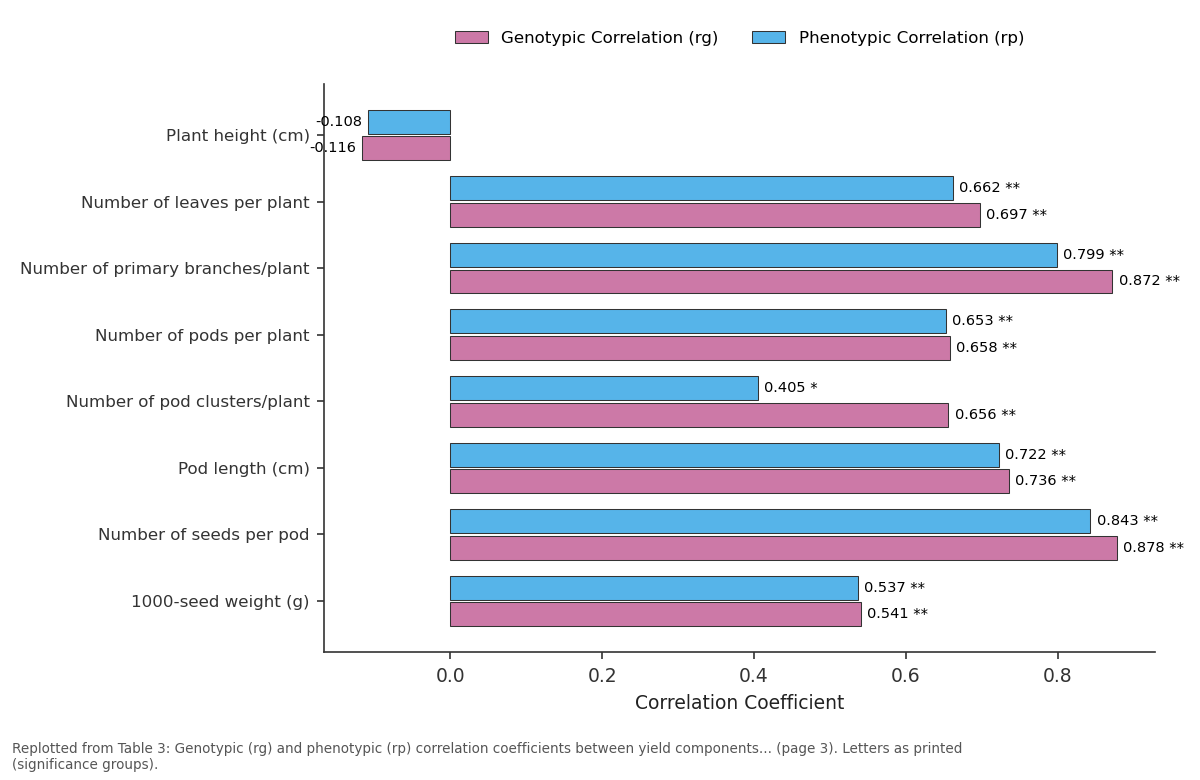
Genotypic Correlation (rg) and Phenotypic Correlation (rp): Plant height (cm) vs Number of leaves per... vs Number of primary... vs Number of pods per plant vs Number of pod...
Replotted from Table 3 (page 3) of the original paper. Every bar is the paper's own table value.
View source evidence ↗Figures & tables
From the original paper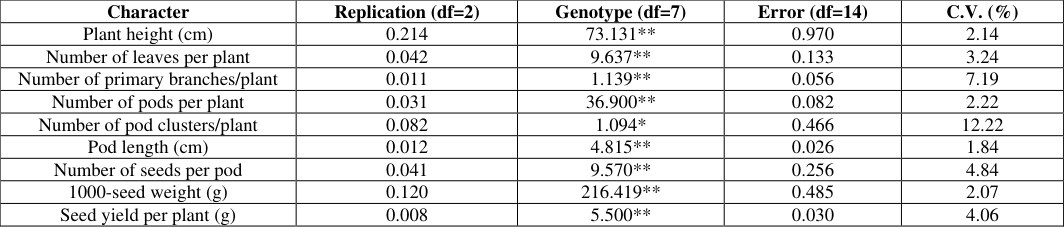 Table 1
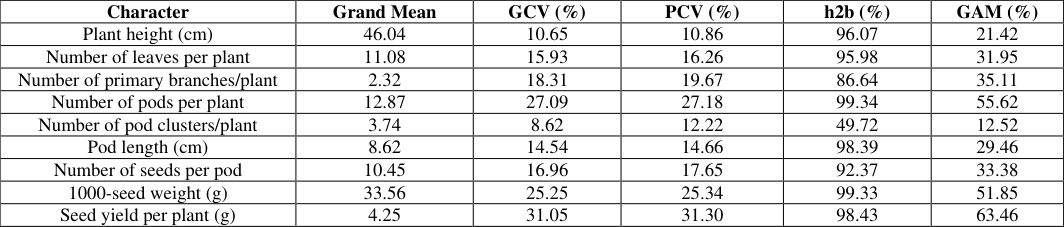 Table 2
 Table 3
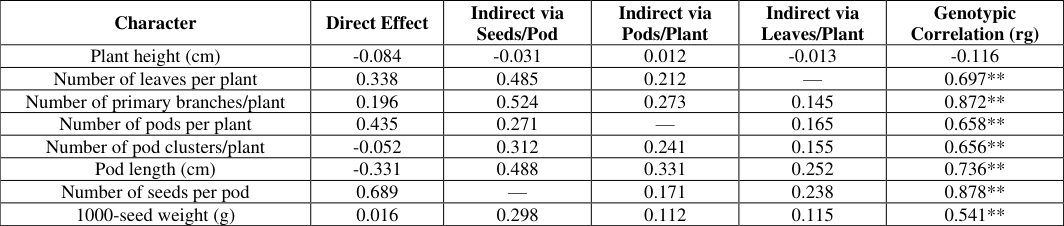 Table 4
Introduction
Mungbean [Vigna radiata (L.) Wilczek, 2n = 22] is one of the most vital pulse crops grown in India. Belonging to the family Fabaceae, it is widely recognized for its high nutritional value, short growth duration (55-70 days), and ability to improve soil fertility through biological nitrogen fixation. Mungbean seeds contain approximately 24-27% protein, rich quantities of essential amino acids (specifically lysine), dietary fiber, and essential minerals such as iron and zinc. Because of its easy digestibility, it forms a major part of the vegetarian diet in South Asia. Despite its agronomic importance, average mungbean productivity remains low compared to its yield potential. Yield is a complex quantitative trait governed by polygenes and strongly influenced by environmental fluctuations. Direct selection for seed yield per se often yields poor results due to low direct heritability. Therefore, selection should be based on yield-contributing characters that demonstrate high genetic variability, high heritability, and positive correlations with yield. Estimation of genetic variability parameters-such as Phenotypic Coefficient of Variation (PCV), Genotypic Coefficient of Variation (GCV), Heritability (h2b), and Genetic Advance (GA)-provides essential insights into the nature of gene action governing various quantitative traits. Furthermore, correlation coefficient analysis helps plant breeders understand the strength and direction of associations among traits, while path coefficient analysis partitions correlation coefficients into direct and
Experimental Design and Layout
The trial was evaluated in a Randomized Block Design (RBD) with three replications. Each genotype was sown in rows spaced 30 cm apart with an intra-row plant spacing of 10 cm. Standard recommended agronomic practices and plant protection measures were adopted uniformly to ensure a healthy crop stand.
Data Collection
Observations were recorded on ten randomly chosen, competitive plants per genotype per replication for nine quantitative traits: Plant height (cm), Number of leaves per plant, Number of primary branches per plant, Number of pods per plant, Number of pod clusters per plant, Pod length (cm), Number of seeds per pod, 1000-seed weight (g), and Seed yield per plant (g).
Statistical Analysis
The collected data were subjected to Analysis of Variance (ANOVA) as per standard statistical procedures (Panse and Sukhatme, 1985) [10] Genotypic and phenotypic coefficients of variation were estimated following Burton and DeVane (1953). Broad-sense heritability (h2b) and genetic advance as percentage of mean (GAM) were calculated according to Johnson et al. (1955) [7] . Genotypic and phenotypic correlation coefficients were computed per Al-Jibouri et al.
(1958) [2] , and path coefficient analysis was conducted following Dewey and Lu (1959) [5] . Genetic divergence was evaluated using Mahalanobis D2 statistic and Principal Component Analysis.
Results and Discussion
Results and Discussion
Analysis of Variance (ANOVA) and Mean Performance
The analysis of variance (ANOVA) indicated highly significant differences (P < 0.01) among all eight mungbean genotypes for the nine quantitative traits evaluated (Table 1). This confirms the presence of substantial genetic variability in the material, providing good scope for selection. Genotype G4 exhibited the highest mean plant height (56.23 cm), while G6 recorded the maximum pod length (10.57 cm) and 1000-seed weight (51.67 g). The highest number of pods per plant was observed in G8 (18.53) followed by G7 (18.33).
| Character | Replication (df=2) | Genotype (df=7) | Error (df=14) | C.V. (%) |
|---|---|---|---|---|
| Plant height (cm) | 0.214 | 73.131** | 0.970 | 2.14 |
| Number of leaves per plant | 0.042 | 9.637** | 0.133 | 3.24 |
| Number of primary branches/plant | 0.011 | 1.139** | 0.056 | 7.19 |
| Number of pods per plant | 0.031 | 36.900** | 0.082 | 2.22 |
| Number of pod clusters/plant | 0.082 | 1.094* | 0.466 | 12.22 |
| Pod length (cm) | 0.012 | 4.815** | 0.026 | 1.84 |
| Number of seeds per pod | 0.041 | 9.570** | 0.256 | 4.84 |
| 1000-seed weight (g) | 0.120 | 216.419** | 0.485 | 2.07 |
| Seed yield per plant (g) | 0.008 | 5.500** | 0.030 | 4.06 |
Table text extracted from the original PDF; superscript letters are shown inline. The original table image is below.
View original table image
Estimation of Genetic Variability Parameters
For all studied traits, the phenotypic variance (σ2p) and phenotypic coefficient of variation (PCV) were slightly higher than genotypic variance (σ2g) and genotypic coefficient of variation (GCV), indicating a low environmental influence on trait expression (Table 2). [7] , traits showing high heritability accompanied by high genetic advance are controlled primarily by additive gene action, indicating that direct phenotypic selection will be effective.
| Character | Grand Mean | GCV (%) | PCV (%) | h2b (%) | GAM (%) |
|---|---|---|---|---|---|
| Plant height (cm) | 46.04 | 10.65 | 10.86 | 96.07 | 21.42 |
| Number of leaves per plant | 11.08 | 15.93 | 16.26 | 95.98 | 31.95 |
| Number of primary branches/plant | 2.32 | 18.31 | 19.67 | 86.64 | 35.11 |
| Number of pods per plant | 12.87 | 27.09 | 27.18 | 99.34 | 55.62 |
| Number of pod clusters/plant | 3.74 | 8.62 | 12.22 | 49.72 | 12.52 |
| Pod length (cm) | 8.62 | 14.54 | 14.66 | 98.39 | 29.46 |
| Number of seeds per pod | 10.45 | 16.96 | 17.65 | 92.37 | 33.38 |
| 1000-seed weight (g) | 33.56 | 25.25 | 25.34 | 99.33 | 51.85 |
| Seed yield per plant (g) | 4.25 | 31.05 | 31.30 | 98.43 | 63.46 |
Table text extracted from the original PDF; superscript letters are shown inline. The original table image is below.
View original table image
Correlation Coefficient Analysis
Genotypic correlation coefficients (rg) were generally higher than phenotypic correlation coefficients (rp), confirming inherent genetic associations among characters (Table 3). Seed yield per plant exhibited highly significant positive genotypic and phenotypic correlations with number of seeds per pod (rg = 0.878), primary branches per plant (rg = 0.872), pod length (rg = 0.736), number of leaves per plant (rg = 0.697), pods per plant (rg = 0.658), pod clusters per plant (rg = 0.656), and 1000-seed weight (rg = 0.541). This indicates that selection for these traits will lead to simultaneous enhancement in seed yield.
| Character | Genotypic Correlation (rg) | Phenotypic Correlation (rp) |
|---|---|---|
| Plant height (cm) | -0.116 | -0.108 |
| Number of leaves per plant | 0.697** | 0.662** |
| Number of primary branches/plant | 0.872** | 0.799** |
| Number of pods per plant | 0.658** | 0.653** |
| Number of pod clusters/plant | 0.656** | 0.405* |
| Pod length (cm) | 0.736** | 0.722** |
| Number of seeds per pod | 0.878** | 0.843** |
| 1000-seed weight (g) | 0.541** | 0.537** |
Table text extracted from the original PDF; superscript letters are shown inline. The original table image is below.
View original table image
Path Coefficient Analysis
Path coefficient analysis partitioned genotypic correlation coefficients into direct and indirect effects to evaluate the true contribution of each trait to seed yield (Table 4). The highest positive direct effect on seed yield was recorded for number of seeds per pod (0.689), followed by number of pods per plant (0.435), leaves per plant (0.338), and primary branches per plant (0.196). Pod length had a direct negative effect (-0.331) but maintained a high positive correlation with yield due to positive indirect contributions through seeds per pod (0.488) and pods per plant (0.331). The low residual effect (R = 0.106) confirms that the selected traits accounted for 89.4% of total variation in seed yield.
| Character | Direct Effect | Indirect via Seeds/Pod | Indirect via Pods/Plant | Indirect via Leaves/Plant | Genotypic Correlation (rg) |
|---|---|---|---|---|---|
| Plant height (cm) | -0.084 | -0.031 | 0.012 | -0.013 | -0.116 |
| Number of leaves per plant | 0.338 | 0.485 | 0.212 | — | 0.697** |
| Number of primary branches/plant | 0.196 | 0.524 | 0.273 | 0.145 | 0.872** |
| Number of pods per plant | 0.435 | 0.271 | — | 0.165 | 0.658** |
| Number of pod clusters/plant | -0.052 | 0.312 | 0.241 | 0.155 | 0.656** |
| Pod length (cm) | -0.331 | 0.488 | 0.331 | 0.252 | 0.736** |
| Number of seeds per pod | 0.689 | — | 0.171 | 0.238 | 0.878** |
| 1000-seed weight (g) | 0.016 | 0.298 | 0.112 | 0.115 | 0.541** |
Table text extracted from the original PDF; superscript letters are shown inline. The original table image is below.
View original table image
Genetic Divergence Analysis (D2 and PCA)
Mahalanobis D2 cluster analysis grouped the eight genotypes into four distinct clusters: Cluster I (G1, G2, G3, G4), Cluster II (G6, G7), Cluster III (G5), and Cluster IV (G8). The maximum inter-genotypic distance was observed between G1 and G6 (D2 = 1.288), followed by G2 and G6 (D2 = 1.270). Principal Component Analysis (PCA) revealed that the first four principal components contributed 89.82% of the cumulative genetic variance (PC1 = 57.45%, PC2 = 14.09%, PC3 = 10.03%, PC4 = 8.25%).
Conclusion
The current study demonstrates substantial genetic variability among the evaluated mungbean genotypes. High heritability coupled with high genetic advance as percentage of mean was observed for seed yield per plant, 1000-seed weight, number of pods per plant, and number of seeds per pod, indicating additive gene action. Character association and path analysis identified number of seeds per pod, number of pods per plant, and primary branches per plant as primary direct yield determinants. Therefore, direct phenotypic selection based on these component traits is recommended for yield improvement. Furthermore, hybridization between divergent genotypes from Cluster I (G1, G2) and Cluster II (G6, G7) is suggested to exploit heterosis and derive superior recombinants.
Acknowledgement
AcknowledgmentsThe first author expresses sincere gratitude to his research guide Dr. Mukesh Rathode and Prof.Pravin Gangasagar the Department of Genetics and Plant Breeding, School of International Journal of Biology Sciences https://www.biologyjournal.net Agricultural Sciences, G H Raisoni University, Saikheda, Pandhurna (M.P.) for providing necessary research facilities. Thanks are also extended to the Agriculture Research Station, Badnapur for providing mungbean seed material.
References
10 in the original paper- Ahmad S, Belwal V. Assessment of genetic parameters and character association in mungbean genotypes. J Pulses Res. 2020;33(1):12-18.
- Al-Jibouri HA, Miller PA, Robinson HF. Genotypic and environmental variances and covariances in an upland cotton cross of interspecific origin. Agron J. 1958;50(10):633-636.
- Azam MG, et al. Genetic variability and character association in mungbean (Vigna radiata L. Wilczek). Int J Plant Breed. 2018;12(2):45-52.
- Burton GW, DeVane EH. Estimating heritability in tall fescue from replicated clonal material. Agron J. 1953;45(10):478-481.
- Dewey DR, Lu KH. A correlation and path-coefficient analysis of components of crested wheatgrass seed production. Agron J. 1959;51(9):515-518.
- Dhunde BB, et al. Correlation and path analysis studies in green gram (Vigna radiata L. Wilczek). J Pharmacogn Phytochem. 2021;10(1):890-894.
- Johnson HW, Robinson HF, Comstock RE. Estimates of genetic and environmental variability in soybeans. Agron J. 1955;47(7):314-318.
- Mahalanobis PC. On the generalized distance in statistics. Proc Natl Inst Sci India. 1936;2(1):49-55.
- Marawar MW, et al. Studies on genetic variability, correlation and path analysis in mungbean. Electron J Plant Breed. 2020;11(3):741-746.
- Panse VG, Sukhatme PV. Statistical methods for agricultural workers. New Delhi: Indian Council of Agricultural Research; 1985.