
Research article · 2026 · Full text
International Journal of Horticulture and Food ScienceEffect of varying pulp levels and TSS concentrations on the physicochemical characteristics of guava juice (cv. Taiwan Pink)
Volume 8(9) · Pages 38–40 · DOI: 10.33545/26631067.2026.v8.i9a.852 ↗
Research areasPsidium guajava Extracts and ApplicationsPostharvest Quality and Shelf Life ManagementFood and Agricultural Sciences
Abstract
Author-writtenThe present investigation was carried out to study the effect of varying pulp levels (7%, 10%, 12%, and 15%) and total soluble solids (TSS: 13°, 15°, and 18°Brix) concentrations on the physicochemical characteristics of guava juice (cv. Taiwan Pink) during storage up to 60 days at Post Harvest and Value Addition Laboratory, Mewar University Gangrar, Chittorgarh (Rajasthan) during February to May 2024-25. The results revealed that both pulp concentration and TSS levels had a significant influence on the quality parameters, including TSS, ascorbic acid, titratable acidity, and total sugar content. A gradual decline in TSS was observed across all treatments during storage, with higher initial TSS levels (18°Brix) maintaining significantly higher TSS values throughout the storage period. Ascorbic acid content also declined steadily but was better retained in treatments with higher pulp levels (12–15%) and higher TSS (18°Brix), indicating improved vitamin C stability. Titratable acidity showed a slight increase over storage, with higher pulp and TSS combinations contributing to better flavor retention and product stability. Similarly, total sugar content decreased marginally during storage, with the combination of 15% pulp and 18°Brix TSS recording the highest retention of sweetness and overall acceptability.
Summary
Source-checkedPlain-language reading of the full paper, prepared with AI and checked against the text. Each point links to the authors' own words.
Why it matters
- Guava is a tropical fruit highly valued for its nutritional content, specifically its antioxidants, fiber, and vitamin C. View evidence ↗
- The Taiwan Pink cultivar is ideal for juice production because of its sweet-tangy flavor and pink flesh. View evidence ↗
- Preserving guava juice is challenging because key sensory qualities and nutrients, such as vitamin C, can degrade during storage. View evidence ↗
The question
- The study aimed to determine how different levels of pulp (7% to 15%) and total soluble solids (13° to 18°Brix) affect the physicochemical properties of Taiwan Pink guava juice over a 60-day storage period. View evidence ↗
What they did
- The experiment was conducted from February to May 2024-25 at the Post Harvest and Value Addition Laboratory at Mewar University in Rajasthan. View evidence ↗
- The researchers used a Factorial Completely Randomized Design (FCRD) involving two factors. View evidence ↗
- Physicochemical parameters were measured at three specific storage intervals: 0, 30, and 60 days. View evidence ↗
What they found
- Total Soluble Solids (TSS) declined across all treatments during storage, dropping from an initial range of 13.0°–18.0°Brix to 12.3°–17.5°Brix after 60 days. View evidence ↗
- Juice with an initial TSS of 18°Brix, particularly when combined with 12% pulp, showed the best retention of sweetness and consistency. View evidence ↗
- Ascorbic acid levels decreased steadily over 60 days, falling from an initial range of 185–205 mg/100g to 157–177 mg/100g. View evidence ↗
- Vitamin C was better preserved in juices that had higher TSS (18°Brix) and higher pulp concentrations, specifically 15%. View evidence ↗
- Higher pulp levels (12%–15%) combined with higher TSS helped maintain higher acidity, which the authors link to better flavor stability. View evidence ↗
- Total sugar content decreased slightly from an initial range of 11.5%–15.2% to 11.3%–14.8% after 60 days. View evidence ↗
- The combination of 15% pulp and 18°Brix TSS was the most effective at retaining sugar content. View evidence ↗
What it means
- The authors conclude that a pulp concentration of 12%–15% and a TSS level of 18°Brix is the most effective combination for maintaining the nutritional and physicochemical quality of guava juice during storage. View evidence ↗
Visual summary
3 visualsIllustrations explain the paper; charts are replotted from the paper's own table values.
Optimal Guava Juice Formulation
AI-generated conceptual illustration (Taiwan Pink guava fruit and guava juice). It explains the idea and does not show study data.
View source evidence ↗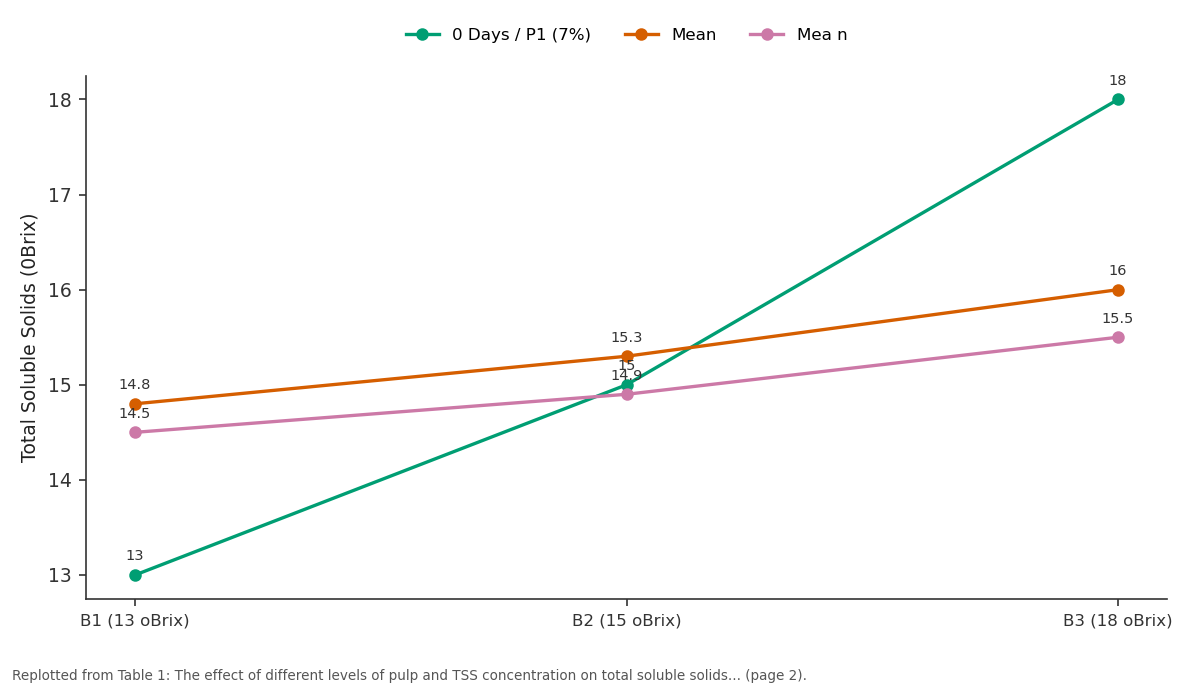
0 Days / P1 (7%) and Mean and more: B1 (13 oBrix) vs B2 (15 oBrix) vs B3 (18 oBrix)
Replotted from Table 1 (page 2) of the original paper. Every bar is the paper's own table value.
View source evidence ↗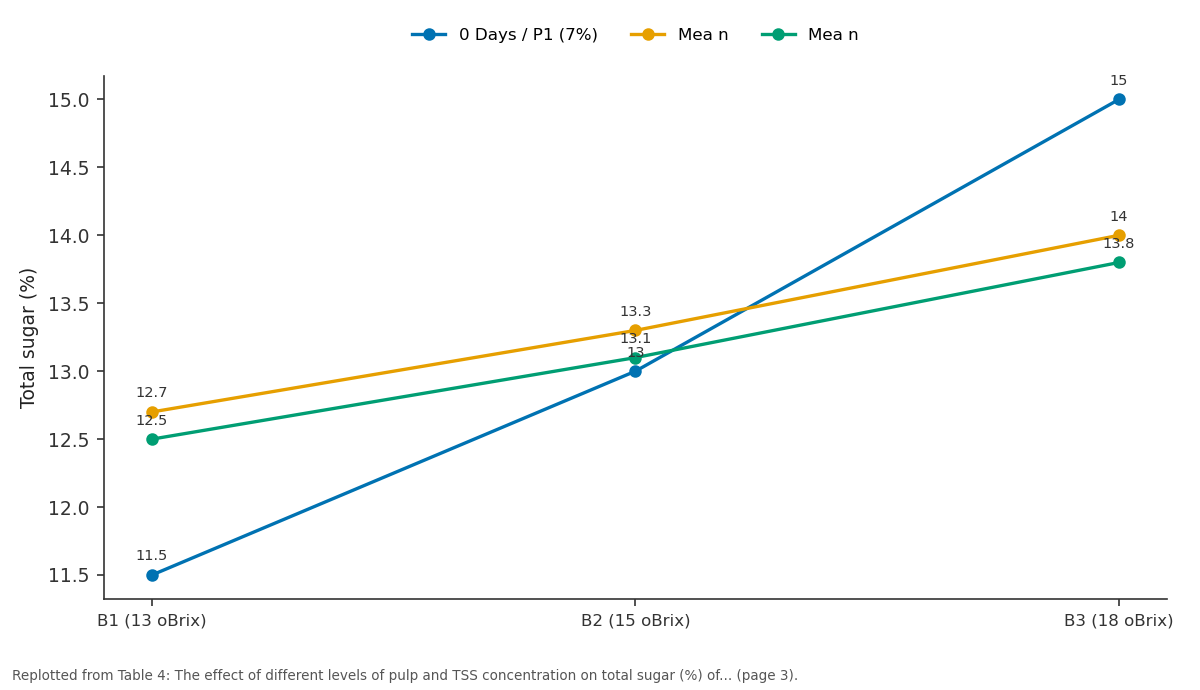
0 Days / P1 (7%) and Mea n and more: B1 (13 oBrix) vs B2 (15 oBrix) vs B3 (18 oBrix)
Replotted from Table 4 (page 3) of the original paper. Every bar is the paper's own table value.
View source evidence ↗Figures & tables
From the original paper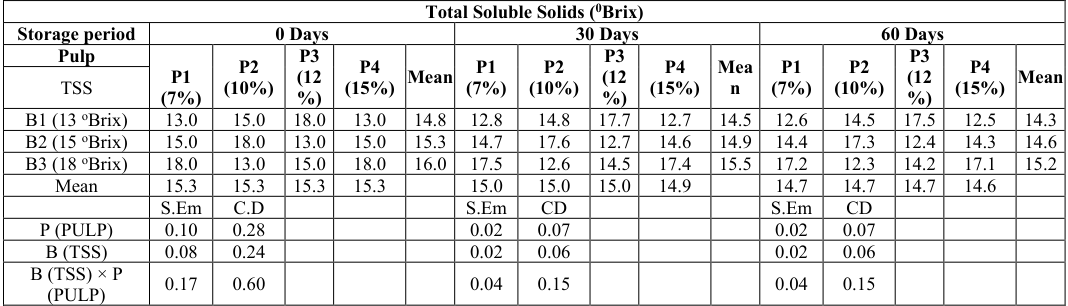 Table 1
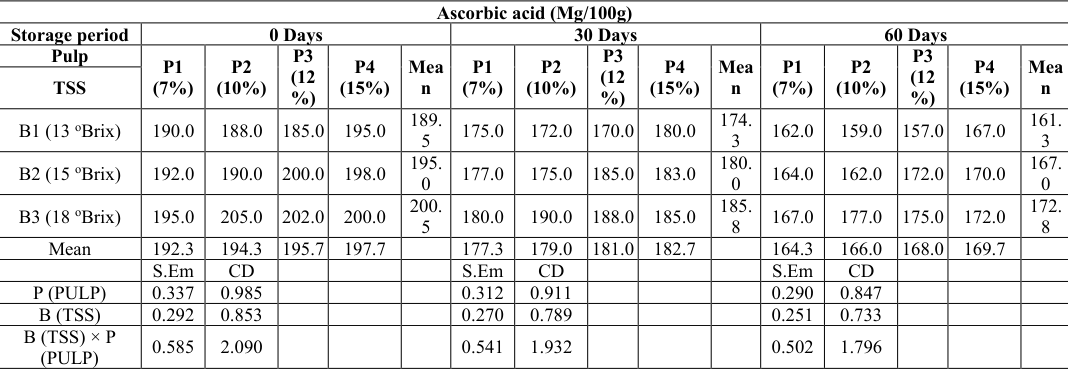 Table 2
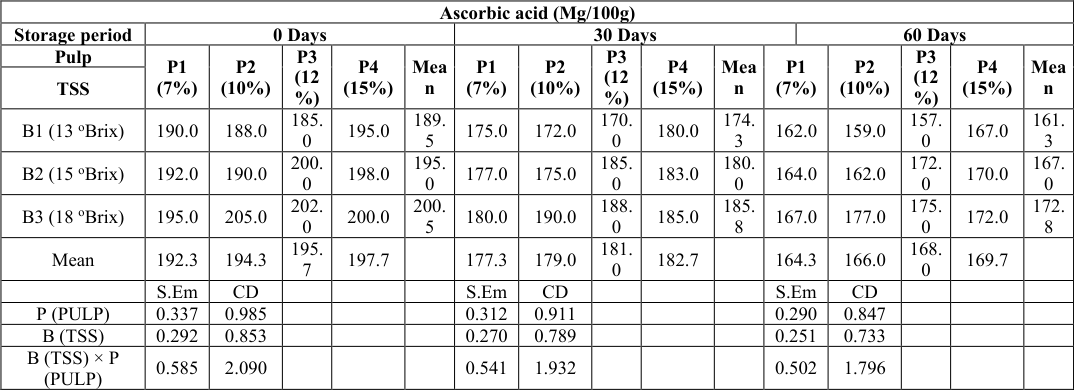 Table 3
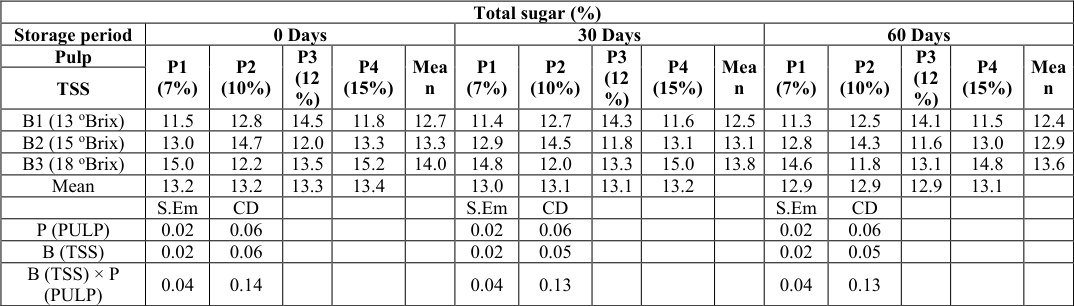 Table 4
Introduction
Guava (Psidium guajava L.) is a tropical fruit prized for its high nutritional value, especially its rich vitamin C, fiber, and antioxidant content (Sridhar et al., 2017 and Kalsi et al., 2023) [13, 5] . Among its cultivars, Taiwan Pink is particularly popular due to its attractive pink flesh and sweet-tangy flavour, making it ideal for juice production (Kalsi et al., 2023) [5] . The growing consumer demand for healthy, natural fruit-based beverages has further increased the importance of guava juice as a functional drink with potential health benefits such as antioxidant, anti-inflammatory, and cholesterol-lowering effects (Moussa and El-Gendy, 2019 and Nasef et al., 2020) [8,9] . Processing and preserving guava juice, however, pose challenges in maintaining its key nutrients like vitamin C and sensory qualities such as taste, color, and texture during storage (Afifah and Agustini, 2024) [1] . Recent studies highlight innovative methods like thermosonication and the use of natural additives to enhance shelf life and nutrient retention (Kalsi et al., 2023; Rahman et al., 2020) [13,10] . Moreover, juice quality parameters such as Total Soluble Solids (TSS) and pulp concentration play a crucial role in determining the final product's sensory appeal, biochemical stability, and consumer acceptability (Kaur et al., 2019) [6] . Understanding the effects of TSS and pulp levels on the storage behavior of guava juice is therefore essential for developing high-quality, nutritious, and marketable guava beverages.
Materials and Methods
A lab experiment was conducted during February to May of 2024-25 at Post Harvest and Value Addition Laboratory, Department of Agriculture (Horticulture) Fruit Science, Faculty of Agriculture and Veterinary Sciences, Mewar University Gangrar, Chittorgarh (Rajasthan). The experiment was laid out in FCRD (Factorial Completely Randomized Design) with two factors. The method for biochemical properties analysis is followed standard method of particular parameters at different duration like 0, 30 and 60 days of storage. The data were analyzed by appropriate statistical method.
Results and Discussion
The results of the present investigation revealed that both pulp levels and total soluble solids (TSS) concentrations significantly influenced the physicochemical characteristics of guava juice (cv. Taiwan Pink) during storage up to 60 days.
Total Soluble Solids (0Brix)
The data presented in Table 1 illustrate that an overall gradual decline in TSS was observed across all treatments during storage. Initially, TSS ranged from 13.0°Brix to 18.0°Brix across treatments. After 60 days, values ranged from 12.3°Brix to 17.5°Brix. Treatments with higher initial TSS levels (18°Brix) consistently recorded higher TSS retention throughout storage, especially when combined with 12% pulp, indicating that both factors played a significant role in maintaining the sweetness and consistency of the juice over time. The present investigation are close agreement with findings of Sarker et al., (2009) [11] , Singh et al., (2020) [12] and Kumar et al., (2019) [7] .
| Total Soluble Solids (0Brix) | — | — | — | — | — | — | — | — | — | — | — | — | — | — | — |
|---|---|---|---|---|---|---|---|---|---|---|---|---|---|---|---|
| Storage period | 0 Days | 30 Days | 60 Days | ||||||||||||
| Pulp | P1 (7%) | P2 (10%) | P3 (12 %) | P4 (15%) | Mean | P1 (7%) | P2 (10%) | P3 (12 %) | P4 (15%) | Mea n | P1 (7%) | P2 (10%) | P3 (12 %) | P4 (15%) | Mean |
| TSS | |||||||||||||||
| B1 (13 oBrix) | 13.0 | 15.0 | 18.0 | 13.0 | 14.8 | 12.8 | 14.8 | 17.7 | 12.7 | 14.5 | 12.6 | 14.5 | 17.5 | 12.5 | 14.3 |
| B2 (15 oBrix) | 15.0 | 18.0 | 13.0 | 15.0 | 15.3 | 14.7 | 17.6 | 12.7 | 14.6 | 14.9 | 14.4 | 17.3 | 12.4 | 14.3 | 14.6 |
| B3 (18 oBrix) | 18.0 | 13.0 | 15.0 | 18.0 | 16.0 | 17.5 | 12.6 | 14.5 | 17.4 | 15.5 | 17.2 | 12.3 | 14.2 | 17.1 | 15.2 |
| Mean | 15.3 | 15.3 | 15.3 | 15.3 | 15.0 | 15.0 | 15.0 | 14.9 | 14.7 | 14.7 | 14.7 | 14.6 | |||
| S.Em | C.D | S.Em | CD | S.Em | CD | ||||||||||
| P (PULP) | 0.10 | 0.28 | 0.02 | 0.07 | 0.02 | 0.07 | |||||||||
| B (TSS) | 0.08 | 0.24 | 0.02 | 0.06 | 0.02 | 0.06 | |||||||||
| B (TSS) × P (PULP) | 0.17 | 0.60 | 0.04 | 0.15 | 0.04 | 0.15 |
Table text extracted from the original PDF; superscript letters are shown inline. The original table image is below.
View original table image
The data presented in Table 2 illustrate that the ascorbic acid content also showed a steady decline during storage, with values decreasing from 185-205 mg/100g at 0 days to 157-177 mg/100g by 60 days. However, guava juice with higher pulp concentrations (particularly 15%) and higher TSS levels (18°Brix) retained significantly higher vitamin C levels compared to other combinations. This demonstrates the positive effect of higher pulp and TSS in preserving this key nutrient. The present investigation are agreement with findings of Chauhan and Verma, (2020) [4] , Yadav et al., (2019) [15] , Kumar et al., (2019) [7] and Yadav et al., (2014) [14] .
| Ascorbic acid (Mg/100g) | — | — | — | — | — | — | — | — | — | — | — | — | — | — | — |
|---|---|---|---|---|---|---|---|---|---|---|---|---|---|---|---|
| Storage period | 0 Days | 30 Days | 60 Days | ||||||||||||
| Pulp | P1 (7%) | P2 (10%) | P3 (12 %) | P4 (15%) | Mea n | P1 (7%) | P2 (10%) | P3 (12 %) | P4 (15%) | Mea n | P1 (7%) | P2 (10%) | P3 (12 %) | P4 (15%) | Mea n |
| TSS | |||||||||||||||
| B1 (13 oBrix) | 190.0 | 188.0 | 185.0 | 195.0 | 189. 5 | 175.0 | 172.0 | 170.0 | 180.0 | 174. 3 | 162.0 | 159.0 | 157.0 | 167.0 | 161. 3 |
| B2 (15 oBrix) | 192.0 | 190.0 | 200.0 | 198.0 | 195. 0 | 177.0 | 175.0 | 185.0 | 183.0 | 180. 0 | 164.0 | 162.0 | 172.0 | 170.0 | 167. 0 |
| B3 (18 oBrix) | 195.0 | 205.0 | 202.0 | 200.0 | 200. 5 | 180.0 | 190.0 | 188.0 | 185.0 | 185. 8 | 167.0 | 177.0 | 175.0 | 172.0 | 172. 8 |
| Mean | 192.3 | 194.3 | 195.7 | 197.7 | 177.3 | 179.0 | 181.0 | 182.7 | 164.3 | 166.0 | 168.0 | 169.7 | |||
| S.Em | CD | S.Em | CD | S.Em | CD | ||||||||||
| P (PULP) | 0.337 | 0.985 | 0.312 | 0.911 | 0.290 | 0.847 | |||||||||
| B (TSS) | 0.292 | 0.853 | 0.270 | 0.789 | 0.251 | 0.733 | |||||||||
| B (TSS) × P (PULP) | 0.585 | 2.090 | 0.541 | 1.932 | 0.502 | 1.796 |
Table text extracted from the original PDF; superscript letters are shown inline. The original table image is below.
View original table image
The data in Table 3 revealed that the effect of different pulp levels and TSS concentrations on the titratable acidity (%) of guava juice over 0, 30, and 60 days of storage. Acidity increased slightly as storage progressed. Initially ranging between 0.35% and 0.39%, acidity increased to 0.39%-0.44% by 60 days. Treatments with higher pulp levels (12%-15%) and higher TSS maintained slightly higher acidity, which contributes to flavor stability and helps maintain product quality during storage. The present investigation are agreement with findings of Sarker et al., (2009) [11] , Kumar et al., (2019) [7] and Bhattacharya and Saha (2016) [3] .
| Ascorbic acid (Mg/100g) | — | — | — | — | — | — | — | — | — | — | — | — | — | — | — | — |
|---|---|---|---|---|---|---|---|---|---|---|---|---|---|---|---|---|
| Storage period | 0 Days | 30 Days | 60 Days | |||||||||||||
| Pulp | P1 (7%) | P2 (10%) | P3 (12 %) | P4 (15%) | Mea n | P1 (7%) | P2 (10%) | P3 (12 %) | P4 (15%) | Mea n | P1 (7%) | P2 (10%) | P3 (12 %) | P4 (15%) | Mea n | |
| TSS | ||||||||||||||||
| B1 (13 oBrix) | 190.0 | 188.0 | 185. 0 | 195.0 | 189. 5 | 175.0 | 172.0 | 170. 0 | 180.0 | 174. 3 | 162.0 | 159.0 | 157. 0 | 167.0 | 161. 3 | |
| B2 (15 oBrix) | 192.0 | 190.0 | 200. 0 | 198.0 | 195. 0 | 177.0 | 175.0 | 185. 0 | 183.0 | 180. 0 | 164.0 | 162.0 | 172. 0 | 170.0 | 167. 0 | |
| B3 (18 oBrix) | 195.0 | 205.0 | 202. 0 | 200.0 | 200. 5 | 180.0 | 190.0 | 188. 0 | 185.0 | 185. 8 | 167.0 | 177.0 | 175. 0 | 172.0 | 172. 8 | |
| Mean | 192.3 | 194.3 | 195. 7 | 197.7 | 177.3 | 179.0 | 181. 0 | 182.7 | 164.3 | 166.0 | 168. 0 | 169.7 | ||||
| S.Em | CD | S.Em | CD | S.Em | CD | |||||||||||
| P (PULP) | 0.337 | 0.985 | 0.312 | 0.911 | 0.290 | 0.847 | ||||||||||
| B (TSS) | 0.292 | 0.853 | 0.270 | 0.789 | 0.251 | 0.733 | ||||||||||
| B (TSS) × P (PULP) | 0.585 | 2.090 | 0.541 | 1.932 | 0.502 | 1.796 |
Table text extracted from the original PDF; superscript letters are shown inline. The original table image is below.
View original table image
The data was presented in table 4 revealed that the total sugar content ranged from 11.5% to 15.2% initially and decreased slightly over storage, with final values between 11.3% and 14.8% at 60 days. Treatments combining 15% pulp with 18°Brix TSS retained the highest sugar content, indicating that higher pulp and TSS levels are beneficial for maintaining sweetness and consumer acceptability The present investigation are agreement with findings of AOAC, (2005) [2] , Sarker et al., (2009) [11] and Kumar et al., (2019) [7] .
| Total sugar (%) | — | — | — | — | — | — | — | — | — | — | — | — | — | — | — |
|---|---|---|---|---|---|---|---|---|---|---|---|---|---|---|---|
| Storage period | 0 Days | 30 Days | 60 Days | ||||||||||||
| Pulp | P1 (7%) | P2 (10%) | P3 (12 %) | P4 (15%) | Mea n | P1 (7%) | P2 (10%) | P3 (12 %) | P4 (15%) | Mea n | P1 (7%) | P2 (10%) | P3 (12 %) | P4 (15%) | Mea n |
| TSS | |||||||||||||||
| B1 (13 oBrix) | 11.5 | 12.8 | 14.5 | 11.8 | 12.7 | 11.4 | 12.7 | 14.3 | 11.6 | 12.5 | 11.3 | 12.5 | 14.1 | 11.5 | 12.4 |
| B2 (15 oBrix) | 13.0 | 14.7 | 12.0 | 13.3 | 13.3 | 12.9 | 14.5 | 11.8 | 13.1 | 13.1 | 12.8 | 14.3 | 11.6 | 13.0 | 12.9 |
| B3 (18 oBrix) | 15.0 | 12.2 | 13.5 | 15.2 | 14.0 | 14.8 | 12.0 | 13.3 | 15.0 | 13.8 | 14.6 | 11.8 | 13.1 | 14.8 | 13.6 |
| Mean | 13.2 | 13.2 | 13.3 | 13.4 | 13.0 | 13.1 | 13.1 | 13.2 | 12.9 | 12.9 | 12.9 | 13.1 | |||
| S.Em | CD | S.Em | CD | S.Em | CD | ||||||||||
| P (PULP) | 0.02 | 0.06 | 0.02 | 0.06 | 0.02 | 0.06 | |||||||||
| B (TSS) | 0.02 | 0.06 | 0.02 | 0.05 | 0.02 | 0.05 | |||||||||
| B (TSS) × P (PULP) | 0.04 | 0.14 | 0.04 | 0.13 | 0.04 | 0.13 |
Table text extracted from the original PDF; superscript letters are shown inline. The original table image is below.
View original table image
Conclusion
Based on the findings, it can be concluded that the increasing the pulp concentration to 12%-15% along with higher TSS levels (18°Brix) was most effective in retaining desirable physicochemical attributes such as TSS, ascorbic acid, acidity, and total sugars during storage. This combination supports better nutritional quality, sensory properties, and extended shelf life of guava juice.
References
15 in the original paper- Afifah DS, Agustini R. The impact of red guava juice concentration on the quality and antioxidant activity of red guava synbiotic yogurt. Int J Food Sci Technol. 2024;57(2):202-210.
- AOAC. Official methods of analysis. 18th ed. AOAC International; 2005.
- Bhattacharya S, Saha P. Quality characteristics of guava squash during storage. J Food Process Technol. 2016;7(9):635.
- Chauhan R, Verma A. Nutrient management for quality production of guava (Psidium guajava L.): A review. J Pharmacogn Phytochem. 2020;9(4):2872-2876.
- Kalsi R, Singh N, Gill B. Thermosonication processing of guava juice: Safety and quality attributes. J Food Process Preserv. 2023;47(1).
- Kaur J, Sharma S. Effect of pulp concentration on texture and mouthfeel of guava juice. Beverage Industry Journal. 2019;7(3):211-218.
- Kumar R, Meena RK, Patel R. Effect of foliar feeding of nutrients on fruit set and yield of guava (Psidium guajava L.). Int J Curr Microbiol Appl Sci. 2019;8(5):2048-2054.
- Moussa MEM, El-Gendy MA. Evaluation of wheyguava beverage blends. Food Qual Prefer. 2019;72(3):73-81.
- Nasef HY, Ali MS, El-Gendy MA. Probiotics, prebiotics, and synbiotics in guava juice: Effect on quality during storage. Food Biochem. 2020;44(9):1014-1023.
- Rahman MM, Hossain MA, Karim R. Preservation of guava juice with natural additives. Food Chem. 2020;315:126211.
- Sarker BC, Rahman MM, Rahman MA. Effect of nitrogen and potassium on growth, yield, and fruit quality of guava (Psidium guajava L.). Bangladesh J Agric Res. 2009;34(2):319-325.
- Singh V, Yadav RK, Meena MK. Effect of nanonitrogen and micronutrients on growth and yield of guava. J Plant Dev Sci. 2020;12(7):409-413.
- Sridhar MJ, Raju G, Patil S. Sensory and storage analysis of jamun-guava juice blends. Int J Food Sci Technol. 2017;52(9):2323-2330.
- Yadav BL, Meena RH, Choudhary BL. Effect of foliar application of micronutrients on yield and quality of guava (Psidium guajava L.). J Hortic Sci. 2014;9(1):86-89.
- Yadav M, Gupta R. Physico-chemical and sensory characteristics of guava juice during storage. J Food Sci Nutr. 2019;14(2):105-114.