
Research article · 2026 · Full text
International Journal of Horticulture and Food ScienceResponses of integrated nutrient management at yield attributes on Cluster Bean (Cyamopsis tetragonoloba L. Taub.) c.v. Pusa Navbahar at south-western semi arid region U.P.
Volume 8(9) · Pages 33–37 · DOI: 10.33545/26631067.2026.v8.i9a.851 ↗
Research areasAgricultural Science and FertilizationAgriculture, Plant Science, Crop ManagementPlant Growth and Agriculture Techniques
Abstract
Author-writtenBackground: cluster bean is important legume vegetable mainly grown under irrigated condition during summer and rainy season. The crop also survives even at moderate salinity and alkalinity conditions. This investigation is intended to assess the integrated nutrient management responses on cluster bean green pod c.v. Pusa Navbahar. Methods: The experiment was carried out during two consecutive years (2021 and 2022) of rainy season on cluster bean at horticultural research farm RBS college Bichpuri Agra U.P. with the combination of eight treatments viz. T1, T2, T3, T4, T5, T6, T7, T8, T9, T10, T11, T12 and three replications laid out in randomized block design using the variety Pusa Novbahar of cluster bean for green pod production. Result: The pooled results showed super imposition of 100% RDF through organic manures (50% RDF through vermicompost+50% RDF through FYM) + Bio-fertilizers (Rhizobium 25 g kg-1 seed + PSB 5 kg ha-1) (applied in soil prior to seed sowing) resulted in significant improvement in yield attributes characters i.e. Number of pods per cluster (8.11), Number of clusters per plant (26.12), Number of marketable clusters plot-1 (435.66), Fresh weight of clusters (31.99 g) Fresh weight of pod per cluster (30.09 g), Yield of pods per plant (808.50 g), Length of raceme (12.54 cm), Length of pod (10.46 cm), Diameter of pod (1.11 cm), Fresh weight of pod (7.03g), Yield of marketable green pods (11053.07 kg/ha), Benefit-cost ratio 3.21. The combined effect of inorganic fertilizers (NPK), organic manure (FYM, vermicompost) and bio-fertilizers (Rhizobium, PSB) was significantly better than their individual effects in the present investigation observed on yield characters.
Summary
Source-checkedPlain-language reading of the full paper, prepared with AI and checked against the text. Each point links to the authors' own words.
Why it matters
- Cluster bean, also known as Guar, is an important Indian legume vegetable grown in both irrigated and unirrigated conditions during the summer and rainy seasons. View evidence ↗
- The crop is economically significant because its seed endosperm gum is widely used as a thickener and additive in the textile, medicine, cosmetic, and confectionery industries. View evidence ↗
- Relying solely on inorganic fertilizers over the long term can lead to a lack of secondary nutrients and the deterioration of the soil's physical and chemical properties. View evidence ↗
The question
- The study aimed to evaluate how different integrated nutrient management (INM) strategies affect the yield attributes of the Pusa Navbahar cluster bean variety. View evidence ↗
What they did
- The research was conducted over two rainy seasons (2021 and 2022) under irrigated conditions at the R.B.S. College horticulture research farm in Agra, India. View evidence ↗
- The experiment used a randomized block design with eight treatments, each replicated three times across twenty-four plots. View evidence ↗
What they found
- The treatment combining 100% RDF via organic manures (50% vermicompost, 50% FYM) and bio-fertilizers (T12) produced the highest pooled results across all measured attributes, including pod yield (808.50 g per plant) and marketable green pods (11053.07 kg/ha). View evidence ↗
- The lowest number of pods per cluster (4.07) was observed in the T1 control group. View evidence ↗
- The T12 treatment increased the yield of green pods by 47.41% compared to the T1 control treatment. View evidence ↗
- T12 achieved the highest benefit-cost ratio of 3.21, while the lowest ratio was 1.02 in treatment T10. View evidence ↗
- Integrating inorganic fertilizers, organic manures, and bio-fertilizers was significantly more effective for yield characters than using any of these nutrient sources individually. View evidence ↗
What it means
- The authors recommend the T12 treatment (integrated organic manures and bio-fertilizers) for farmers in the south-western semi-arid region of Uttar Pradesh. View evidence ↗
- The study concludes that combining inorganic and organic fertilizers with bio-fertilizers significantly improves growth characters compared to using the recommended dose of fertilizers (RDF) alone. View evidence ↗
Visual summary
3 visualsIllustrations explain the paper; charts are replotted from the paper's own table values.
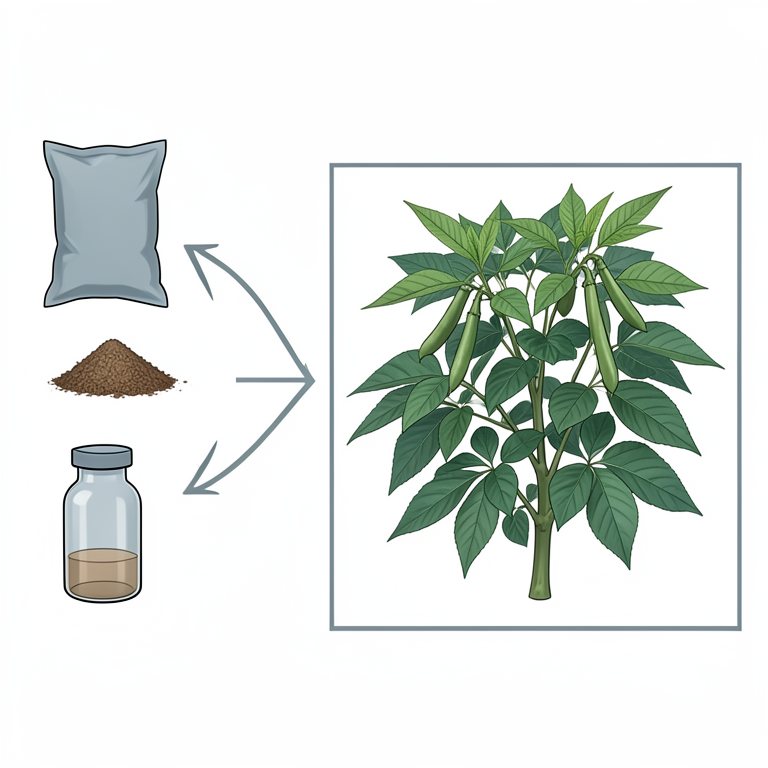
Synergy of Integrated Nutrient Management
AI-generated conceptual illustration (Cluster Bean (Cyamopsis tetragonoloba) plants). It explains the idea and does not show study data.
View source evidence ↗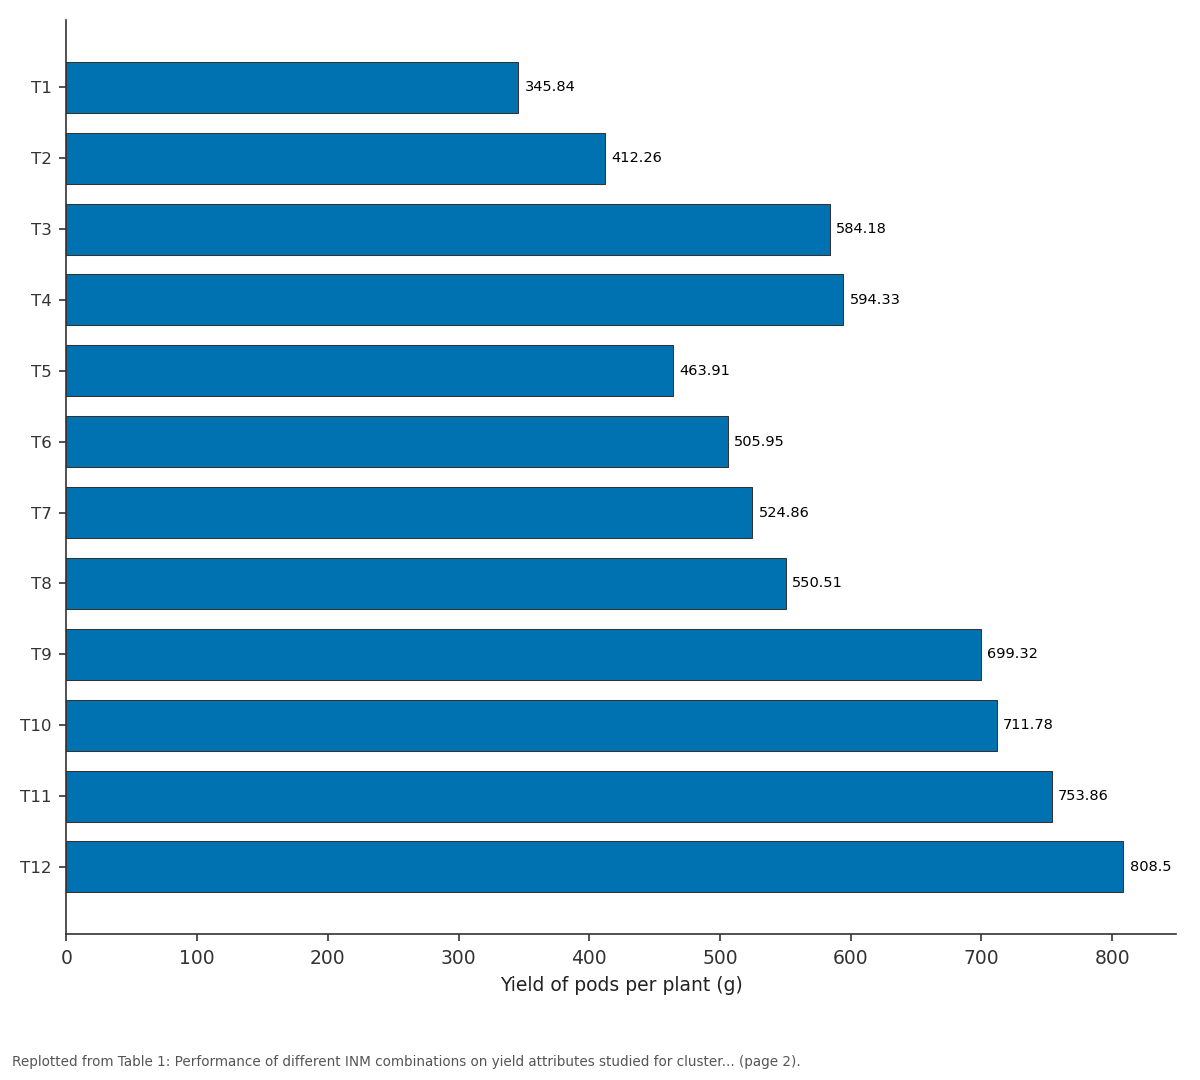
Pooled: T1 vs T2 vs T3 vs T4 vs T5
Replotted from Table 1 (page 2) of the original paper. Every bar is the paper's own table value.
View source evidence ↗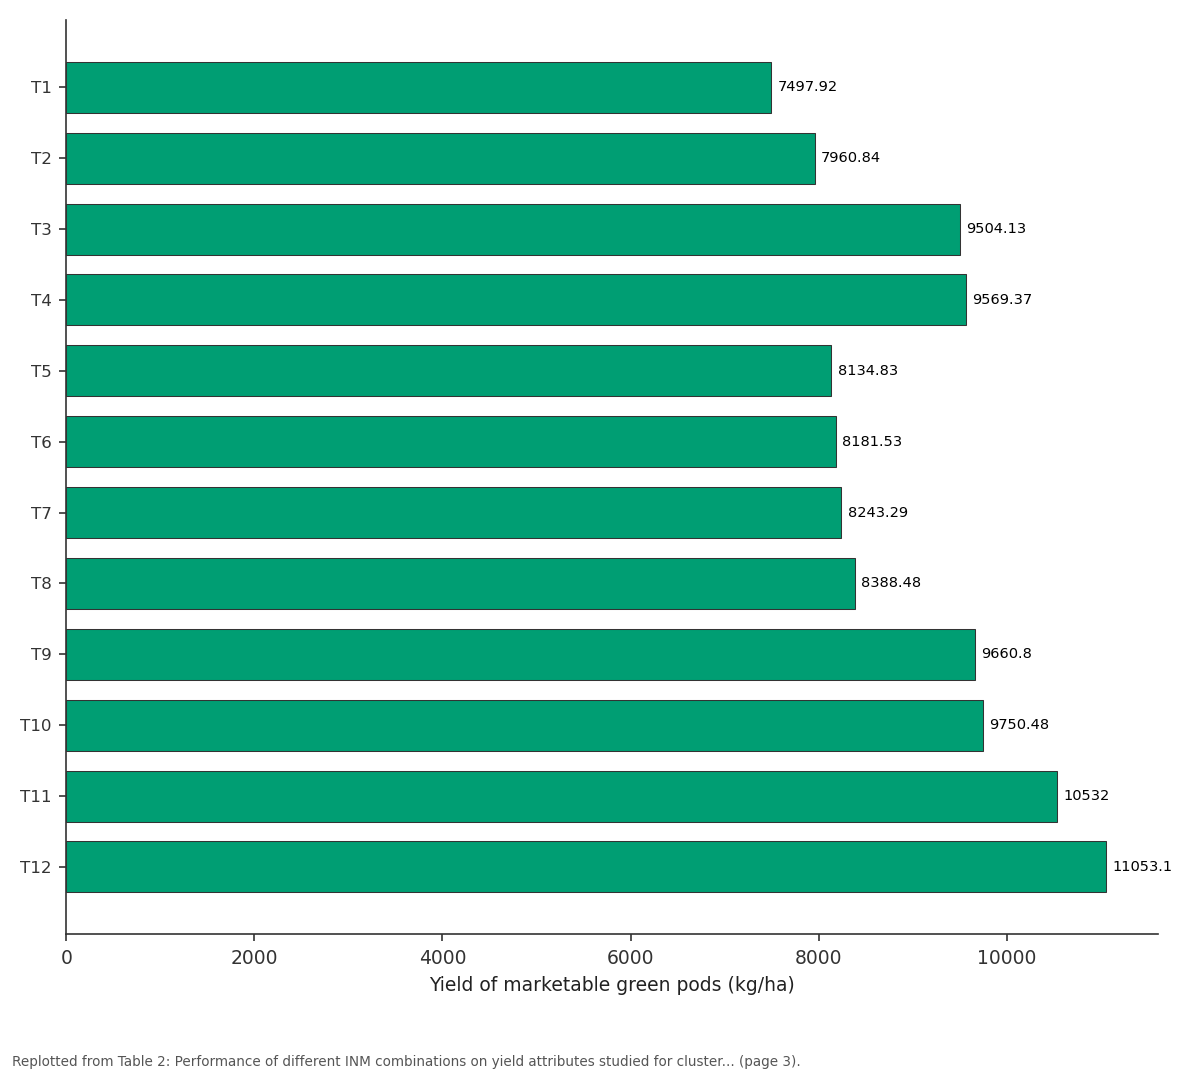
Pooled: T1 vs T2 vs T3 vs T4 vs T5
Replotted from Table 2 (page 3) of the original paper. Every bar is the paper's own table value.
View source evidence ↗Figures & tables
From the original paper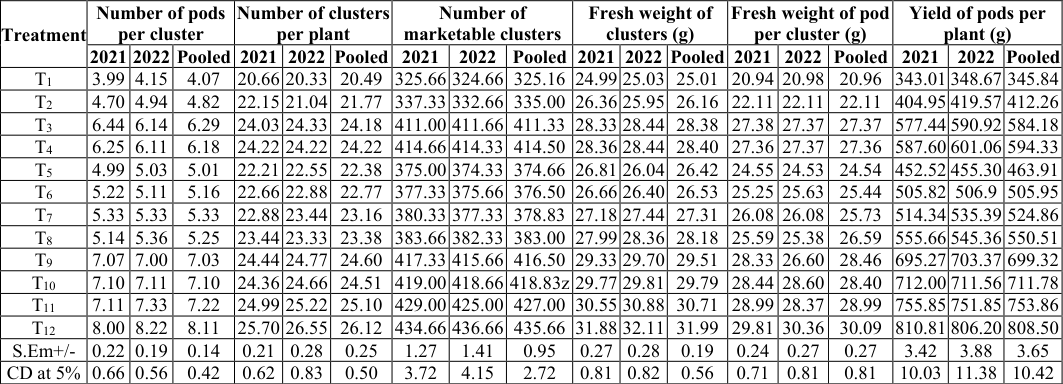 Table 1
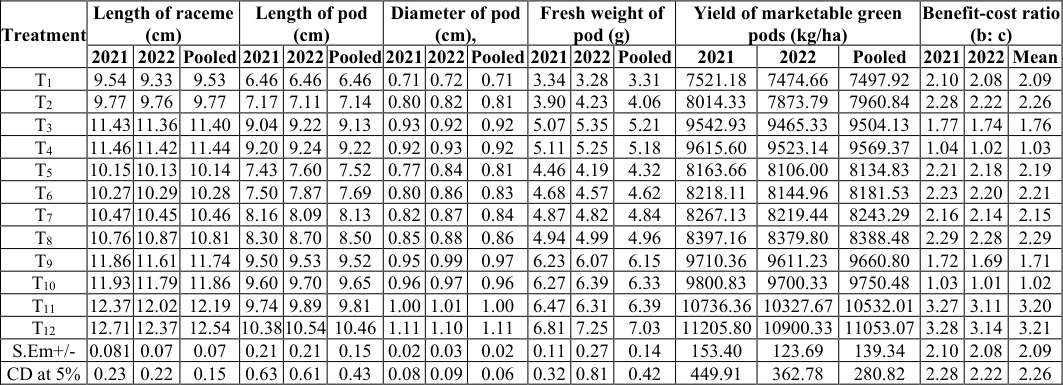 Table 2
Introduction
Cluster bean [Cyamopsis tetragonoloba L. Taub] popularly referred as "Guar" is vegetable crop of Indian origin belonging to the family lenguminoceae [1] . It is an important legume crop mainly grown under irrigated as well as un irrigated condition during summer and rainy season. There is no other legume crop so hardy and drought tolerant as guar, which is particularly suited for the soil and climate of Agra region. Its tender green pods are used for culinary purpose and whole plant is used a roughages for cattle. There is a big demand for Indian gum products, food additives, and food thickener, Guar seed endosperm gum is used in numerous industries, including textiles, confectioneries, medicines, and cosmetics [2]. The aim of integrated nutritional management is to integrate the use of natural and artificial soil nutrients to increase crop productivity and maintain soil fertility without impairing soil health for future generations. In long-term imbalanced use of inorganic fertilizers will not maintain higher yields over the years due to paucity of secondary nutrients will result deterioration physical and chemical properties. Increased use of fertilizer will undoubtedly increase the production of raw materials significantly, but in the sustainable fertility it will have a negative impact on soil health. In case of INM approach, careful application of all nutrients can sustainably improve soil fertility and economic yields [3]. This current study shows the actual impact of the integrated use of inorganic fertilizers combined with organic fertilizers and bio-fertilizers on the growth, and quality of cluster ban and sustainable soil fertility.
Materials and methods
The study was conducted under irrigated condition during the year 2021 and 2022 cropping season in rainy season at R.B.S. College horticulture research farm, Bichpuri, Agra. The research farm is situated to the Agra-Bharatpur Road, 2 km away from Bichpuri, railway station, toward Bharatpur is located at a latitude of 27.2 0 North and longitude of 77.9 0 east with an elevation of 163.4 meters above means sea level. Agra has a semi arid and sub tropical climate with hot-dry summers and severe cold. The average annual maximum and minimum temperature is 36 C° and 4 C° respectively. The soil type in the area is light textured sandy loam. The experiment was laid out randomized block design (RBD) with eight treatments, replicated three times this consist twenty four plots. The Pusa Novbahar variety of cluster bean planted at a 45×30 cm in flat plots consecutive both the years, Net plot size-2.25 m×1.5 m=3.375 mete 2 . 1. Data analysis: All significant pairs of treatment means were compared using the critical difference (CD) at 5% level of significance, coefficient of variation (C.V.) and standard error of mean (SEM).
Treatment details: following treatment combination
viz. T 1 {Control 100% RDF (25:60:60) N: P: K kg ha - 1 }, T 2 { RDF +Bio-fertilizers (Rhizobium 25 g kg -1 seed +PSB 5 kg ha -1 )},T 3 {FYM (25 t ha -1 )}, T 4 {Vermicompost (10 t ha -1 )}, T 5 {75% RDF through inorganic fertilizers + 25% RDF through vermicompost + Bio-fertilizers (Rhizobium 25 g kg -1 seed + PSB 5 kg ha -1 )}, T 6 {75% RDF through inorganic fertilizers + 25% RDF through FYM + Bio-fertilizers (Rhizobium 25 g kg -1 seed + PSB 5 kg ha -1 )}, T 7 {50% RDF through inorganic fertilizers + 50% RDF through FYM + Biofertilizers (Rhizobium 25 g kg -1 seed +PSB 5 kg ha -1 )}, T 8 {50% RDF through inorganic fertilizers + 50% RDF through vermicompost + Bio-fertilizers (Rhizobium 25 g kg -1 seed + PSB 5 kg ha -1 )}, T 9 {FYM (25 t ha -1 ) + Bio-fertilizers (Rhizobium 25 g kg -1 seed + PSB 5 kg ha -1 )}, T 10 {Vermicompost (10 t ha -1 ) + Bio-fertilizers (Rhizobium 25 g kg -1 seed + PSB5 kg ha -1 )}, T 11 {100% RDF through organic manures (50% RDF through vermicompost+50% RDF through FYM), and T 12 {100% RDF through organic manures (50% RDF through vermicompost+50% RDF through FYM) + Bio-fertilizers (Rhizobium 25 g kg -1 seed + PSB 5 kg ha -1 )}. showed to be superior (8.00 pods and 8.22 pods) during both the years with respect to increase in number of pods per cluster. These results are in accordance with the [10,15,17] .
Results and
Results and
Number of clusters per plant:
The data depicted in Table -1 of the pooled data study for two years, combined effect of INM treatments showed significance influence on number of clusters per plant. However treatment T 12 was recorded maximum number of clusters per plant (26.12) and proved significant trustworthy over rest of the treatment which was followed by T 11 , T 9 , T 10 , T 4 , T 3 , T 8 , T 7 , T 6 , T 5, and T 2 respectively. While minimum number of clusters per plant was counted under treatment T 1 . Application of proper integration of 100% RDF through organic manures {(50% RDF through vermicompost, and 50% RDF through FYM) + bio-fertilizers (Rhizobium 25 g kg -1 seed treatment + PSB 5 kg ha -1 soil application)}, these maximum number of clusters per plant were obtained which was also significantly higher than other treatment including T 1 .
Similar results were also quoted by [10,[15][16][17] . Similar results were also reported by [15] .
Number of marketable clusters plot
Number of marketable clusters plot
Fresh weight of clusters: An examination of Table-1
showed pooled data that Statistically highest fresh weight of cluster (g) of cluster bean were noted in treatment T 12 (31.88, 32.11 and 31.99) during the first year, second and pool data where the cluster bean was grown under the field condition and lowest fresh weight of cluster (g) were observed in treatment T 1 (24.99, 25.03, and 25.01) during the both years and pool data. The probable reason for gaining higher fresh weight of cluster (g) might be due to integration of 100% RDF through organic fertilizers, (50% RDF through vermicompost, and 50% RDF through FYM) and bio-fertilizers (Rhizobium 25 g kg -1 seed + PSB 5 kg ha - 1 ) was most effective treatment which might have made favourable condition for the plant growth. This result was conformity with [17] .
Fresh weight of pod per cluster: Data depicted in Table-
1 showed pooled data that the maximum fresh weight of pod per cluster (g) (30.09) was recorded under treatment T 12 , followed by T 11 (28.99), While the minimum fresh weight of pod per cluster (g) was treatment T 1 (20.96), followed by T 2 (22.11). it was found that application of 100% RDF through organic manures (50% RDF through vermicompost, and 50% RDF through FYM) and biofertilizers (Rhizobium 25 g kg -1 seed treatment + PSB 5 kg ha -1 soil application) (T 12 ), highest fresh weight of pod per cluster (g) (29.81g and 30.36 g) yielded maximum fresh weight of pods per cluster which was also significantly higher than the other rest treatments. Similar results were also delineated by [14,15] .
Yield of pods per plant:
The pooled data exhibited the maximum yield (g) of pods per plant (808.50) was recorded in treatment T 12 , followed by treatments T 11, T 10, T 9, T 8, T 7, T 6, and T 5 respectively . While the minimum yield (g) of pods per plant was noted T 1 (345.84), followed by T 2 (412.26) (Table -1). it was observed that application of 100% RDF through organic manures (50% RDF through vermicompost, and 50% RDF through FYM) and biofertilizers (Rhizobium 25 g kg -1 seed treatment + PSB 5 kg ha -1 soil application) (T 12 ), Yield of pods per plant (g) (810.81g and 806.20 g) yielded the maximum yield which was also significantly higher than other lower treatments. Similar results were also delineated by [8,11,15,16,17] .
Length of raceme:
The pooled data showed that the significally maximum length of raceme (12.54 cm) was recorded in T 12 , followed by T 11 (12.19). While the minimum length of raceme (cm) was noted in treatment T 1 (9.53), followed by T 2 (9.77). Further examination of the data showed that treatments T 2 , T 3 and T 4 (9.77, 11.40 and 11.44) significantly improved length of raceme (cm) over treatment T 1 (9.33) (Table -2). Increased in length of raceme (cm) may be associated with the production of growth promoting substances, FYM, vermicompost and biofertilizers, which might have led to helped in general way to activate the physiological processes in the plant system. Similar results were also reported by [17] .
Length of pod:
The pooled data study for two year, The highest length of pod during both years (10.46) was observed in treatment T 12 {100% RDF through organic manures (50% RDF through vermicompost, and 50% RDF through FYM) and bio-fertilizers (Rhizobium 25 g kg -1 seed treatment + PSB 5 kg ha -1 soil application)}, while the minimum length of pod (cm) (6.46) during both the years was recording under treatment T 1 (RDF N: P: K kg ha -1 25:60:60). It could be revealed that integration of 50% RDF through vermicompost, and 50% RDF through FYM) and bio-fertilizers (Rhizobium 25 g kg -1 seed treatment + PSB 5 kg ha -1 soil application) might have accelerated the rate of metabolic activities in the plant system that might have resulting in increasing length of pod. These results were in conformity with the finding of [4,5,7,13,14,16,17] .
Diameter of pod:
The pooled data confirmed that the significantly maximum diameter of pod (cm) (1.11) was recorded in T 12 , followed by treatments T 11 , T 10 T 9, T 8 , T 7, T 6, and T 5 respectively. However the minimum diameter of pod (cm) was seen under T 1 (0.71) followed by T 2 (0.81). The diameter of pod (cm) was found to be maximum under the treatment T 12 {100% RDF through organic fertilizers, 50% RDF through vermicompost, and 50% RDF through FYM) and bio-fertilizers (Rhizobium 25 g kg -1 seed + PSB 5 kg ha -1 )} during the both years 2021 and 2022 respectively, while minimum diameter of pod (cm) was observed that (0.71 cm and 0.72 cm) under the treatment T 1 during the both years. Similar results quoted by [4,13,14,17] .
Fresh weight of pod:
The pooled data exhibited the maximum fresh weight of pod (g) (7.03) was recorded under the treatment T 12 [100% RDF through organic manures (50% RDF through vermicompost+50% RDF through FYM) + Bio-fertilizers (Rhizobium 25 g kg -1 seed + PSB 5 kg ha -1 )], followed by treatment T 11 (6.39) While, lowest (3.34 g and 3.28 g) was recorded under RDF N: P: K kg ha -1 (25:60:60) (T 1 ). Similar results were also reported by [4,8,9,13,14,15,17] .
11. Yield of marketable green pods: (11053.07 kg/ha) The pooled data put on view that the maximum yield of marketable green pods (kg/ha) (11053.07) was recorded in the treatment T 12 followed by treatment T 11 (10532.01) during both years of study. However, the minimum yield of marketable green pods (kg/ha) was seen under treatment T 1 (7497.92), followed by T 2 (7960.84). The magnitude of increase in yield of green pods (kg/ha) with T 12 treatment was 47.41% than treatment T 1 . Effect of treatments T 2 , T 3, and T 4 significantly improved yield of green pods (kg/ha) better than treatment T 1. The probable reason for higher yield of green pods might be due to integration of 100% RDF through organic fertilizers, (50% RDF through vermicompost, and 50% RDF through FYM) and biofertilizers (Rhizobium 25 g kg -1 seed + PSB 5 kg ha -1 ) was effective which might have made favorable condition for the root growth and development and induced changes in root morphology. Which in turn, affected the assimilation of nutrients. Enhanced accumulation of nutrients, increased growth and yield attributes and ultimately yield of cluster bean. There is parity of results of [4,5,9,6,17] .
Benefit-cost ratio:
The mean value of data showed that the maximum benefit cost-ratio (3.21) was calculated under the treatment T 12 followed by treatment T 11 (3.20), while the minimum benefit-cost ratio was recorded under the treatment T 10 (1.02), followed by treatment T 4 (1.03). The mean data of two years revealed that 100% RDF through organic manures 50% RDF through vermicompost, and 50% RDF through FYM + Bio fertilizers Rhizobium 25 g kg -1 seed + PSB 5 kg ha -1 significantly increased the benefit-cost ratio of cluster bean c.v. Pusa Novbahar, whereas application of bio-fertilizers with RDF (T 2 ) could not brought out any remarkable effect on the benefit cost ratio.
Except for this, all other INM treatment combinations also showed beneficial effects over treatment T 1 {RDF [NPK 30:60:60)} alone. Similar results were also reported by [10,12] .
Conclusion
It is concluded that The inorganic and organic fertilizers or manures along with bio-fertilizers alone or in combination were found to have significant effect on growth characters as compared to RDF treatment. It is evident from Table 1 and table 2 that among all the twelve treatments, T 12 {100% RDF through organic manures (50% RDF through vermicompost+50% RDF through FYM) + Bio-fertilizers (Rhizobium 25 g kg -1 seed + PSB 5 kg ha -1 )}. recorded the highest Number of pods per cluster (8.11), Number of clusters per plant (26.12), Number of marketable clusters plot -1 (435.66), Fresh weight of clusters (31.99 g) Fresh weight of pod per cluster (30.09 g), Yield of pods per plant (808.50g), Length of raceme (12.54 cm), Length of pod (10.46 cm), Diameter of pod (1.11 cm), Fresh weight of pod (7.03g), Yield of marketable green pods (11053.07 kg/ha), Benefit-cost ratio 3.21. The reason might be due to higher availability of nutrients as a result of integration of organic and inorganic sources with bio-fertilizers Pusa Navbahar Varity cluster bean. hence above treatment recommended to the farmers like agro climatic zone south-western semi arid region U.P.
| Treatment | Length of raceme (cm) | — | — | Length of pod (cm) | — | — | Diameter of pod (cm), | — | — | Fresh weight of pod (g) | — | — | Yield of marketable green pods (kg/ha) | — | — | Benefit-cost ratio (b: c) | — | — |
|---|---|---|---|---|---|---|---|---|---|---|---|---|---|---|---|---|---|---|
| 2021 | 2022 | Pooled | 2021 | 2022 | Pooled | 2021 | 2022 | Pooled | 2021 | 2022 | Pooled | 2021 | 2022 | Pooled | 2021 | 2022 | Mean | |
| T1 | 9.54 | 9.33 | 9.53 | 6.46 | 6.46 | 6.46 | 0.71 | 0.72 | 0.71 | 3.34 | 3.28 | 3.31 | 7521.18 | 7474.66 | 7497.92 | 2.10 | 2.08 | 2.09 |
| T2 | 9.77 | 9.76 | 9.77 | 7.17 | 7.11 | 7.14 | 0.80 | 0.82 | 0.81 | 3.90 | 4.23 | 4.06 | 8014.33 | 7873.79 | 7960.84 | 2.28 | 2.22 | 2.26 |
| T3 | 11.43 | 11.36 | 11.40 | 9.04 | 9.22 | 9.13 | 0.93 | 0.92 | 0.92 | 5.07 | 5.35 | 5.21 | 9542.93 | 9465.33 | 9504.13 | 1.77 | 1.74 | 1.76 |
| T4 | 11.46 | 11.42 | 11.44 | 9.20 | 9.24 | 9.22 | 0.92 | 0.93 | 0.92 | 5.11 | 5.25 | 5.18 | 9615.60 | 9523.14 | 9569.37 | 1.04 | 1.02 | 1.03 |
| T5 | 10.15 | 10.13 | 10.14 | 7.43 | 7.60 | 7.52 | 0.77 | 0.84 | 0.81 | 4.46 | 4.19 | 4.32 | 8163.66 | 8106.00 | 8134.83 | 2.21 | 2.18 | 2.19 |
| T6 | 10.27 | 10.29 | 10.28 | 7.50 | 7.87 | 7.69 | 0.80 | 0.86 | 0.83 | 4.68 | 4.57 | 4.62 | 8218.11 | 8144.96 | 8181.53 | 2.23 | 2.20 | 2.21 |
| T7 | 10.47 | 10.45 | 10.46 | 8.16 | 8.09 | 8.13 | 0.82 | 0.87 | 0.84 | 4.87 | 4.82 | 4.84 | 8267.13 | 8219.44 | 8243.29 | 2.16 | 2.14 | 2.15 |
| T8 | 10.76 | 10.87 | 10.81 | 8.30 | 8.70 | 8.50 | 0.85 | 0.88 | 0.86 | 4.94 | 4.99 | 4.96 | 8397.16 | 8379.80 | 8388.48 | 2.29 | 2.28 | 2.29 |
| T9 | 11.86 | 11.61 | 11.74 | 9.50 | 9.53 | 9.52 | 0.95 | 0.99 | 0.97 | 6.23 | 6.07 | 6.15 | 9710.36 | 9611.23 | 9660.80 | 1.72 | 1.69 | 1.71 |
| T10 | 11.93 | 11.79 | 11.86 | 9.60 | 9.70 | 9.65 | 0.96 | 0.97 | 0.96 | 6.27 | 6.39 | 6.33 | 9800.83 | 9700.33 | 9750.48 | 1.03 | 1.01 | 1.02 |
| T11 | 12.37 | 12.02 | 12.19 | 9.74 | 9.89 | 9.81 | 1.00 | 1.01 | 1.00 | 6.47 | 6.31 | 6.39 | 10736.36 | 10327.67 | 10532.01 | 3.27 | 3.11 | 3.20 |
| T12 | 12.71 | 12.37 | 12.54 | 10.38 | 10.54 | 10.46 | 1.11 | 1.10 | 1.11 | 6.81 | 7.25 | 7.03 | 11205.80 | 10900.33 | 11053.07 | 3.28 | 3.14 | 3.21 |
| S.Em+/- | 0.081 | 0.07 | 0.07 | 0.21 | 0.21 | 0.15 | 0.02 | 0.03 | 0.02 | 0.11 | 0.27 | 0.14 | 153.40 | 123.69 | 139.34 | 2.10 | 2.08 | 2.09 |
| CD at 5% | 0.23 | 0.22 | 0.15 | 0.63 | 0.61 | 0.43 | 0.08 | 0.09 | 0.06 | 0.32 | 0.81 | 0.42 | 449.91 | 362.78 | 280.82 | 2.28 | 2.22 | 2.26 |
Table text extracted from the original PDF; superscript letters are shown inline. The original table image is below.
View original table image
| Treatment | Number of pods per cluster | — | — | Number of clusters per plant | — | — | Number of marketable clusters | — | — | Fresh weight of clusters (g) | — | — | Fresh weight of pod per cluster (g) | — | — | Yield of pods per plant (g) | — | — |
|---|---|---|---|---|---|---|---|---|---|---|---|---|---|---|---|---|---|---|
| 2021 | 2022 | Pooled | 2021 | 2022 | Pooled | 2021 | 2022 | Pooled | 2021 | 2022 | Pooled | 2021 | 2022 | Pooled | 2021 | 2022 | Pooled | |
| T1 | 3.99 | 4.15 | 4.07 | 20.66 | 20.33 | 20.49 | 325.66 | 324.66 | 325.16 | 24.99 | 25.03 | 25.01 | 20.94 | 20.98 | 20.96 | 343.01 | 348.67 | 345.84 |
| T2 | 4.70 | 4.94 | 4.82 | 22.15 | 21.04 | 21.77 | 337.33 | 332.66 | 335.00 | 26.36 | 25.95 | 26.16 | 22.11 | 22.11 | 22.11 | 404.95 | 419.57 | 412.26 |
| T3 | 6.44 | 6.14 | 6.29 | 24.03 | 24.33 | 24.18 | 411.00 | 411.66 | 411.33 | 28.33 | 28.44 | 28.38 | 27.38 | 27.37 | 27.37 | 577.44 | 590.92 | 584.18 |
| T4 | 6.25 | 6.11 | 6.18 | 24.22 | 24.22 | 24.22 | 414.66 | 414.33 | 414.50 | 28.36 | 28.44 | 28.40 | 27.36 | 27.37 | 27.36 | 587.60 | 601.06 | 594.33 |
| T5 | 4.99 | 5.03 | 5.01 | 22.21 | 22.55 | 22.38 | 375.00 | 374.33 | 374.66 | 26.81 | 26.04 | 26.42 | 24.55 | 24.53 | 24.54 | 452.52 | 455.30 | 463.91 |
| T6 | 5.22 | 5.11 | 5.16 | 22.66 | 22.88 | 22.77 | 377.33 | 375.66 | 376.50 | 26.66 | 26.40 | 26.53 | 25.25 | 25.63 | 25.44 | 505.82 | 506.9 | 505.95 |
| T7 | 5.33 | 5.33 | 5.33 | 22.88 | 23.44 | 23.16 | 380.33 | 377.33 | 378.83 | 27.18 | 27.44 | 27.31 | 26.08 | 26.08 | 25.73 | 514.34 | 535.39 | 524.86 |
| T8 | 5.14 | 5.36 | 5.25 | 23.44 | 23.33 | 23.38 | 383.66 | 382.33 | 383.00 | 27.99 | 28.36 | 28.18 | 25.59 | 25.38 | 26.59 | 555.66 | 545.36 | 550.51 |
| T9 | 7.07 | 7.00 | 7.03 | 24.44 | 24.77 | 24.60 | 417.33 | 415.66 | 416.50 | 29.33 | 29.70 | 29.51 | 28.33 | 26.60 | 28.46 | 695.27 | 703.37 | 699.32 |
| T10 | 7.10 | 7.11 | 7.10 | 24.36 | 24.66 | 24.51 | 419.00 | 418.66 | 418.83z | 29.77 | 29.81 | 29.79 | 28.44 | 28.60 | 28.40 | 712.00 | 711.56 | 711.78 |
| T11 | 7.11 | 7.33 | 7.22 | 24.99 | 25.22 | 25.10 | 429.00 | 425.00 | 427.00 | 30.55 | 30.88 | 30.71 | 28.99 | 28.37 | 28.99 | 755.85 | 751.85 | 753.86 |
| T12 | 8.00 | 8.22 | 8.11 | 25.70 | 26.55 | 26.12 | 434.66 | 436.66 | 435.66 | 31.88 | 32.11 | 31.99 | 29.81 | 30.36 | 30.09 | 810.81 | 806.20 | 808.50 |
| S.Em+/- | 0.22 | 0.19 | 0.14 | 0.21 | 0.28 | 0.25 | 1.27 | 1.41 | 0.95 | 0.27 | 0.28 | 0.19 | 0.24 | 0.27 | 0.27 | 3.42 | 3.88 | 3.65 |
| CD at 5% | 0.66 | 0.56 | 0.42 | 0.62 | 0.83 | 0.50 | 3.72 | 4.15 | 2.72 | 0.81 | 0.82 | 0.56 | 0.71 | 0.81 | 0.81 | 10.03 | 11.38 | 10.42 |
Table text extracted from the original PDF; superscript letters are shown inline. The original table image is below.
View original table image
References
17 in the original paper- Hymowitz T, Upadhya MD. The chromosome number of Cyamopsis serrata Schinz. Curr Sci. 1963;32:427428.
- Taub.] to organic fertilizers and different levels of sulphur for vegetable purpose. Int J Agric Sci. 2010;6(2):456-458.
- Masanta S, Biswas S. Effect of various nutrient management practices on productivity, soil fertility status and water use efficiency of French bean grown under homestead condition in Nadia district of West Bengal. J Crop Weed. 2009;5(2):50-52.
- Desh SK, Ansaba V, Tripathy L, Pathak. Effect of integrated nutrient management on growth, yield and yield attributing parameters of French bean (Phaseolus vulgaris L.). Pharma Innov J. 2019;8(11):98-100.
- Sharma U, Arun A, David, Singh U. Effect of integrated nutrient management on growth and yield of cluster bean (Cyamopsis tetragonoloba) var. Pusa Navbahar. Int J Curr Microbiol Appl Sci. 2018;7(7):350-353.
- Brahmbhatt JH, Acharya SK, Patel GS, Thakar C, Solanki NR. Effect of organic nutrient management on growth and yield of cluster bean (Cyamopsis tetragonoloba L.). Legume Res. 2021;3.
- Patel H, Parmar V, Patel P, Mavdiya V. Effect of organic fertilizers on yield and yield attributes of cluster bean (Cyamopsis tetragonoloba L.) cv. Pusa Navbahar. Int J Chem Stud. 2018;6(4):1797-1799.
- Jilen B, Pugalendhi L, Devi HUN, Priya RS. Evaluation of cluster bean (Cyamopsis tetragonoloba L.) genotypes for vegetable pod yield and guar gum production. Int J Environ Clim Change. 2022;12(12):29-37.
- Parmar SK, Satodiya BN, Thakur K. Effect of spacing and integrated nutrient management on yield attributes, yield and quality of cluster bean (Cyamopsis tetragonoloba L. Taub) cv. Pusa Navbahar. Int J Chem Stud. 2019;7(5):2502-2505.
- Nandini, Thomas T, Singh AK. Response of integrated nutrients on soil health and yield attributes of cluster bean (Cyamopsis tetragonoloba L.) cv. Neelam. Int J Plant Soil Sci. 2023;35(14):216-227.
- Tejaswini A, Vipan MP, Cherish SN. Effect of organic and inorganic fertilizers on plant growth and pod yield of cluster bean (Cyamopsis tetragonoloba) cv. MDU-1. Int J Plant Soil Sci. 2022;34(20):810-816.
- Ashoka N, Raju R, Ravi Y, Harshavardhan M, Hongal MS, Pushpa P. Economic analysis of cluster bean [Cyamopsis tetragonoloba (L.) Taub] entrepreneurs in Karnataka. Legume Res. 2021;44(12):1465-1469.
- Nuray M, Muftuoglu, Cafer T, Mevlut A, Mahmut K. Yield and nutritional characteristics of edible cluster bean genotypes. Turk J Field Crops. 2019;24(1):91-97.
- Gamit U, Bhanderi DR, Tank RV, Vaghela KS. Effect of integrated nutrient management on growth and yield attributes of cluster bean under South Gujarat conditions. Pharma Innov J. 2022;11(9S):1173-1178.
- Ramanjineyulu M, Rao MS, Basavaraj T, Akhila K, Vaishnavi SV. Response of integrated nutrient management on growth and yield of cluster bean (Cyamopsis tetragonoloba L.) under semi arid tracts of Andhra Pradesh, India. Eur J Nutr Food Saf. 2024;16(9):1-10.
- Dharmendra KS, Amreen H, Tarence T, Arun AD, Anil C, Amrita S. Implication of integrated nutrient management on soil properties of cluster bean. Pharma Innov J. 2022;11(6):151-154.
- Changkiri M, Adhikary NK, Jha A, Kanaujia SP. Integrated nutrient management of French bean (Phaseolus vulgaris L.) in subtropical humid zone of Nagaland, India. Legume Res. 2024;47(5):845-849.