
Research article · 2026 · Full text
International Journal of Geography Geology and EnvironmentLevel of agricultural performance in Ahmednagar District: A geographical analysis
Volume 8(9) · Pages 59–64 · DOI: 10.22271/27067483.2026.v8.i9a.846 ↗
Research areasAgricultural Economics and PracticesAgricultural Development and ManagementAgricultural Innovations and Practices
Abstract
Author-writtenAgricultural productivity is closely linked with technological change in farming. This study examines the relationship between agricultural technology and agricultural performance in Ahmednagar district using primary and secondary information. The analysis considers the role of improved farm practices, irrigation technologies, inputs and other technological facilities in shaping agricultural performance. The findings indicate a positive association between agricultural technology and agricultural performance in the study region.
Summary
Source-checkedPlain-language reading of the full paper, prepared with AI and checked against the text. Each point links to the authors' own words.
Why it matters
- Agricultural productivity is a key indicator of a region's overall agricultural health and is essential for planning rural development. View evidence ↗
- Improving productivity is increasingly critical in India because agriculture remains a major economic pillar while cultivated land is under pressure. View evidence ↗
- Agricultural productivity is influenced by a combination of physical, socio-economic, technological, and organizational factors. View evidence ↗
The question
- The study aims to analyze the spatial and temporal patterns of agricultural performance in the Ahmednagar district and determine the absolute changes over time. View evidence ↗
- The research seeks to evaluate how agricultural technology impacts agricultural performance within the study area. View evidence ↗
What they did
- The study was conducted in the Ahmednagar district, which covers 17,048 square km and is divided into 14 tahsils. View evidence ↗
- The analysis utilized both primary and secondary data spanning the period from 1991 to 2015. View evidence ↗
- Agricultural performance was regionalized using a weighted composite index based on the quantitative procedure developed by Jasbir Singh et al. (1990). View evidence ↗
What they found
- The composite index of agricultural performance varied from 41.43 to 221.81 in 1991 and from 50.14 to 173.29 in 2011. View evidence ↗
- In 1991, Shrirampur and Rahuri were the high-performing tahsils, both exceeding an index value of 159.52. View evidence ↗
- Akole, Kopargaon, and Rahata showed the most significant gains (over 20 index points), which the study links to drip irrigation and higher HYV seed coverage. View evidence ↗
- There is a moderate positive correlation (r = 0.5909) between agricultural technology and agricultural performance. View evidence ↗
- Agricultural technology explains 34.92% of the variation in agricultural performance, while 65.08% is attributed to other factors. View evidence ↗
- The regression analysis (y = 0.5628x + 45.474) indicates that every one-unit increase in the technology index results in an estimated 0.5628-unit increase in performance. View evidence ↗
What it means
- The authors conclude that spatial differences in agricultural performance are driven by terrain, soil quality, climate, irrigation, fertilizer use, HYV coverage, and access to modern equipment. View evidence ↗
Visual summary
3 visualsIllustrations explain the paper; charts are replotted from the paper's own table values.
Technology vs Performance Relationship
AI-generated conceptual illustration (Agricultural fields in Ahmednagar District, India). It explains the idea and does not show study data.
View source evidence ↗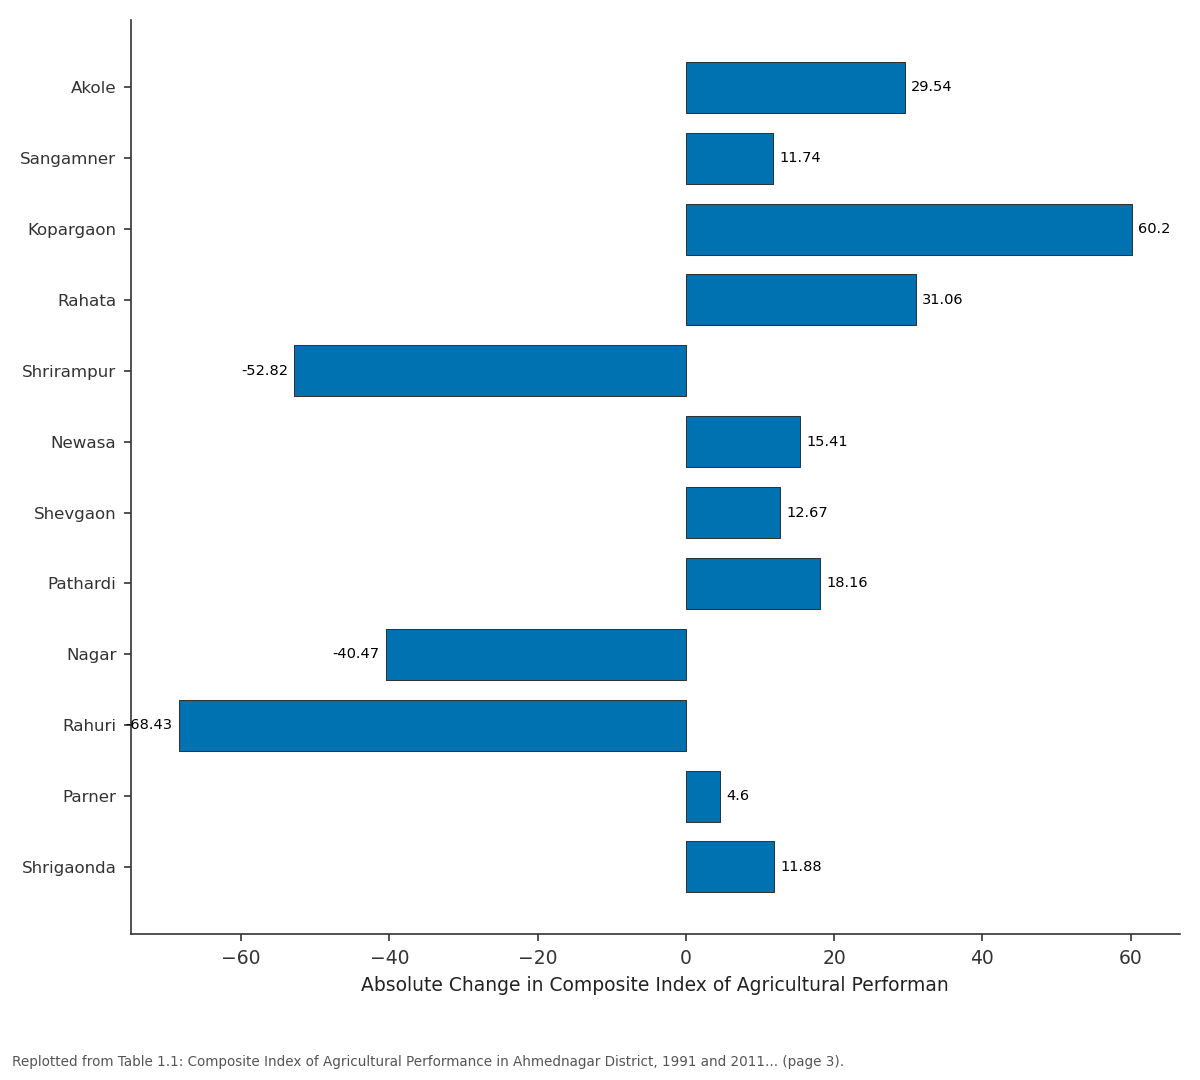
Absolute Change in Composite Index of...: Akole vs Sangamner vs Kopargaon vs Rahata vs Shrirampur
Replotted from Table 1 (page 3) of the original paper. Every bar is the paper's own table value.
View source evidence ↗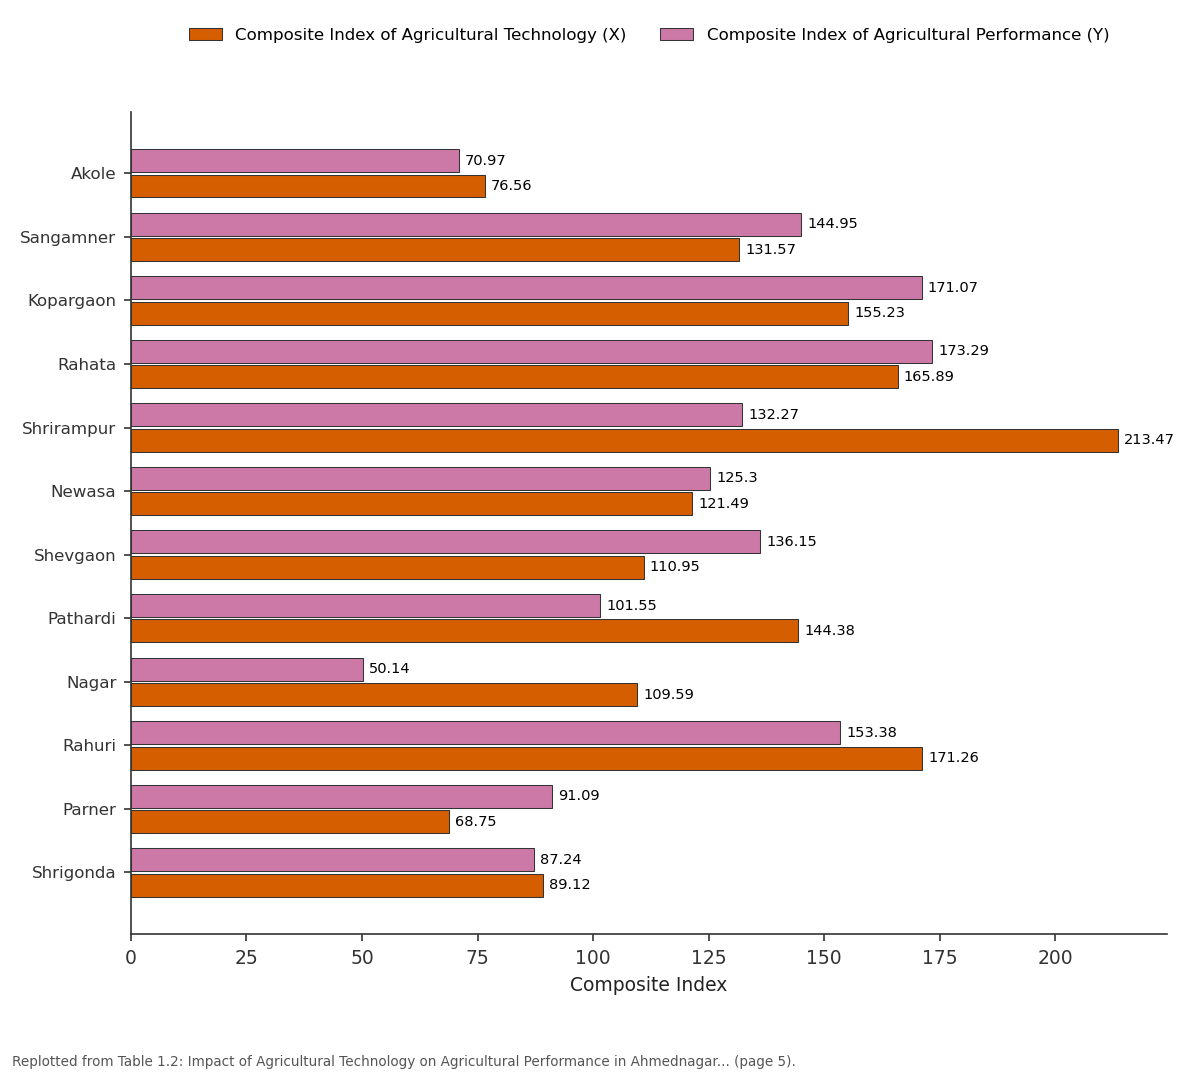
Composite Index of Agricultural Technology... and Composite Index of Agricultural Performance...: Akole vs Sangamner vs Kopargaon vs Rahata vs Shrirampur
Replotted from Table 1 (page 5) of the original paper. Every bar is the paper's own table value.
View source evidence ↗Figures & tables
From the original paper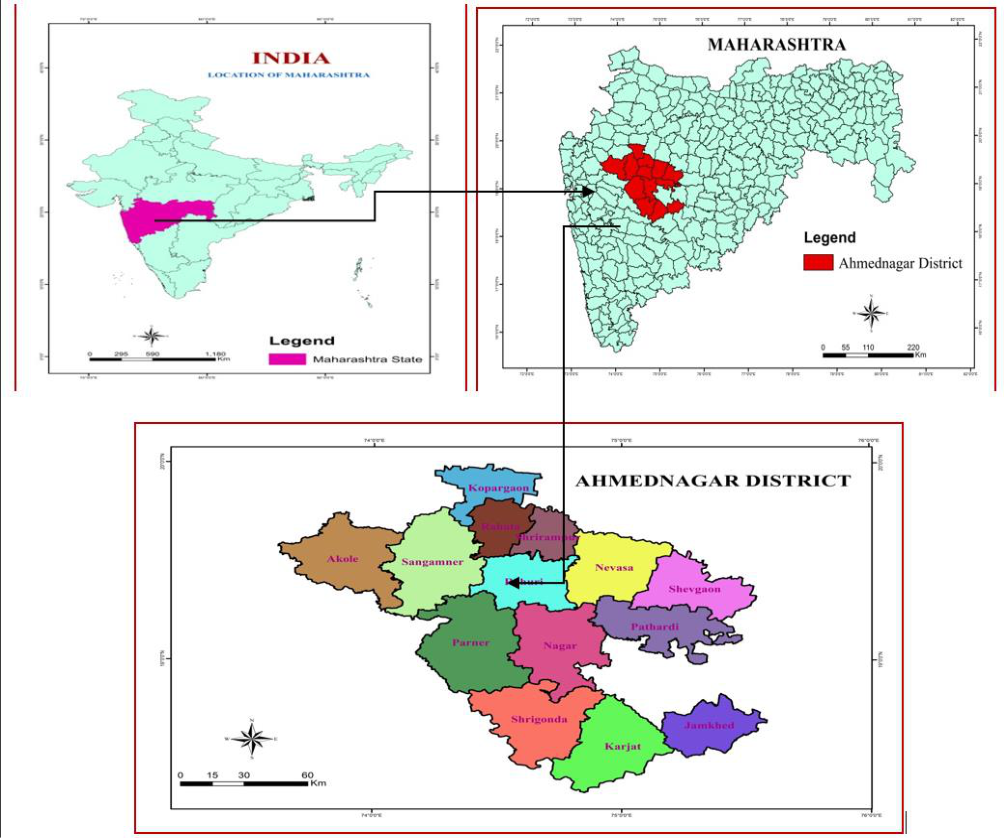 Figure 1
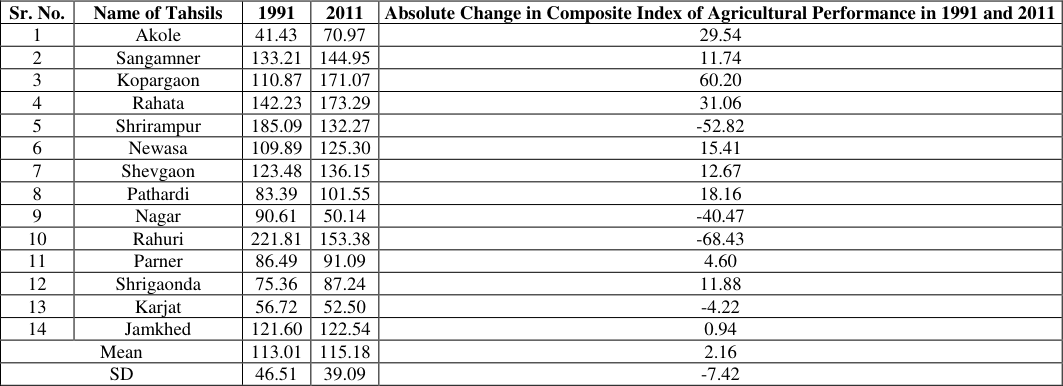 Table 1
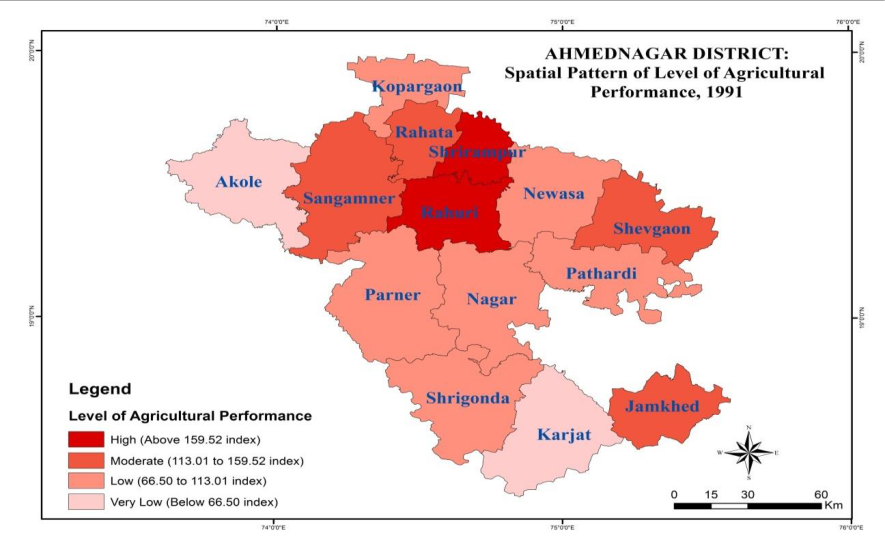 Figure 1
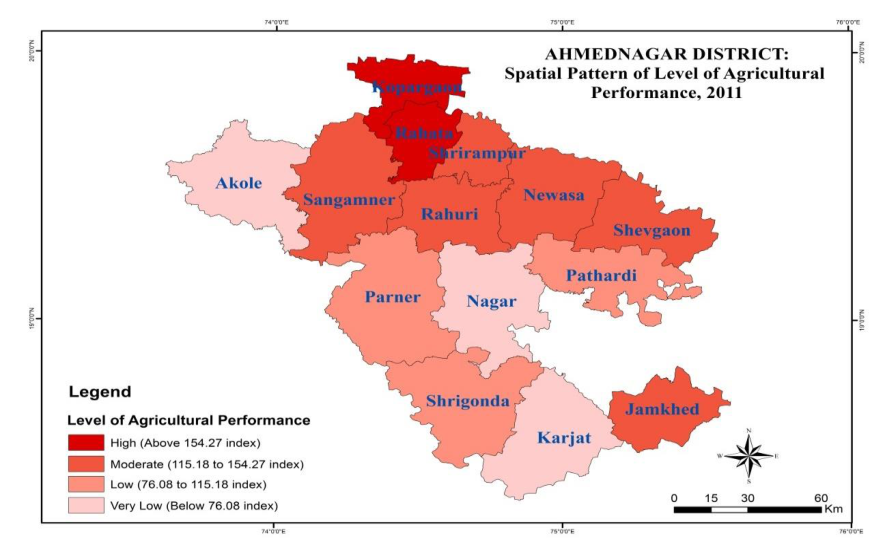 Fig.1
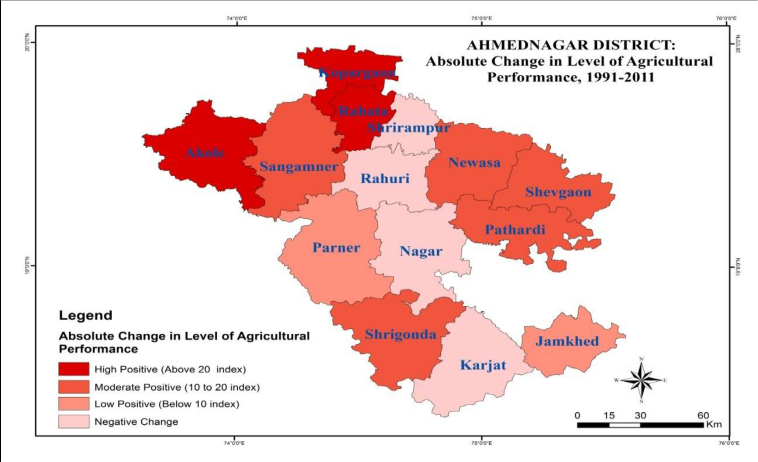 Fig.1
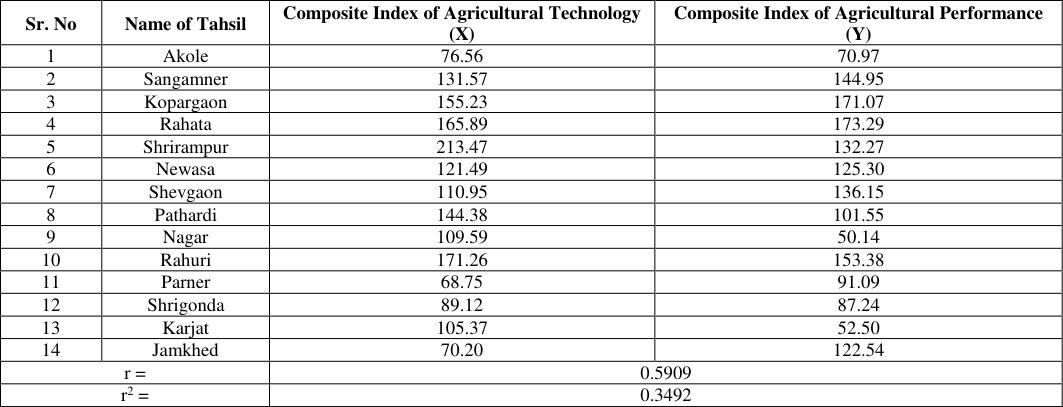 Table 1
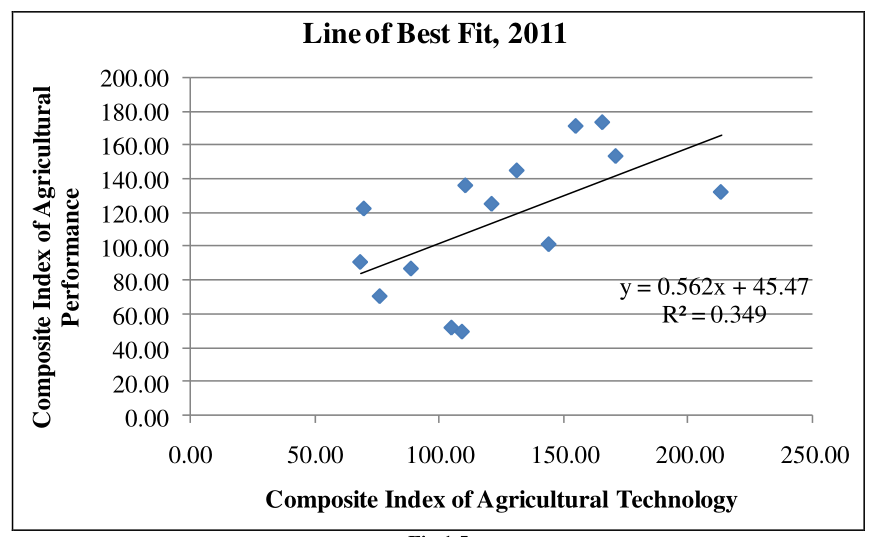 Fig.1
Introduction
Agricultural productivity provides an important measure of the overall agricultural condition of a region and is useful for rural-development planning. Agriculture continues to occupy a major position in the Indian economy, while pressure on cultivated land makes improvement in productivity increasingly important. Productivity is shaped by physical, socio-economic, technological and organizational factors. Weather conditions, economic limitations and conventional farming practices may restrict the adoption of improved technology and thereby influence production.
Such differences contribute to spatial inequalities in agricultural productivity (Singh and Dhillon, 2000). Agricultural productivity can therefore be understood as the extent to which the physical, social, cultural, economic, technical and organizational characteristics of a region are utilized for agricultural production (Singh S., 2012)). Singh, Jasbir, et al. (1990) proposed a weighted composite approach for assessing agricultural performance. The present study applies this method to Ahmednagar district and examines differences among the tahsils for the selected period.
Study Area The present study Ahmednagar district has been selected as a study area. It extends between 18° 20´ and 19° 59´ north latitudes and 73° 40´ to 75° 43´ east longitudes located in part in the upper Godavari basin. The district is very dense in shape and length of 200 km. a width of 210 km. This study region is divided into there are three physical divisions namely, first Sahyadri moutons ranges i.e.
Kalsubai, Adula, Baleshwar and Harishchandragad, second Plateau third plains area. The Godavari, Bhima River is the main rivers in this district with the major tributaries are Paravara, Mula, Sina, Dhora, Kukdi ect. And the recharge (water available) of rivers is mainly depending on rainfall in western ghat. Ahmednagar district occupies 17,048 square km geographical area.
The administratively there are divided into 14 tahsils. The average annual rainfalls is 578.8 mm. (22.79”) and mean daily maximum temperatures is 39 °C and mean daily minimum temperature is 11.7° C. In study region 71.10 percent area under cultivation area out of them 32.40 percent is irrigated and 67.60 percent rain fed or rain shadow area. According to 2011 census population is 45, 43,083 in which male and female are 2,348,802 and 2,194,281 correspondingly.
The density of population was 266 persons per square kilometers. https://www.geojournal.net Fig 1: Location Map of Ahmednagar District, Maharashtra, India Objectives 1. To Study the Spatio-Temporal Pattern of Level of Agricultural Performance in Study area 2. To Analysis the Absolute Change in Level of Agricultural Performance in Study area 3. To Find out the Impact of Agricultural Technology on Agricultural Performance in Study area Database: The research is based on primary and secondary information covering 1991-2015.
District Gazetteers were consulted for background and historical data. Information on farm implements, fertilizers, pesticides, polyhouses, farm ponds, drip and sprinkler irrigation and Jalyukt Shivar was obtained from the District Superintendent Agricultural Office and the Agricultural Department of Zilla Parishad, Ahmednagar. Data on cold-storage facilities came from the District Industry Office. Information concerning modern farm machinery and agricultural technology was compiled from the Directorate of Agriculture, Ahmednagar, Socio- Economic Reviews and Zilla Parishad records.
Primary information was collected through stratified random sampling. Published and unpublished research studies were also used. The collected material was organized through tables and maps and interpreted using appropriate analytical procedures.
Methodology
The regionalization of agricultural performance follows the quantitative procedure developed by Jasbir Singh et al. (1990). The weighted composite level of agricultural performance is used to compare the position of each tahsil with the district as a whole. respectively. The summed up location quotients (LQs) were divided by the number of crops considered in the enumeration unit and multiplied by 100 to obtain the Weighted Composite Level of Agricultural Performance. The abridged equation is: Where, Vw denotes weighted composite index of regional inequality in agricultural performance; Y means crop-yield of crop ‘a’ in kilograms per hectare; P implies cropland occupancy of crop ‘a’ in percentage of gross cropped area; a, b, c subscripts denote crops considered; e and r subscripts denote enumeration unit (tahsil) and entire region (district) https://www.geojournal.net
Results And Discussion
A) Spatio-Temporal Pattern of Agricultural Performance Table 1.1 shows considerable spatial variation in agricultural performance. The composite index ranges from 41.43 to 221.81 in 1991 and from 50.14 to 173.29 in 2011. For both years, tahsils are grouped into high, moderate, low and very-low categories using the mean and standard deviation. In 1991, Shrirampur and Rahuri occupied the high- performance category, with values above 159.52.
| Sr. No | Name of Tahsil | Composite Index of Agricultural Technology (X) | Composite Index of Agricultural Performance (Y) |
|---|---|---|---|
| 1 | Akole | 76.56 | 70.97 |
| 2 | Sangamner | 131.57 | 144.95 |
| 3 | Kopargaon | 155.23 | 171.07 |
| 4 | Rahata | 165.89 | 173.29 |
| 5 | Shrirampur | 213.47 | 132.27 |
| 6 | Newasa | 121.49 | 125.30 |
| 7 | Shevgaon | 110.95 | 136.15 |
| 8 | Pathardi | 144.38 | 101.55 |
| 9 | Nagar | 109.59 | 50.14 |
| 10 | Rahuri | 171.26 | 153.38 |
| 11 | Parner | 68.75 | 91.09 |
| 12 | Shrigonda | 89.12 | 87.24 |
| 13 | Karjat | 105.37 | 52.50 |
| 14 | Jamkhed | 70.20 | 122.54 |
| r = | 0.5909 | ||
| r2 = | 0.3492 |
Table text extracted from the original PDF; superscript letters are shown inline. The original table image is below.
View original table image
| Sr. No. | Name of Tahsils | 1991 | 2011 | Absolute Change in Composite Index of Agricultural Performance in 1991 and 2011 |
|---|---|---|---|---|
| 1 | Akole | 41.43 | 70.97 | 29.54 |
| 2 | Sangamner | 133.21 | 144.95 | 11.74 |
| 3 | Kopargaon | 110.87 | 171.07 | 60.20 |
| 4 | Rahata | 142.23 | 173.29 | 31.06 |
| 5 | Shrirampur | 185.09 | 132.27 | -52.82 |
| 6 | Newasa | 109.89 | 125.30 | 15.41 |
| 7 | Shevgaon | 123.48 | 136.15 | 12.67 |
| 8 | Pathardi | 83.39 | 101.55 | 18.16 |
| 9 | Nagar | 90.61 | 50.14 | -40.47 |
| 10 | Rahuri | 221.81 | 153.38 | -68.43 |
| 11 | Parner | 86.49 | 91.09 | 4.60 |
| 12 | Shrigaonda | 75.36 | 87.24 | 11.88 |
| 13 | Karjat | 56.72 | 52.50 | -4.22 |
| 14 | Jamkhed | 121.60 | 122.54 | 0.94 |
| Mean | 113.01 | 115.18 | 2.16 | |
| SD | 46.51 | 39.09 | -7.42 |
Table text extracted from the original PDF; superscript letters are shown inline. The original table image is below.
View original table image
Fertile soils, surface irrigation and agro-based activities are identified as factors supporting farm investment and the use of improved seeds and implements. Sangamner, Rahata, Shevgaon and Jamkhed fell in the moderate group, between 113.01 and 159.52. Table 1.1: Composite Index of Agricultural Performance in Ahmednagar District, 1991 and 2011 (Based on Jasbir Singh’s Method) Sr. No.
Name of Tahsils 1991 2011 Absolute Change in Composite Index of Agricultural Performance in 1991 and 2011 1 Akole 41.43 70.97 29.54 2 Sangamner 133.21 144.95 11.74 3 Kopargaon 110.87 171.07 60.20 4 Rahata 142.23 173.29 31.06 5 Shrirampur 185.09 132.27 -52.82 6 Newasa 109.89 125.30 15.41 7 Shevgaon 123.48 136.15 12.67 8 Pathardi 83.39 101.55 18.16 9 Nagar 90.61 50.14 -40.47 10 Rahuri 221.81 153.38 -68.43 11 Parner 86.49 91.09 4.60 12 Shrigaonda 75.36 87.24 11.88 13 Karjat 56.72 52.50 -4.22 14 Jamkhed 121.60 122.54 0.94 Mean 113.01 115.18 2.16 SD 46.51 39.09 -7.42 Source: Compiled by the researcher on basis of Z.P. Agricultural Department, 2012 and Socio-Economic Abstract of Ahmednagar District, 1991 and 2013. and uneven terrain, shallow soils, limited surface irrigation, lower fertilizer consumption, restricted HYV coverage and inadequate modern farm equipment. Kopargaon, Newasa, Pathardi, Nagar, Parner and Shrigonda were placed in the low category, with index values from 66.50 to 113.01. Akole and Karjat formed the very-low group.
The study relates their lower performance to hilly Fig 1.2: Spatial Pattern of Level of Agricultural Performance in Ahmednagar District, 1991 https://www.geojournal.net Fig.1.3: Spatial Pattern of Level of Agricultural Performance in Ahmednagar District, 2011 B) Absolute Change in Agricultural Performance Comparison of 1991 and 2011 indicates substantial temporal and spatial variation in agricultural productivity. The overall position improved during the period, which is associated in the study with increased agricultural inputs and technological development. Following Jasbir Singh et al. (1990), the change in the agricultural-performance index was assessed for 1991-2011. Most tahsils showed positive change, while Shrirampur, Nagar, Rahuri and Karjat recorded declines.
Akole, Kopargaon and Rahata gained more than 20 index points, associated with greater HYV coverage and technologies such as drip irrigation. Sangamner, Newasa, Shevgaon, Pathardi and Shrigonda registered moderate gains of 10-20 points. In 2011, the tahsil-wise index continued to display marked spatial differences in agricultural performance across Ahmednagar district. Kopargaon and Rahata recorded high agricultural performance, exceeding 154.27.
Their relatively level land, fertile soils and developed irrigation in the Godavari- Pravara basin are associated with greater fertilizer use, wider adoption of HYV seeds and modern farm technology. Sangamner, Shrirampur, Newasa, Shevgaon, Rahuri and Jamkhed were in the moderate class, with index values of 115.18-154.27. Pathardi, Parner and Shrigonda showed low performance, with values between 76.08 and 115.18. Akole, Nagar and Karjat were below 76.08 and therefore belonged to the very-low category.
The earlier factors remain relevant for Akole and Karjat, while adverse climatic conditions are identified for Nagar. Fig.1.4: Absolute Change in the Level of Agricultural Performance in Ahmednagar District, 1991-2011 https://www.geojournal.net Parner and Jamkhed recorded increases of less than 10 points. Their dry and partly hilly conditions, together with limited irrigation, are linked with lower use of HYV seeds and chemical fertilizers. Declines occurred in Shrirampur, Nagar, Rahuri and Karjat.
The study suggests that the first three had comparatively advanced conditions in the base year, reducing the scope for further gains, whereas Karjat remained constrained by drought-prone conditions, limited irrigation, lower HYV coverage and lower fertilizer use. C) Impact of Agricultural Technology on Agricultural Performance Table 1.2 examines the relationship between agricultural technology (X) and agricultural performance (Y). The calculated correlation coefficient is r = 0.5909, representing a moderate positive association between the two variables. The coefficient of determination is 0.3492.
On this basis, the agricultural-technology index accounts for 34.92 percent of the variation in agricultural performance, while the remaining 65.08 percent is associated with other variables. Table 1.2: Impact of Agricultural Technology on Agricultural Performance in Ahmednagar District, 2011 Composite Index of Agricultural Performance Sr. No Name of Tahsil Composite Index of Agricultural Technology (X) (Y) 1 Akole 76.56 70.97 2 Sangamner 131.57 144.95 3 Kopargaon 155.23 171.07 4 Rahata 165.89 173.29 5 Shrirampur 213.47 132.27 6 Newasa 121.49 125.30 7 Shevgaon 110.95 136.15 8 Pathardi 144.38 101.55 9 Nagar 109.59 50.14 10 Rahuri 171.26 153.38 11 Parner 68.75 91.09 12 Shrigonda 89.12 87.24 13 Karjat 105.37 52.50 14 Jamkhed 70.20 122.54 r = 0.5909 r2 = 0.3492 Source: Compiled by the researcher on basis of Z.P. Agricultural Department, 2012 and Socio-Economic Abstract of Ahmednagar District, 1991 and 2013.
Line of Best Fit, 2011 y = 0.562x + 45.47 Performance R² = 0.349 Composite Index of Agricultural 0.00 20.00 40.00 60.00 80.00 100.00 120.00 140.00 160.00 180.00 200.00 0.00 50.00 100.00 150.00 200.00 250.00 Composite Index of Agricultural Technology Fig.1.5 The fitted regression equation is y = 0.5628x + 45.474. The positive slope indicates that a one-unit rise in the agricultural-technology index corresponds to an estimated 0.5628-unit increase in the agricultural-performance index.
Conclusion
The results show that agricultural performance differs substantially among tahsils and between the two years. Shrirampur and Rahuri were in the high category in 1991, while Kopargaon and Rahata occupied that position in 2011. Akole and Karjat were very low in 1991; Akole, Nagar and Karjat were very low in 2011. These differences are related in the study to terrain, soils, climate, irrigation, fertilizer use, HYV coverage and access to modern farm equipment.
The technology-performance analysis produced r = 0.5909 and r² = 0.3492, indicating a moderate positive relationship. https://www.geojournal.net Agricultural technology explains 34.92 percent of the variation in agricultural performance in this analysis, while 65.08 percent is associated with other influences. The fitted equation, y = 0.5628x + 45.474, confirms the positive direction of the relationship.
References
6 in the original paper- Husain M. Systematic Agricultural Geography. Jaipur: Rawat Publications; 2012. p. 244-252.
- Stamp LD. The measurement of agricultural efficiency with special reference to India. Silver Jubilee Souvenir Volume. Indian Geographical Society; 1952. p. 177- 178.
- Vaidyanath V. Agricultural productivity in Andhra Pradesh. National Geographical Journal of India. 1985;31(3):205-207.
- Singh S. Agricultural productivity and agricultural intensity in Rohtas District, Bihar. Inter-ITER T. 2012;1:1-11.
- Singh J, Sandhu DS, Gupta JP. Dynamic of agricultural change: An agricultural atlas of India. New Delhi: Oxford and IBH; 1990. p. 292-293.
- Singh J, Dhillon SS. Agricultural Geography. 2nd ed. New Delhi: Tata McGraw-Hill Publishing Company Ltd.; 2000. p. 238.