
Research article · 2026 · Full text
International Journal of Advanced Chemistry ResearchImpact of organic amendments and biofertilizers on soil chemical properties during cropping period of black turmeric (Curcuma caesia Roxb.) in Konkan region
Volume 8(9) · Pages 19–24 · DOI: 10.33545/26646781.2026.v8.i9a.743 ↗
Research areasAgricultural Science and FertilizationAgriculture, Plant Science, Crop ManagementPlant Growth and Agriculture Techniques
Abstract
Author-writtenA two-year field study was conducted at Wakawali, Maharashtra, to evaluate the effect of organic manures (Poultry Manure, Vermicompost, Neem Cake, Farmyard manure) and biofertilizers (Azotobacter, Azospirillum, Phosphate Solubilizing Bacteria, Vesicular Arbuscular Mycorrhiza) on the chemical properties of a post-harvest lateritic soil matrix. Baseline electrochemical parameters (pH and Electrical conductivity) remained statistically unchanged across treatments due to the high buffering capacity of iron and aluminum oxides in lateritic soils. However, nutrient availability increased significantly. Application of Vermicompost at 12 t/ha paired with Phosphate Solubilizing Bacteria at 5 kg/ha (O2B3) yielded the highest soil organic carbon (12.98 g/kg pooled), available phosphorus (18.73 kg/ha pooled), and available potassium (310.88 kg/ha pooled) by enhancing cation exchange capacity, chelating metal ions and solubilizing mineral lattices. Additionally, Vermicompost at 12 t/ha combined with Azospirillum at 5 kg/ha (O2B2) maximized available nitrogen (291.39 kg/ha pooled). Overall, integrating 12 t/ha vermicompost with targeted bio-inoculants (O2B2 or O2B3) provides a sustainable strategy to restore soil fertility without inducing salinity risks.
Summary
Source-checkedPlain-language reading of the full paper, prepared with AI and checked against the text. Each point links to the authors' own words.
Why it matters
- The Konkan region of Maharashtra has lateritic soils that struggle with high acidity, poor aggregation, and the leaching of nutrients. View evidence ↗
- Black turmeric is a valuable medicinal crop that needs specific soil structures and balanced nutrients to grow high-quality rhizomes. View evidence ↗
- Using organic amendments and biofertilizers is seen as a sustainable alternative to chemical inputs, which can degrade coastal soil ecosystems. View evidence ↗
The question
- The study aimed to evaluate how organic and microbial treatments affect soil fertility and nutrient availability during the cropping period. View evidence ↗
What they did
- A two-year field study in Wakawali, Maharashtra, tested four organic manures (Poultry Manure, Vermicompost, Neem Cake, and Farmyard manure) and four biofertilizers (Azotobacter, Azospirillum, PSB, and VAM). View evidence ↗
- The research used a Factorial Randomized Block Design with three replications. View evidence ↗
- Organic manure doses were 7.5 t/ha for poultry manure, 12 t/ha for vermicompost, 10 t/ha for neem cake, and 30 t/ha for FYM; biofertilizers were applied at 5 kg/ha. View evidence ↗
- Soil samples were collected from a depth of 0-25 cm both before manure application and after the crop was harvested. View evidence ↗
What they found
- Neither the organic manures, biofertilizers, nor their combination caused statistically significant changes in soil pH or electrical conductivity. View evidence ↗
- The combination of 12 t/ha vermicompost and 5 kg/ha PSB (O2B3) resulted in the highest pooled soil organic carbon at 12.98 g/kg. View evidence ↗
- The highest pooled available nitrogen (291.39 kg/ha) was achieved using 12 t/ha vermicompost combined with 5 kg/ha Azospirillum (O2B2). View evidence ↗
- The combination of 12 t/ha vermicompost and 5 kg/ha PSB (O2B3) produced the highest pooled available phosphorus at 18.73 kg/ha. View evidence ↗
- The highest pooled available potassium (310.88 kg/ha) was recorded for the O2B3 treatment (12 t/ha vermicompost and 5 kg/ha PSB). View evidence ↗
- Farmyard manure (FYM) at 30 t/ha resulted in the lowest pooled organic carbon content at 11.36 g/kg. View evidence ↗
What it means
- The authors conclude that combining 12 t/ha of vermicompost with either Azospirillum (O2B2) or PSB (O2B3) is a sustainable way to increase nutrients in lateritic soils without risking salinity. View evidence ↗
Visual summary
3 visualsIllustrations explain the paper; charts are replotted from the paper's own table values.
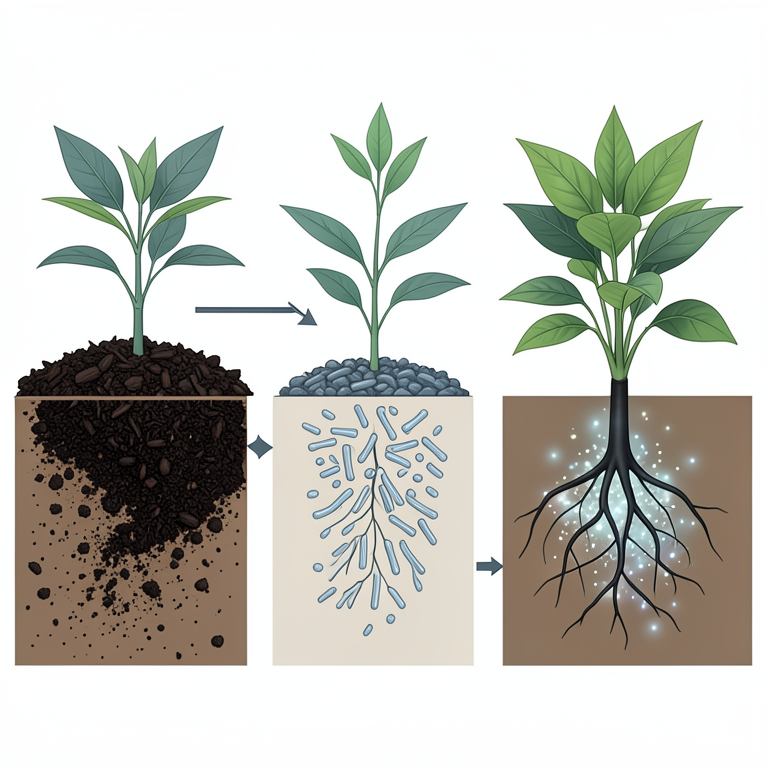
Synergistic Nutrient Enhancement
AI-generated conceptual illustration (Black turmeric (Curcuma caesia Roxb.) plants in soil). It explains the idea and does not show study data.
View source evidence ↗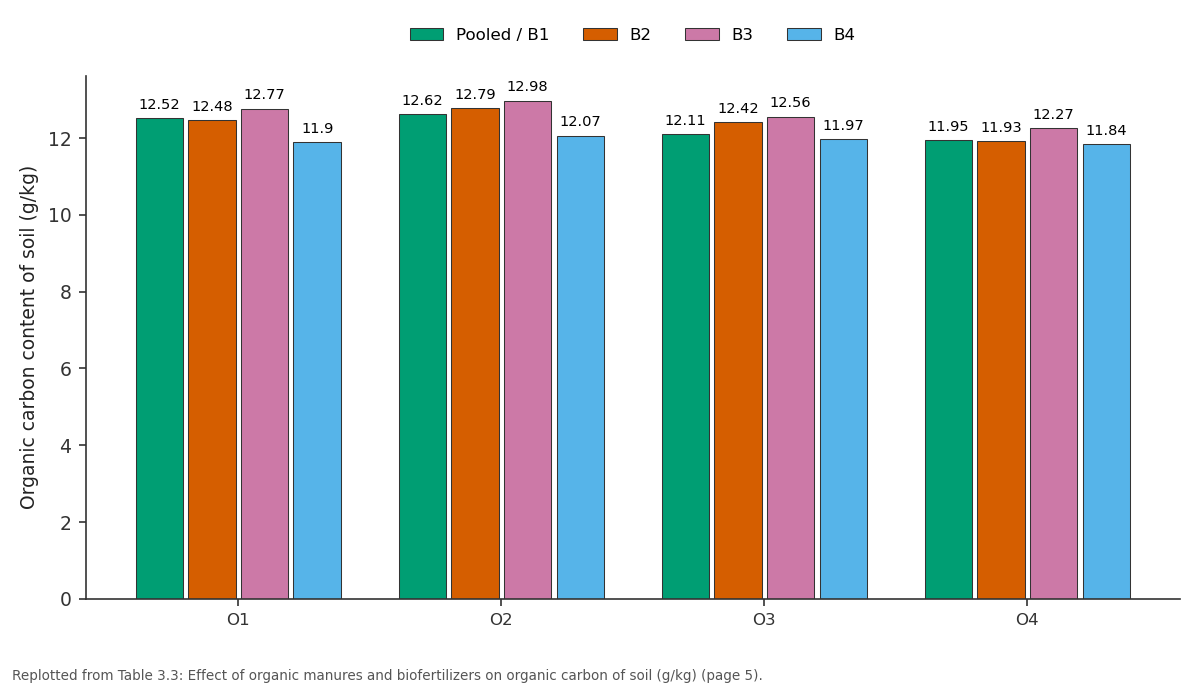
Pooled / B1 and B2 and more: O1 vs O2 vs O3 vs O4
Replotted from Table 3 (page 5) of the original paper. Every bar is the paper's own table value.
View source evidence ↗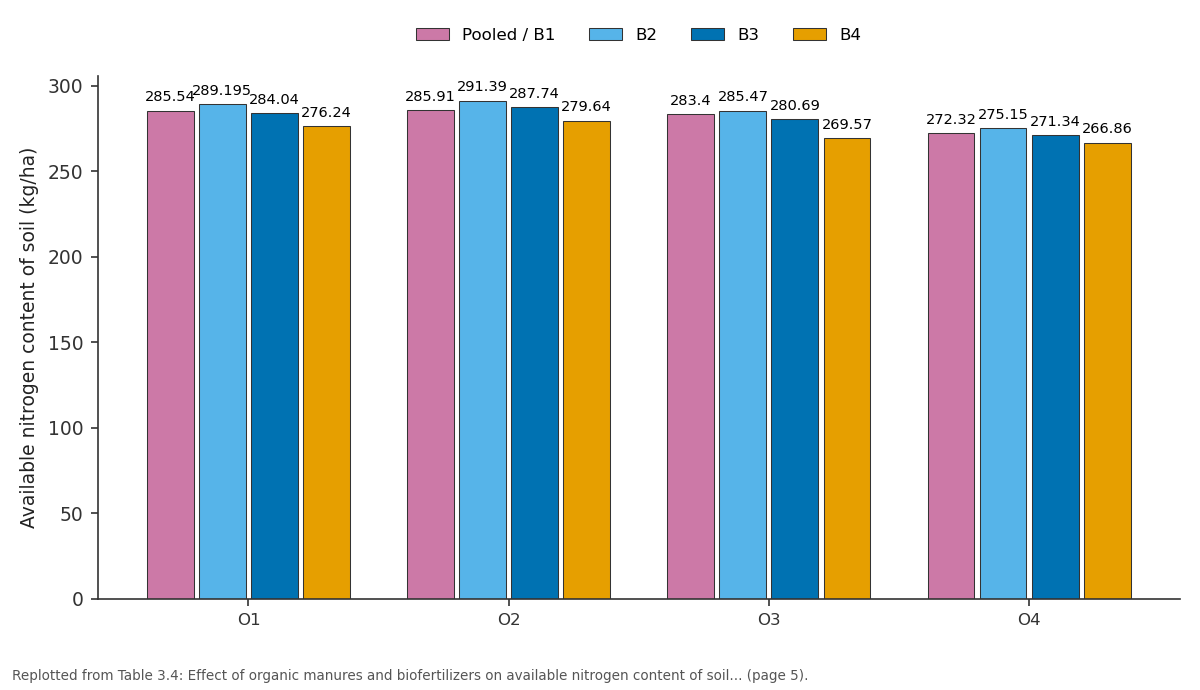
Pooled / B1 and B2 and more: O1 vs O2 vs O3 vs O4
Replotted from Table 3 (page 5) of the original paper. Every bar is the paper's own table value.
View source evidence ↗Figures & tables
From the original paper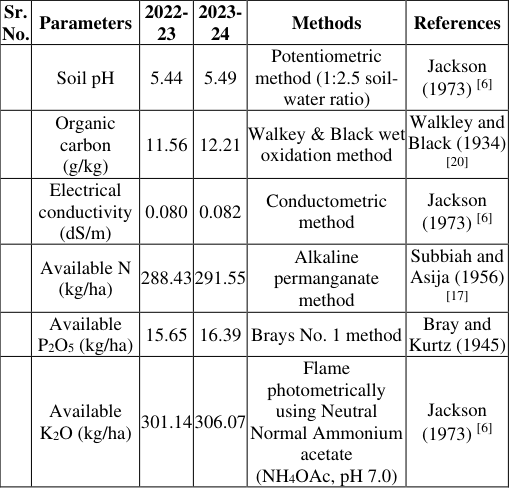 Table 1
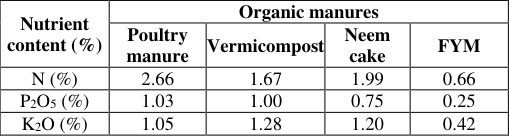 Table 2
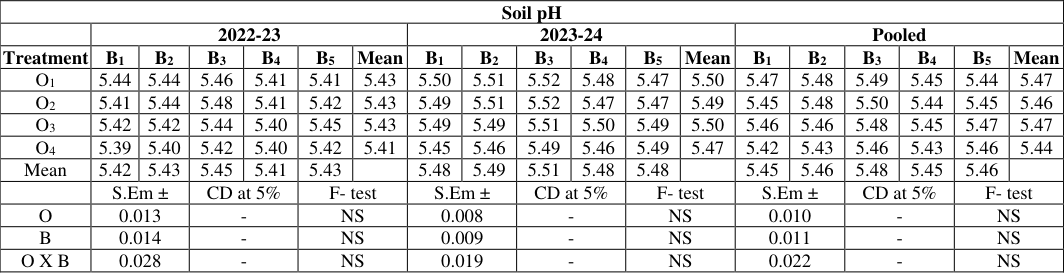 Table 3
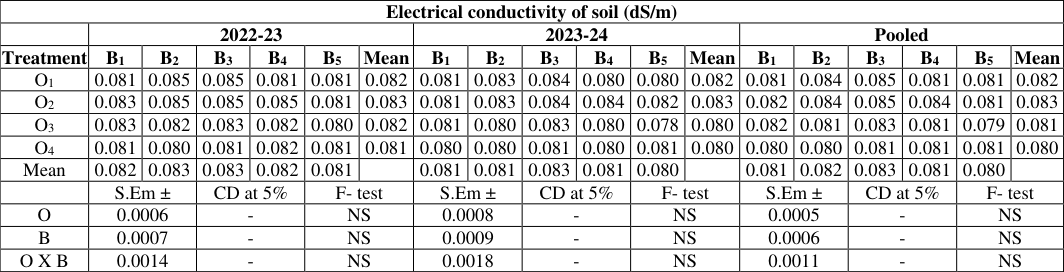 Table 3
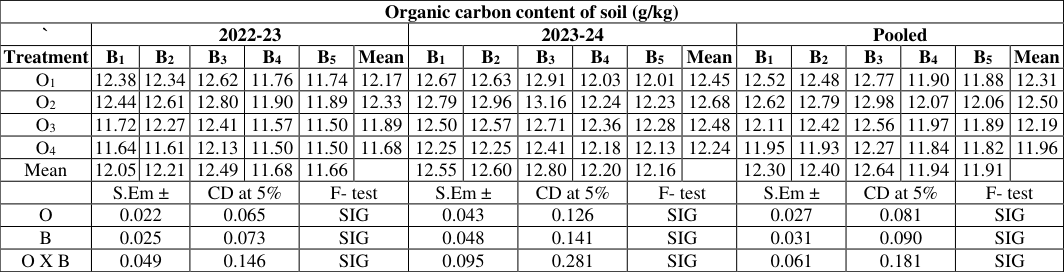 Table 3
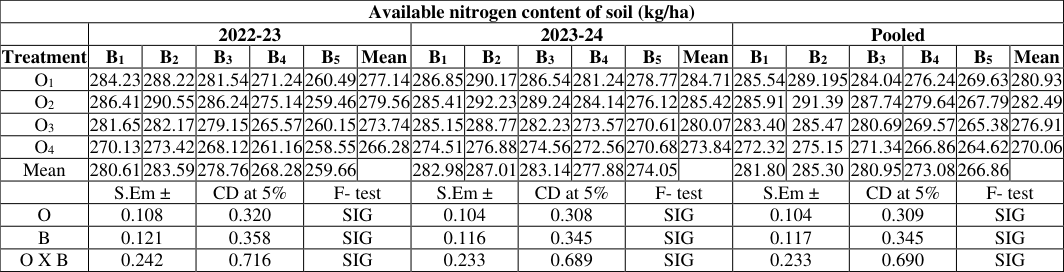 Table 3
 Table 3
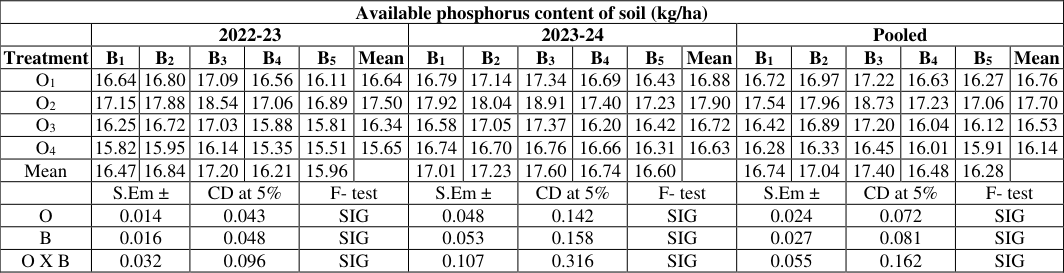 Table 3
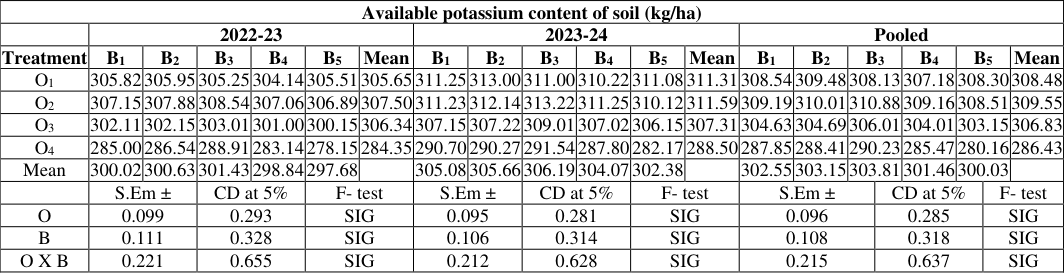 Table 3
Introduction
The coastal Konkan region of Maharashtra, characterized by high rainfall, tropical climate and predominant lateritic soils, faces challenges such as high acidity, nutrient leaching and poor soil aggregation. Black turmeric (Curcuma caesia Roxb.), a high-value medicinal rhizomatous crop known for its rich phytochemical profile, requires balanced nutrient management and superior soil physical structure to achieve optimal rhizome growth and quality. Continuous reliance on chemical inputs can degrade the delicate coastal soil ecosystem; thus, integrating organic amendments and biofertilizers offers a sustainable solution to restore soil health while supporting crop productivity (Tridisha Deka and Swami, 2022) [19] . Organic manures like vermicompost, FYM, poultry manure and neem cake play a vital role in improving the physical properties of lateritic soils by reducing bulk density, enhancing water-holding capacity and promoting stable aggregate formation. Concurrently, they enrich the soil matrix with primary and secondary nutrients while buffering pH variations (Titirmare et al., 2023) [18] . When combined with biofertilizers such as PSB and Azotobacter microbial activity in the rhizosphere is significantly amplified. These beneficial microorganisms produce organic acids, solubilize fixed nutrients like phosphorus and potassium and secrete growth-promoting substances that modify the micro-environment around the developing rhizomes ((Imran, 2024) [5] . Evaluating the temporal impact of these organic and microbial treatments during the cropping period provides critical insights into maintaining soil fertility, enhancing nutrient availability and preventing nutrient losses due to intense seasonal rains.
Establishing an eco-friendly nutrient management protocol is essential for optimizing black turmeric production and sustaining soil quality in the fragile Konkan ecosystem.
Materials and methods
The experiment was laid out in a Factorial Randomized Block Design and replicated thrice. The research trial was conducted at AICRP on Spices, Asond Block, CES, Wakawali, Dr. Balasaheb Sawant Konkan Krishi Vidyapeeth, Dapoli. The treatment consisted of four different organic manures i.e., O 1 -Poultry manure (7.5 t/ha), O 2 -Vermicompost (12 t/ha), O 3 -Neem cake (10 t/ha) and O 4 -FYM (30 t/ha) and different biofertilizers i.e., B 1 -Azotobacter (5 kg/ha), B 2 -Azospirillum (5 kg/ha), B 3 -PSB (5 kg/ha), B 4 -VAM (5 kg/ha) and B 5 -No Biofertilizers. To determine the chemical characteristics of the soil during the year of study, soil samples were taken from different spots of the experimental field at a depth of 0-25 cm before the application of organic manures and after harvesting of crop for analysis. A representative composite sample was prepared by processing and mixing them together and the sample was analyzed for chemical properties. The chemical properties of the experimental site are given below. [6] 2.
Results and discussion
Results and discussion
Soil pH and Electrical Conductivity
Across all treated plots, the baseline electrochemical parameters of the post-harvest lateritic soil matrix remained uniform, as neither organic manures (O), biofertilizers (B) nor their interaction induced any statistically significant changes in soil pH and electrical conductivity (EC) throughout the study (Table 3.1 and 3.2). Pooled soil pH stayed within a narrow acidic band ranging from 5.44 to 5.47 for organic manures, 5.45 to 5.48 for biofertilizers and 5.42 to 5.50 for their interaction. Similarly, EC values were non-significant across both years, varying between 0.078 and 0.085 dS/m under organic manures, 0.080 and 0.083 dS/m with biofertilizers and 0.079 to 0.085 dS/m for the interaction, conclusively establishing that these treatments did not induce soil salinity issues. The post-harvest lateritic soil matrix stubbornly held its ground, keeping electrochemical parameters remarkably uniform across every treated plot. Soil pH hovered within a tightly contained acidic band of 5.42 to 5.50, completely indifferent to the amendments. This steadfast resistance to change stems from the heavy-hitting buffering capacity of red lateritic soils, where an abundance of iron and aluminum oxides provides extensive surface sites that quietly neutralize incoming organic acids through proton adsorption and cation exchange. Similarly, electrical conductivity barely budged, staying safely between 0.078 and 0.085 dS/m without a hint of induced salinity. This stability reflects the non-ionic nature and low salt index of organic amendments and bio-inoculants compared to synthetic chemical fertilizers; organic manures release nutrient ions gradually through slow mineralization, while biofertilizers act as biological catalysts rather than direct salt sources, smoothly avoiding any sudden spikes in soil solution ionic concentration. These findings match the soil stability trends reported by Khedkar (2023) [8] and Sanika Khedkar (2024) [13] .
| Available potassium content of soil (kg/ha) | — | — | — | — | — | — | — | — | — | — | — | — | — | — | — | — | — | — | — | — |
|---|---|---|---|---|---|---|---|---|---|---|---|---|---|---|---|---|---|---|---|---|
| 2022-23 | 2023-24 | Pooled | ||||||||||||||||||
| Treatment | B1 | B2 | B3 | B4 | B5 | Mean | B1 | B2 | B3 | B4 | B5 | Mean | B1 | B2 | B3 | B4 | B5 | Mean | ||
| O1 | 305.82 | 305.95 | 305.25 | 304.14 | 305.51 | 305.65 | 311.25 | 313.00 | 311.00 | 310.22 | 311.08 | 311.31 | 308.54 | 309.48 | 308.13 | 307.18 | 308.30 | 308.48 | ||
| O2 | 307.15 | 307.88 | 308.54 | 307.06 | 306.89 | 307.50 | 311.23 | 312.14 | 313.22 | 311.25 | 310.12 | 311.59 | 309.19 | 310.01 | 310.88 | 309.16 | 308.51 | 309.55 | ||
| O3 | 302.11 | 302.15 | 303.01 | 301.00 | 300.15 | 306.34 | 307.15 | 307.22 | 309.01 | 307.02 | 306.15 | 307.31 | 304.63 | 304.69 | 306.01 | 304.01 | 303.15 | 306.83 | ||
| O4 | 285.00 | 286.54 | 288.91 | 283.14 | 278.15 | 284.35 | 290.70 | 290.27 | 291.54 | 287.80 | 282.17 | 288.50 | 287.85 | 288.41 | 290.23 | 285.47 | 280.16 | 286.43 | ||
| Mean | 300.02 | 300.63 | 301.43 | 298.84 | 297.68 | 305.08 | 305.66 | 306.19 | 304.07 | 302.38 | 302.55 | 303.15 | 303.81 | 301.46 | 300.03 | |||||
| S.Em ± | CD at 5% | F- test | S.Em ± | CD at 5% | F- test | S.Em ± | CD at 5% | F- test | ||||||||||||
| O | 0.099 | 0.293 | SIG | 0.095 | 0.281 | SIG | 0.096 | 0.285 | SIG | |||||||||||
| B | 0.111 | 0.328 | SIG | 0.106 | 0.314 | SIG | 0.108 | 0.318 | SIG | |||||||||||
| O X B | 0.221 | 0.655 | SIG | 0.212 | 0.628 | SIG | 0.215 | 0.637 | SIG |
Table text extracted from the original PDF; superscript letters are shown inline. The original table image is below.
View original table image
| Available phosphorus content of soil (kg/ha) | — | — | — | — | — | — | — | — | — | — | — | — | — | — | — | — | — | — |
|---|---|---|---|---|---|---|---|---|---|---|---|---|---|---|---|---|---|---|
| 2022-23 | 2023-24 | Pooled | ||||||||||||||||
| Treatment | B1 | B2 | B3 | B4 | B5 | Mean | B1 | B2 | B3 | B4 | B5 | Mean | B1 | B2 | B3 | B4 | B5 | Mean |
| O1 | 16.64 | 16.80 | 17.09 | 16.56 | 16.11 | 16.64 | 16.79 | 17.14 | 17.34 | 16.69 | 16.43 | 16.88 | 16.72 | 16.97 | 17.22 | 16.63 | 16.27 | 16.76 |
| O2 | 17.15 | 17.88 | 18.54 | 17.06 | 16.89 | 17.50 | 17.92 | 18.04 | 18.91 | 17.40 | 17.23 | 17.90 | 17.54 | 17.96 | 18.73 | 17.23 | 17.06 | 17.70 |
| O3 | 16.25 | 16.72 | 17.03 | 15.88 | 15.81 | 16.34 | 16.58 | 17.05 | 17.37 | 16.20 | 16.42 | 16.72 | 16.42 | 16.89 | 17.20 | 16.04 | 16.12 | 16.53 |
| O4 | 15.82 | 15.95 | 16.14 | 15.35 | 15.51 | 15.65 | 16.74 | 16.70 | 16.76 | 16.66 | 16.31 | 16.63 | 16.28 | 16.33 | 16.45 | 16.01 | 15.91 | 16.14 |
| Mean | 16.47 | 16.84 | 17.20 | 16.21 | 15.96 | 17.01 | 17.23 | 17.60 | 16.74 | 16.60 | 16.74 | 17.04 | 17.40 | 16.48 | 16.28 | |||
| S.Em ± | CD at 5% | F- test | S.Em ± | CD at 5% | F- test | S.Em ± | CD at 5% | F- test | ||||||||||
| O | 0.014 | 0.043 | SIG | 0.048 | 0.142 | SIG | 0.024 | 0.072 | SIG | |||||||||
| B | 0.016 | 0.048 | SIG | 0.053 | 0.158 | SIG | 0.027 | 0.081 | SIG | |||||||||
| O X B | 0.032 | 0.096 | SIG | 0.107 | 0.316 | SIG | 0.055 | 0.162 | SIG |
Table text extracted from the original PDF; superscript letters are shown inline. The original table image is below.
View original table image
| Treatment Details | — | — | — | — |
|---|---|---|---|---|
| O1: Poultry manure (7.5 t/ha) | O2: Vermicompost (12 t/ha) | O3: Neem cake (10 t/ha) | O4: FYM (30 t/ha) | B5: No biofertilizer |
| B1: Azotobacter (5 kg/ha) | B2: Azospirillum (5 kg/ha) | B3: PSB (5 kg/ha) | B4: VAM (5 kg/ha) |
Table text extracted from the original PDF; superscript letters are shown inline. The original table image is below.
View original table image
| Available nitrogen content of soil (kg/ha) | — | — | — | — | — | — | — | — | — | — | — | — | — | — | — | — | — | — |
|---|---|---|---|---|---|---|---|---|---|---|---|---|---|---|---|---|---|---|
| 2022-23 | 2023-24 | Pooled | ||||||||||||||||
| Treatment | B1 | B2 | B3 | B4 | B5 | Mean | B1 | B2 | B3 | B4 | B5 | Mean | B1 | B2 | B3 | B4 | B5 | Mean |
| O1 | 284.23 | 288.22 | 281.54 | 271.24 | 260.49 | 277.14 | 286.85 | 290.17 | 286.54 | 281.24 | 278.77 | 284.71 | 285.54 | 289.195 | 284.04 | 276.24 | 269.63 | 280.93 |
| O2 | 286.41 | 290.55 | 286.24 | 275.14 | 259.46 | 279.56 | 285.41 | 292.23 | 289.24 | 284.14 | 276.12 | 285.42 | 285.91 | 291.39 | 287.74 | 279.64 | 267.79 | 282.49 |
| O3 | 281.65 | 282.17 | 279.15 | 265.57 | 260.15 | 273.74 | 285.15 | 288.77 | 282.23 | 273.57 | 270.61 | 280.07 | 283.40 | 285.47 | 280.69 | 269.57 | 265.38 | 276.91 |
| O4 | 270.13 | 273.42 | 268.12 | 261.16 | 258.55 | 266.28 | 274.51 | 276.88 | 274.56 | 272.56 | 270.68 | 273.84 | 272.32 | 275.15 | 271.34 | 266.86 | 264.62 | 270.06 |
| Mean | 280.61 | 283.59 | 278.76 | 268.28 | 259.66 | 282.98 | 287.01 | 283.14 | 277.88 | 274.05 | 281.80 | 285.30 | 280.95 | 273.08 | 266.86 | |||
| S.Em ± | CD at 5% | F- test | S.Em ± | CD at 5% | F- test | S.Em ± | CD at 5% | F- test | ||||||||||
| O | 0.108 | 0.320 | SIG | 0.104 | 0.308 | SIG | 0.104 | 0.309 | SIG | |||||||||
| B | 0.121 | 0.358 | SIG | 0.116 | 0.345 | SIG | 0.117 | 0.345 | SIG | |||||||||
| O X B | 0.242 | 0.716 | SIG | 0.233 | 0.689 | SIG | 0.233 | 0.690 | SIG |
Table text extracted from the original PDF; superscript letters are shown inline. The original table image is below.
View original table image
| Organic carbon content of soil (g/kg) | — | — | — | — | — | — | — | — | — | — | — | — | — | — | — | — | — | — |
|---|---|---|---|---|---|---|---|---|---|---|---|---|---|---|---|---|---|---|
| ` | 2022-23 | 2023-24 | Pooled | |||||||||||||||
| Treatment | B1 | B2 | B3 | B4 | B5 | Mean | B1 | B2 | B3 | B4 | B5 | Mean | B1 | B2 | B3 | B4 | B5 | Mean |
| O1 | 12.38 | 12.34 | 12.62 | 11.76 | 11.74 | 12.17 | 12.67 | 12.63 | 12.91 | 12.03 | 12.01 | 12.45 | 12.52 | 12.48 | 12.77 | 11.90 | 11.88 | 12.31 |
| O2 | 12.44 | 12.61 | 12.80 | 11.90 | 11.89 | 12.33 | 12.79 | 12.96 | 13.16 | 12.24 | 12.23 | 12.68 | 12.62 | 12.79 | 12.98 | 12.07 | 12.06 | 12.50 |
| O3 | 11.72 | 12.27 | 12.41 | 11.57 | 11.50 | 11.89 | 12.50 | 12.57 | 12.71 | 12.36 | 12.28 | 12.48 | 12.11 | 12.42 | 12.56 | 11.97 | 11.89 | 12.19 |
| O4 | 11.64 | 11.61 | 12.13 | 11.50 | 11.50 | 11.68 | 12.25 | 12.25 | 12.41 | 12.18 | 12.13 | 12.24 | 11.95 | 11.93 | 12.27 | 11.84 | 11.82 | 11.96 |
| Mean | 12.05 | 12.21 | 12.49 | 11.68 | 11.66 | 12.55 | 12.60 | 12.80 | 12.20 | 12.16 | 12.30 | 12.40 | 12.64 | 11.94 | 11.91 | |||
| S.Em ± | CD at 5% | F- test | S.Em ± | CD at 5% | F- test | S.Em ± | CD at 5% | F- test | ||||||||||
| O | 0.022 | 0.065 | SIG | 0.043 | 0.126 | SIG | 0.027 | 0.081 | SIG | |||||||||
| B | 0.025 | 0.073 | SIG | 0.048 | 0.141 | SIG | 0.031 | 0.090 | SIG | |||||||||
| O X B | 0.049 | 0.146 | SIG | 0.095 | 0.281 | SIG | 0.061 | 0.181 | SIG |
Table text extracted from the original PDF; superscript letters are shown inline. The original table image is below.
View original table image
| Electrical conductivity of soil (dS/m) | — | — | — | — | — | — | — | — | — | — | — | — | — | — | — | — | — | — |
|---|---|---|---|---|---|---|---|---|---|---|---|---|---|---|---|---|---|---|
| 2022-23 | 2023-24 | Pooled | ||||||||||||||||
| Treatment | B1 | B2 | B3 | B4 | B5 | Mean | B1 | B2 | B3 | B4 | B5 | Mean | B1 | B2 | B3 | B4 | B5 | Mean |
| O1 | 0.081 | 0.085 | 0.085 | 0.081 | 0.081 | 0.082 | 0.081 | 0.083 | 0.084 | 0.080 | 0.080 | 0.082 | 0.081 | 0.084 | 0.085 | 0.081 | 0.081 | 0.082 |
| O2 | 0.083 | 0.085 | 0.085 | 0.085 | 0.081 | 0.083 | 0.081 | 0.083 | 0.084 | 0.084 | 0.082 | 0.083 | 0.082 | 0.084 | 0.085 | 0.084 | 0.081 | 0.083 |
| O3 | 0.083 | 0.082 | 0.083 | 0.082 | 0.080 | 0.082 | 0.081 | 0.080 | 0.083 | 0.080 | 0.078 | 0.080 | 0.082 | 0.081 | 0.083 | 0.081 | 0.079 | 0.081 |
| O4 | 0.081 | 0.080 | 0.081 | 0.082 | 0.081 | 0.081 | 0.080 | 0.080 | 0.081 | 0.080 | 0.081 | 0.080 | 0.080 | 0.080 | 0.081 | 0.081 | 0.081 | 0.080 |
| Mean | 0.082 | 0.083 | 0.083 | 0.082 | 0.081 | 0.081 | 0.081 | 0.083 | 0.081 | 0.080 | 0.081 | 0.082 | 0.083 | 0.081 | 0.080 | |||
| S.Em ± | CD at 5% | F- test | S.Em ± | CD at 5% | F- test | S.Em ± | CD at 5% | F- test | ||||||||||
| O | 0.0006 | - | NS | 0.0008 | - | NS | 0.0005 | - | NS | |||||||||
| B | 0.0007 | - | NS | 0.0009 | - | NS | 0.0006 | - | NS | |||||||||
| O X B | 0.0014 | - | NS | 0.0018 | - | NS | 0.0011 | - | NS |
Table text extracted from the original PDF; superscript letters are shown inline. The original table image is below.
View original table image
| Soil pH | — | — | — | — | — | — | — | — | — | — | — | — | — | — | — | — | — | — |
|---|---|---|---|---|---|---|---|---|---|---|---|---|---|---|---|---|---|---|
| 2022-23 | 2023-24 | Pooled | ||||||||||||||||
| Treatment | B1 | B2 | B3 | B4 | B5 | Mean | B1 | B2 | B3 | B4 | B5 | Mean | B1 | B2 | B3 | B4 | B5 | Mean |
| O1 | 5.44 | 5.44 | 5.46 | 5.41 | 5.41 | 5.43 | 5.50 | 5.51 | 5.52 | 5.48 | 5.47 | 5.50 | 5.47 | 5.48 | 5.49 | 5.45 | 5.44 | 5.47 |
| O2 | 5.41 | 5.44 | 5.48 | 5.41 | 5.42 | 5.43 | 5.49 | 5.51 | 5.52 | 5.47 | 5.47 | 5.49 | 5.45 | 5.48 | 5.50 | 5.44 | 5.45 | 5.46 |
| O3 | 5.42 | 5.42 | 5.44 | 5.40 | 5.45 | 5.43 | 5.49 | 5.49 | 5.51 | 5.50 | 5.49 | 5.50 | 5.46 | 5.46 | 5.48 | 5.45 | 5.47 | 5.47 |
| O4 | 5.39 | 5.40 | 5.42 | 5.40 | 5.42 | 5.41 | 5.45 | 5.46 | 5.49 | 5.46 | 5.49 | 5.47 | 5.42 | 5.43 | 5.46 | 5.43 | 5.46 | 5.44 |
| Mean | 5.42 | 5.43 | 5.45 | 5.41 | 5.43 | 5.48 | 5.49 | 5.51 | 5.48 | 5.48 | 5.45 | 5.46 | 5.48 | 5.45 | 5.46 | |||
| S.Em ± | CD at 5% | F- test | S.Em ± | CD at 5% | F- test | S.Em ± | CD at 5% | F- test | ||||||||||
| O | 0.013 | - | NS | 0.008 | - | NS | 0.010 | - | NS | |||||||||
| B | 0.014 | - | NS | 0.009 | - | NS | 0.011 | - | NS | |||||||||
| O X B | 0.028 | - | NS | 0.019 | - | NS | 0.022 | - | NS |
Table text extracted from the original PDF; superscript letters are shown inline. The original table image is below.
View original table image
Soil organic carbon contents were profoundly enriched by the organic manures, biofertilizers and their interaction (Table 3.3).
Organic manures (O):
The application of vermicompost at 12 t/ha (O 2 ) recorded the highest mean soil organic carbon content in 2022-23 (12.33 g/kg) and 2023-24 (12.68 g/kg), resulting in a pooled mean of 12.50 g/kg, which was significantly superior to the other organic amendments. The lowest organic carbon content was found in FYM at 30 t/ha (11.68 g/kg, 12.24 g/kg and 11.36 g/kg in 2022-23, 2023-24 and pooled analysis, respectively).
Biofertilizers (B):
Inoculation with biofertilizers brought significant changes in soil organic carbon. The highest soil organic carbon content was achieved in plots treated with PSB at 5 kg/ha (B 3 ) during both years (12.49 g/kg and 12.80 g/kg, respectively) and pooled data (12.64 g/kg), which was significantly superior to all other strains. The treatment B 5 (No biofertilizer) maintained the lowest soil organic carbon content across the entire experimental timeline.
Interaction Effect (O X B):
The interaction effect was highly significant across both years and in the pooled data.
The treatment combination of O 2 B 3 (Vermicompost at 12 t/ha + PSB at 5 kg/ha) recorded the highest organic carbon content in both years (12.80 g/kg and 13.16 g/kg) and in pooled data (12.98 g/kg), whereas the lowest values were recorded in the O 4 B 5 (11.50 g/kg, 12.13 g/kg and 11.82 g/kg, respectively).
The prominent capacity of vermicompost to build up organic carbon stems from its rich concentration of chemically stabilized humic and fulvic fractions that naturally resist rapid microbial mineralization, resulting in long-term carbon sequestration. Furthermore, the presence of earthworm-derived mucilage and microbial polysaccharides helps bind soil particles into microaggregates. This physical occlusion protects the organic matter from rapid atmospheric oxidation and enzymatic decay. The significant performance of PSB in boosting soil organic carbon is an indirect effect of unlocking phosphorus constraints in lateritic soils. By maximizing phosphorus availability, PSB stimulates extensive root proliferation and subsequent rhizodeposition. When combined as (Vermicompost + PSB), the vermicompost acts as an energy-rich carbon reservoir and incubator for the introduced bacteria, accelerating the formation of stable organo-mineral complexes and microbial necromass. This dual action confirms the findings of Kaur et al. (2005) [7] , Bashan and de-Bashan (2010) and Nandhini et al. (2023) [1,9] .
Post-harvest available nitrogen in the lateritic soil showed highly significant variations under all treatments and their interactions (Table 3.4).
Organic manures (O):
The incorporation of vermicompost at 12 t/ha (O 2 ) sustained the highest post-harvest available nitrogen across both seasons (279.56 kg/ha and 285.42 kg/ha in 2022-23 and 2023-24, respectively) and pooled data (282.49 kg/ha), proved significantly superior to poultry manure at 7.5 t/ha (O 1 ), neem cake at 10 t/ha (O 3 ) and FYM at 30 t/ha (O 4 ). The lowest available nitrogen was uniformly recorded in FYM (O 4 ) treated plots.
Biofertilizers (B):
Among the biofertilizers, Azospirillum at 5 kg/ha (B 2 ) proved to be the most efficient for nitrogen availability, recorded the highest mean of 283.59 kg/ha in 2022-23, 287.01 kg/ha in 2023-24 and 285.30 kg/ha in pooled analysis. This performance was significantly superior to all other treatments, including the nitrogen-fixing Azotobacter (B 1 ). The control plots (B 5 ) recorded the lowest available nitrogen pool across both trials.
Interaction Effect (O X B):
The interaction between organic manures and biofertilizers was significant. The treatment combination of vermicompost at 12 t/ha with Azospirillum at 5 kg/ha (O 2 B 2 ) recorded the maximum postharvest available nitrogen value in both years (290.55 kg/ha and 292.23 kg/ha) and pooled analysis (291.39 kg/ha), while the lowest available nitrogen was noticed in the O 4 B 5 (FYM at 30 t/ha with no biofertilizer) in 2022-23, 2023-24 and pooled analysis (258.55 kg/ha, 270.68 kg/ha and 264.62 kg/ha, respectively). The significant enrichment of post-harvest available nitrogen under the vermicompost (O 2 ), Azospirillum (B 2 ) and combination (O 2 B 2 ) stems from a dynamic synergy between rapid organic mineralization and efficient biological nitrogen fixation. Vermicompost possesses a narrow carbon-to-nitrogen (C:N) ratio and a highly humified, microbially active structure, which accelerates the enzymatic mineralization of organic N into readily available ammonium (NH 4 + ) and nitrate (NO 3 -) ions compared to the slower decomposition profile of Farmyard Manure (O 4 ). Simultaneously, symbiotic associative Azospirillum bacteria thrive in the rich organic carbon environment provided by vermicompost, utilizing nitrogenase enzymes to actively fix atmospheric nitrogen (N 2 ) into bioavailable forms while secreting growth-promoting phytohormones (such as auxins) that enhance root uptake efficiency. When combined (O 2 B 2 ), the steady release of mineralized N from vermicompost works in tandem with continuous microbial N-fixation and root stimulation from Azospirillum, maximizing the post-harvest available nitrogen pool while uninoculated, high-C:N amendments like FYM alone (O 4 B 5 ) suffer from temporary nitrogen immobilization and lower microbial activity. When applied together as O 2 B 2 (Vermicompost at 12 t/ha with Azospirillum at 5 kg/ha), a priming effect occurs: vermicompost supplies the steady moisture and carbon fuel required to sustain high microbial nitrogenase activity, which is strongly supported by the work of Dinesh et al. (2010) [3] , Suhedan et al. (2015), Sharma et al. (2018) [15] , Cruz-Hernández et al. (2022) and Oyege et al. (2023) [2,10] .
The status of post-harvest available phosphorus in lateritic soils was significantly enhanced by all investigated parameters (Table 3.5).
Organic manures (O):
The application of vermicompost at 12 t/ha (O 2 ) stood out as the leading organic input, securing the highest available phosphorus with a mean of 17.50 kg/ha in 2022-23, 17.90 kg/ha in 2023-24 and a pooled mean of 17.70 kg/ha, establishing clear statistical significance over all alternative inputs, while the lowest available phosphorus values were observed with application of FYM at 30 t/ha (O 4 ) across both seasons and pooled analysis.
Biofertilizers (B):
In terms of biofertilizers, the application of Phosphate Solubilizing Bacteria (B 3 ) recorded the maximum phosphorus availability, reaching a significant mean of 17.20 kg/ha in 2022-23, 17.60 kg/ha in 2023-24 and a pooled mean of 17.70 kg/ha. The absolute lowest available phosphorus was tracked in the treatment B 5 (No biofertilizer).
Interaction effect (O X B):
The interaction was statistically significant. The synergistic application of vermicompost at 12 t/ha and PSB at 5 kg/ha (O 2 B 3 ) unlocked the highest available phosphorus content in the soil matrix in both years (2022-23 and 2023-24) and pooled analysis (18.54 kg/ha, 18.91 kg/ha and 18.73 kg/ha, respectively), while the lowest available phosphorus values were found in the treatment O 4 B 5 (FYM at 30 t/ha with No biofertilizer) i.e., 15.51 kg/ha, 16.31 kg/ha and 15.91 kg/ha. Phosphorus fixation by iron and aluminum oxides is a notorious constraint in red lateritic soils. Vermicompost helps alleviate this problem because its organic decomposition products release organic acids that act as natural chelating agents. These agents sequester Al 3+ and Fe 3+ ions, preventing native phosphorus from forming insoluble precipitates. Concurrently, PSB actively secretes low molecular weight organic acids (such as gluconic, oxalic and citric acids) that lower micro-environmental pH and break the chemical bonds of insoluble metal phosphates, freeing plant-available ions. In the combined O 2 B 3 treatment, the humic compounds from vermicompost coat soil particles to keep the newly solubilized phosphorus from getting locked up again, ensuring a steady nutrient supply that matches the results reported by Patil and Halemani (2018), Sharma and Parmar (2018) [15] Srivastava et al. (2020) [16] , Etesami et al. (2024) [4] and Rathore et al. (2021) [11, 12] . s3.5 Available Potassium content of soil (kg/ha) Data related to the available potassium status of the soil exhibited highly significant variations during two years of evaluation period (Table 3.6).
Organic manures (O):
The maximum post-harvest available potassium content was recorded under the treatment of O 2 (Vermicompost at 12 t/ha), generating a mean of 307.50 kg/ha in 2022-23 and 311.59 kg/ha in 2023-24. This treatments was significantly superior to O 1 (Poultry manure), O 3 (Neem Cake) and O 4 (FYM). The lowest available potassium content was found in the FYM at 30 t/ha (O 4 ) treatment across both seasons and pooled data.
Biofertilizers (B):
The treatment B 3 (PSB at 5 kg/ha) recorded the highest available potassium with a mean of 301.43 kg/ha in 2022-23, 306.19 kg/ha in 2023-24 and 303.81 kg/ha in pooled, proving significantly superior to the other biofertilizers. The lowest available potassium content was noticed in the B 5 (No biofertilizer) for both years.
Interaction effect (O X B):
The interaction between organic manures and biofertilizers showed statistical significance during both experimental years. The combination of vermicompost at 12 t/ha along with PSB at 5 kg/ha (O 2 B 3 ) maximized the potassium content across both years (308.54 kg/ha and 313.22 kg/ha) and pooled data (310.88 kg/ha), while the lowest available potassium content was registered in the O 4 B 5 treatment The significant enhancement of post-harvest available potassium under the combined application of vermicompost (12 t/ha) and PSB (5 kg/ha) can be attributed to the synergistic actions of organic matter decomposition and microbial activity. Vermicompost supplies readily accessible potassium while releasing low-molecular-weight organic acids (such as citric, oxalic, and tartaric acids) during mineralization; these acids compete with K + ions for sorption sites on soil clay minerals and chelate fixed cations (Al 3+ , Fe 3+ and Ca 2+ ), thereby liberating interlayer nonexchangeable potassium into the available pool. Concurrently, Phosphate Solubilizing Bacteria (PSB) accelerate this solubilization process by producing organic acids, carbon dioxide and protons (H + ), which lower the local micro-rhizosphere pH and enhance the weathering of potassium-bearing silicate minerals (like micas and feldspars). Additionally, vermicompost improves soil cation exchange capacity (CEC), moisture retention and structural aggregation, reducing leaching losses of K + ions and creating an optimal microenvironment that maximizes both microbial activity and overall potassium availability in the soil solution. This combined process is supported by Patil and Halemani (2018) [11] , Srivastava (2020) [16] , Rathore et al. (2021) [12] , Sharma and Parmar et al. (2018) [15] and Sanika (2024).
Figures and tables from the paper
| Nutrient content (%) | Organic manures | — | — | — |
|---|---|---|---|---|
| Poultry manure | Vermicompost | Neem cake | FYM | |
| N (%) | 2.66 | 1.67 | 1.99 | 0.66 |
| P2O5 (%) | 1.03 | 1.00 | 0.75 | 0.25 |
| K2O (%) | 1.05 | 1.28 | 1.20 | 0.42 |
Table text extracted from the original PDF; superscript letters are shown inline. The original table image is below.
View original table image
References
19 in the original paper- Bashan Y, de-Bashan LE. How the plant growthpromoting bacterium Azospirillum promotes plant growth-a critical evaluation. Advances in Agronomy. 2014;108:103-136.
- Cruz-Hernández MA, Mendoza-Herrera A, BocanegraGarcía V, Rivera G. Azospirillum spp. from plant growth-promoting bacteria to their use in bioremediation. Microorganisms. 2022;10(5):10521057.
- Dinesh R, Srinivasan V, Hamza S, Manjusha A. Shortterm incorporation of organic manures and biofertilizers influences biochemical and microbial characteristics of soils under an annual crop turmeric (Curcuma longa L.). Bioresource Technology. 2010;101(12):4697-4702.
- Etesami H, Jeong BR, Glick BR. Contribution of phosphate-solubilizing microorganisms to soil phosphorus cycling and plant nutrition. Frontiers in Microbiology. 2024;15:138-147.
- Imran. Integration of organic, inorganic and biofertilizer, improve maize-wheat system productivity and soil nutrients. Journal of Plant Nutrition. 2024;1-17.
- Jackson ML. Soil Chemical Analysis. New Delhi: Prentice Hall of India Private Limited; 1973. p. 41-110.
- Kaur K, Kapoor KK, Gupta AP. Impact of organic manures and biofertilizers on soil microbial properties. Bioresource Technology. 2005;96(9):1001-1006.
- Nandhini DU, Senthilraja K, Venkatesan S, Somasundaram E, Geethalakshmi V. Evaluating growth attributes and soil health under long-term implementation of organic farming in fodder cowpea. Range Management and Agroforestry. 2023;44(2):263271.
- Oyege I, Balaji Bhaskar MS. Effects of vermicompost on soil and plant health and promoting sustainable agriculture. Soil Systems. 2023;7(4):98-101.
- Patil SV, Halemani HL. Impact of organic manure sources on soil nutrient availability and crop performance. Journal of Soil Science and Plant Nutrition. 2018;18(3):742-755.
- Rathore SS, Shekhawat K, Sharma RK. Nutrient release pattern and post-harvest soil fertility status as influenced by diverse organic sources. Communications in Soil Science and Plant Analysis. 2021;52(14):16891702.
- Khedkar S. Effect of manures and fertilizers on quality, soil property and yield of turmeric in lateritic soil of Konkan [M.Sc. (Agri.) thesis]. Dapoli: College of Agriculture, Dr. Balasaheb Sawant Konkan Krishi Vidyapeeth; 2024.
- Sengar SS. Effect of organic manures and inorganic fertilizers on crop yield and soil properties. Journal of the Indian Society of Soil Science. 2008;56(2):196-201.
- Sharma AK, Parmar DK. Impact of biofertilizers on soil nutrient pools and crop performance under sustainable agricultural systems. Journal of Plant Nutrition. 2018;41(12):1540-1552.
- Srivastava PK, Singh RP, Tiwari SP. Soil fertility dynamics and nutrient availability under different organic management regimes. Archives of Agronomy and Soil Science. 2020;66(5):612-627.
- Subbiah BV, Asija GL. A rapid procedure for the estimation of available nitrogen in soils. Current Science. 1956;25(8):259-260.
- Titirmare NS, Ranshur NJ, Patil AH, Patil SR, Margal PB. Effect of inorganic fertilizers and organic manures on physical properties of soil: a review. International Journal of Plant and Soil Science. 2023;35(19):10151023.
- Deka T, Swami S. Development of organic nutrient management package for black turmeric (Curcuma caesia Roxb.) for higher yield in acidic soil. Journal of Plant Nutrition. 2022;45(15):2311-2322.
- Walkley A, Black IA. An examination of the Degtjareff method for determining soil organic matter, and a proposed modification of the chromic acid titration method. Soil Science. 1934;37(1):29-38.