
Research article · 2026 · Full text
International Journal of Horticulture and Food ScienceImpact of high-value fruits and crops cultivation on household dietary diversity: An endline comparative assessment of beneficiary and control groups in Mirsarai, Sitakunda and Hathazari Upazilas of Chattogram, Bangladesh
Volume 8(9) · Pages 09–18 · DOI: 10.33545/26631067.2026.v8.i9a.846 ↗
Research areasAgricultural Innovations and PracticesAgricultural Development and ManagementFood Security and Socioeconomic Dynamics
Abstract
Author-writtenThe transition from subsistence farming to commercial high-value agriculture is a critical pathway for improving rural livelihoods and nutritional outcomes in developing economies. This study evaluates the impact of the High Value Fruits and Crops (HVF&C) Varieties Extension and Marketing Sub-Project on Household Dietary Diversity (HDD), food security and economic empowerment in Chattogram, Bangladesh utilizing a cross sectional comparative endline assessment design. Empirical findings indicate a profound transformation in agricultural microenterprises. Compared to the control group, beneficiaries demonstrated significantly higher adoption of climate adaptive technologies (93.9% vs. 5.6%), greater access to customized financial support (95.3% vs. 23.6%) and improved integration into direct-to-consumer and institutional market channels (90.6% vs. 5.6%). Consequently, 82.8% of beneficiaries reported increased agricultural production and 62.3% reported increased profit, contrasting sharply with negligible gains in the control cohort. Crucially, these economic and technological pathways directly translated into nutritional security; 82.3% of beneficiary households achieved improved food quality and dietary diversity and 80.6% reported enhanced food availability, compared to just 5.6% and 2.8% in the control group, respectively. The study concludes that holistic interventions combining High-Value Fruits and Crops extension, market linkages and inclusive financial services successfully establish resilient agricultural microenterprises, driving both regional economic growth and sustainable improvements in household dietary diversity.
Summary
Source-checkedPlain-language reading of the full paper, prepared with AI and checked against the text. Each point links to the authors' own words.
Why it matters
- Agricultural efforts in Bangladesh have traditionally focused on staple cereals for calories, but there is now a need to shift toward high-value fruits and vegetables to improve rural livelihoods. View evidence ↗
- Smallholder farmers in the Chattogram region face barriers to dietary diversity, including poor market links, lack of climate-resilient technology, and financial constraints. View evidence ↗
The question
- The study aims to evaluate how the High Value Fruits and Crops (HVF&C) project impacted economic empowerment, food security, and household dietary diversity in Chattogram. View evidence ↗
What they did
- The researchers used a quantitative sample of 433 households, consisting of 361 project beneficiaries and 72 non-beneficiary controls. View evidence ↗
- The study used a cross-sectional comparative endline evaluation design conducted in the Chattogram district of Bangladesh. View evidence ↗
- Information was gathered through direct interviews using semi-structured, digitized questionnaires. View evidence ↗
What they found
- Beneficiaries saw a major increase in financial decision-making involvement (89.5%), whereas 58.3% of the control group had no involvement. View evidence ↗
- Almost all beneficiaries (98.3%) experienced positive changes in total household income, compared to only 9.7% of the control group. View evidence ↗
- Beneficiaries were far more likely to know and use climate-adaptive technologies (93.9%) than the control group (5.6%). View evidence ↗
- The project helped 90.6% of beneficiaries change their sales channels, increasing access to city markets, direct consumers, and digital tools. View evidence ↗
- The project led to increased production for 82.8% of beneficiaries and increased profit or income for 62.3%. View evidence ↗
- The project achieved high female participation (53.7%) among beneficiaries, compared to 0.0% in the control group. View evidence ↗
What it means
- The authors conclude that the HVF&C intervention successfully turned households into viable, climate-adaptive businesses, leading to an 82.3% improvement in dietary diversity. View evidence ↗
- The authors state that future success depends on providing lower-interest credit and expanding decentralized processing infrastructure. View evidence ↗
Visual summary
3 visualsIllustrations explain the paper; charts are replotted from the paper's own table values.
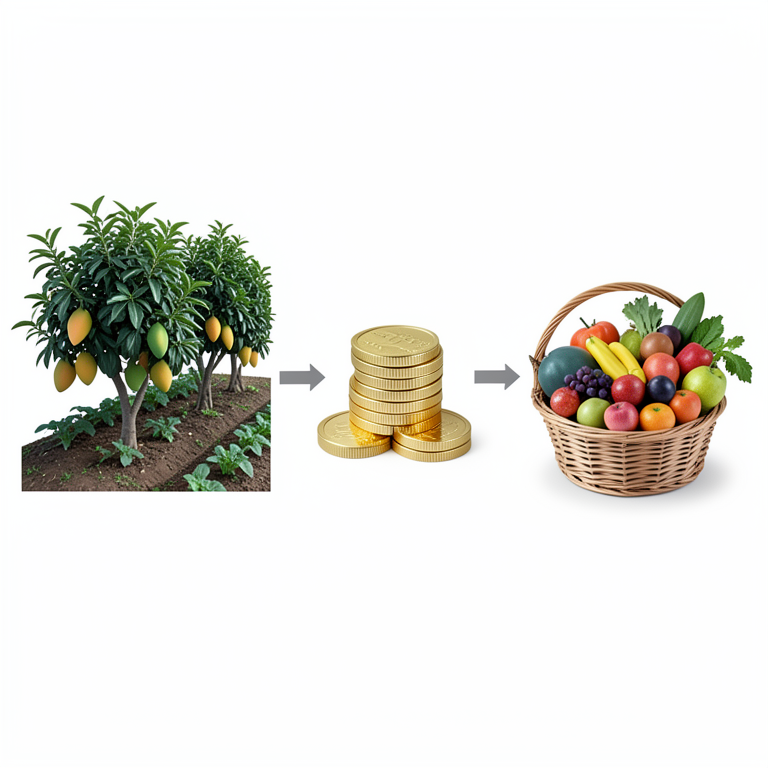
Pathway to Dietary Diversity
AI-generated conceptual illustration (High-value fruit trees and vegetable crops in a rural Bangladeshi farm setting). It explains the idea and does not show study data.
View source evidence ↗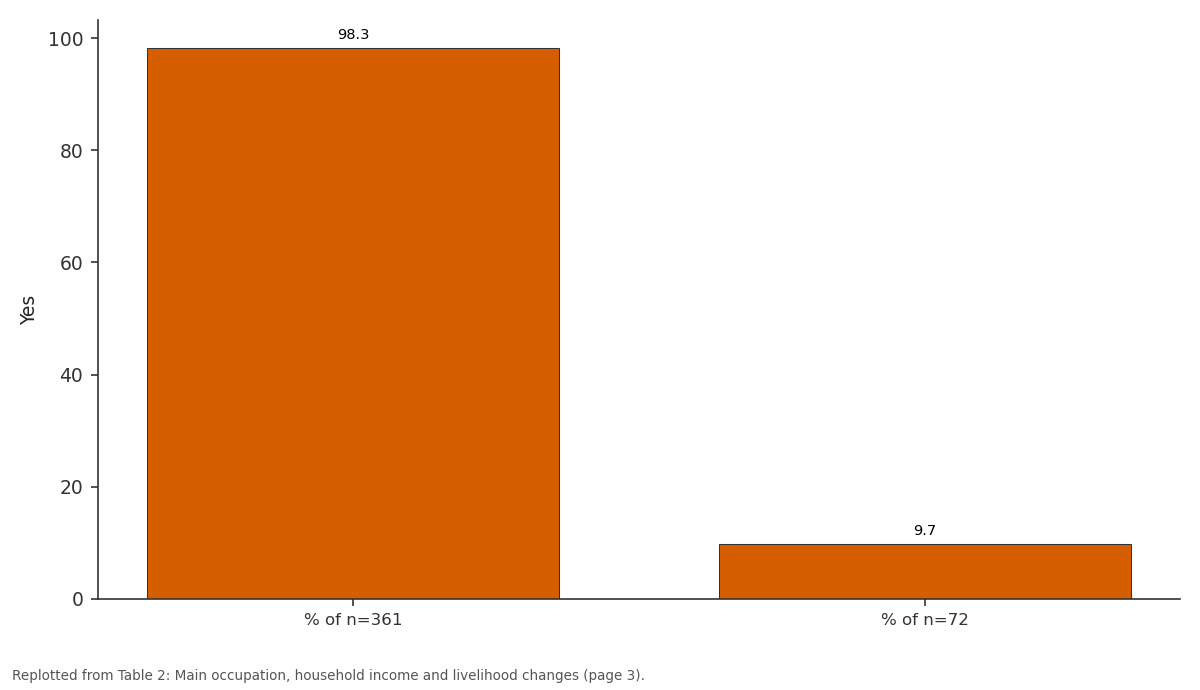
Yes: % of n=361 vs % of n=72
Replotted from Table 2 (page 3) of the original paper. Every bar is the paper's own table value.
View source evidence ↗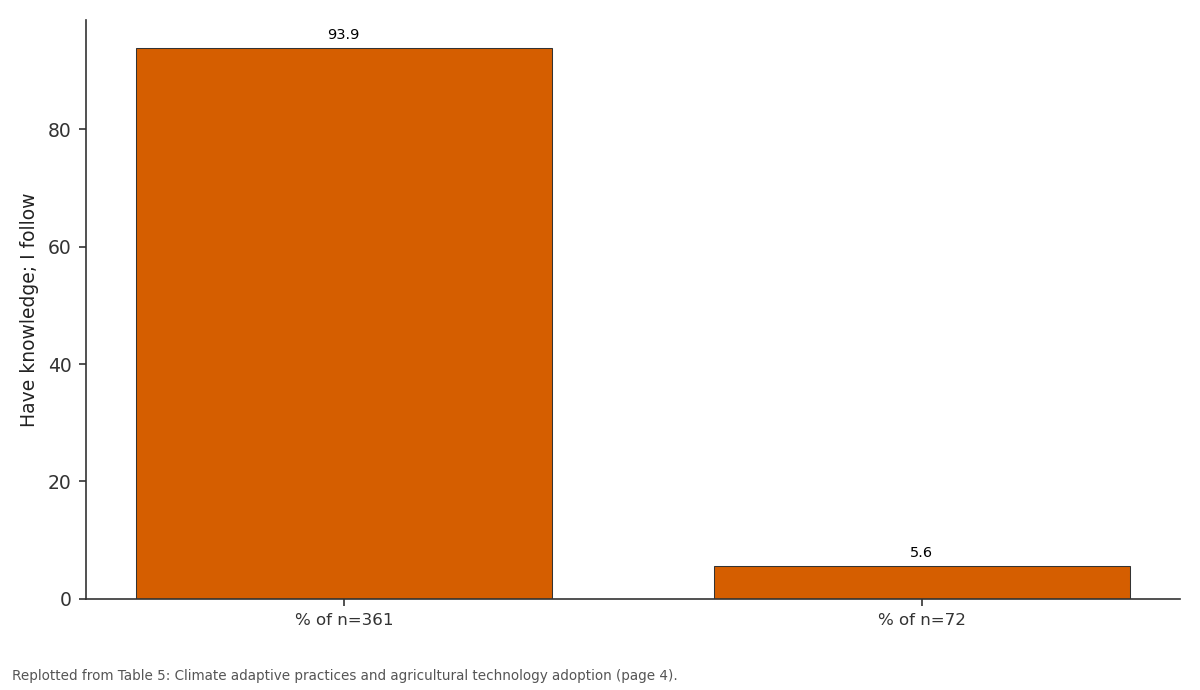
Have knowledge; I follow: % of n=361 vs % of n=72
Replotted from Table 5 (page 4) of the original paper. Every bar is the paper's own table value.
View source evidence ↗Figures & tables
From the original paper Table 1
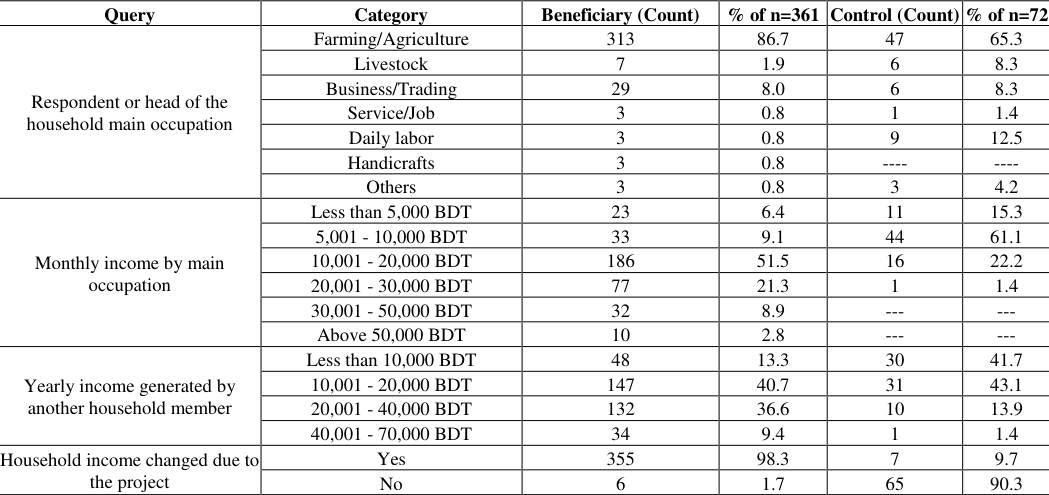 Table 2
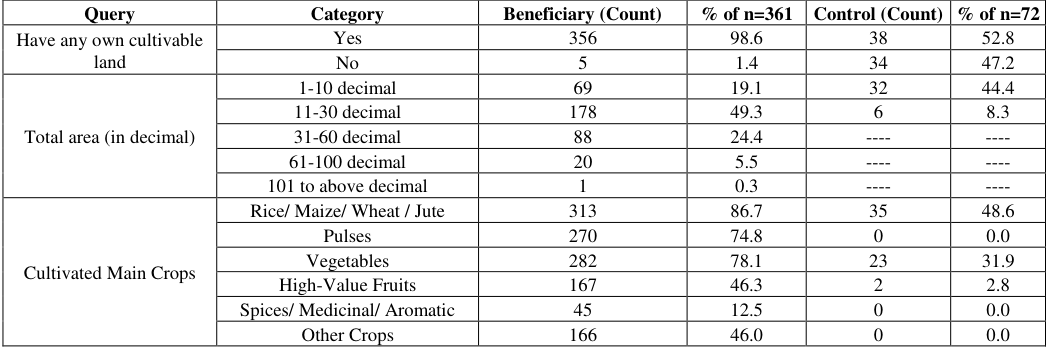 Table 3
 Table 4
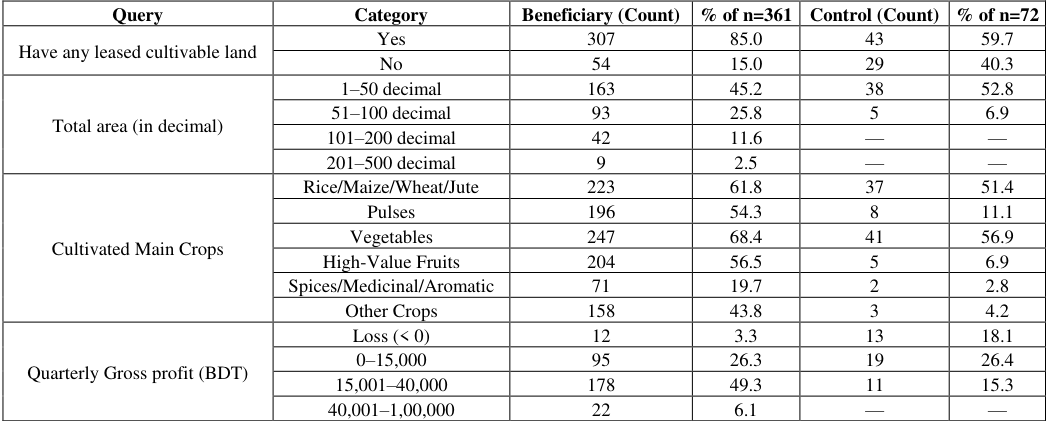 Table 4
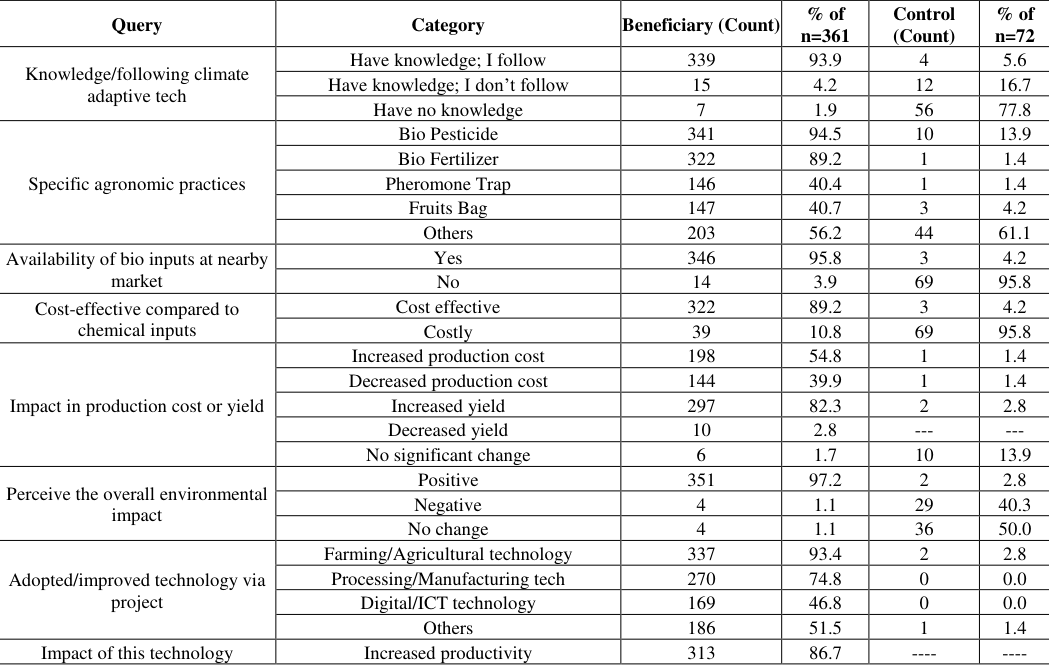 Table 5
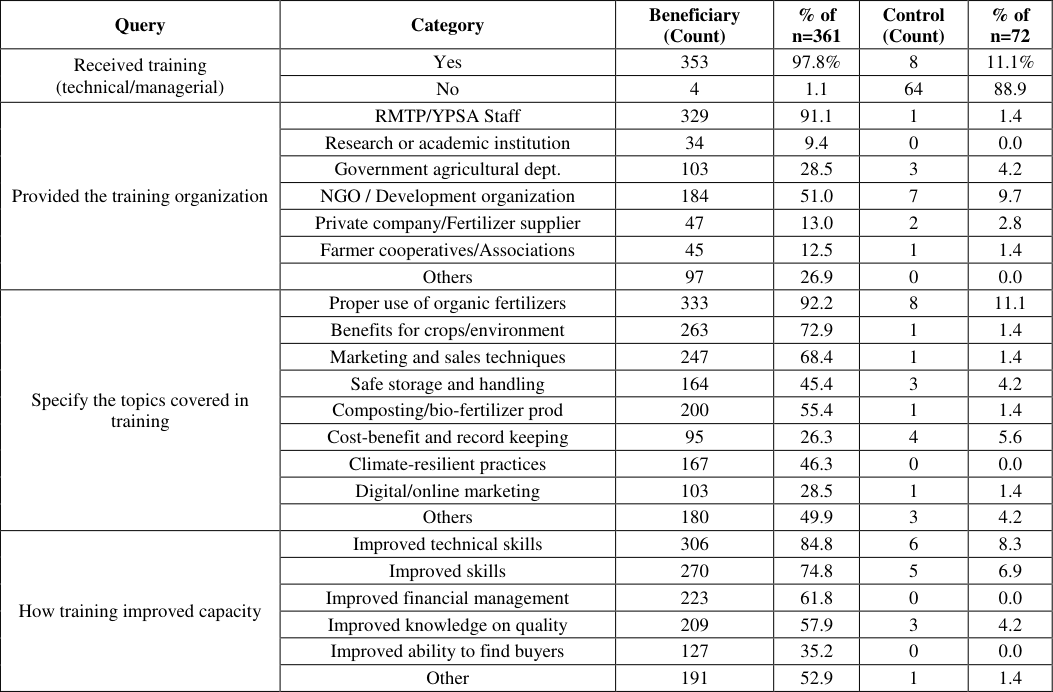 Table 6
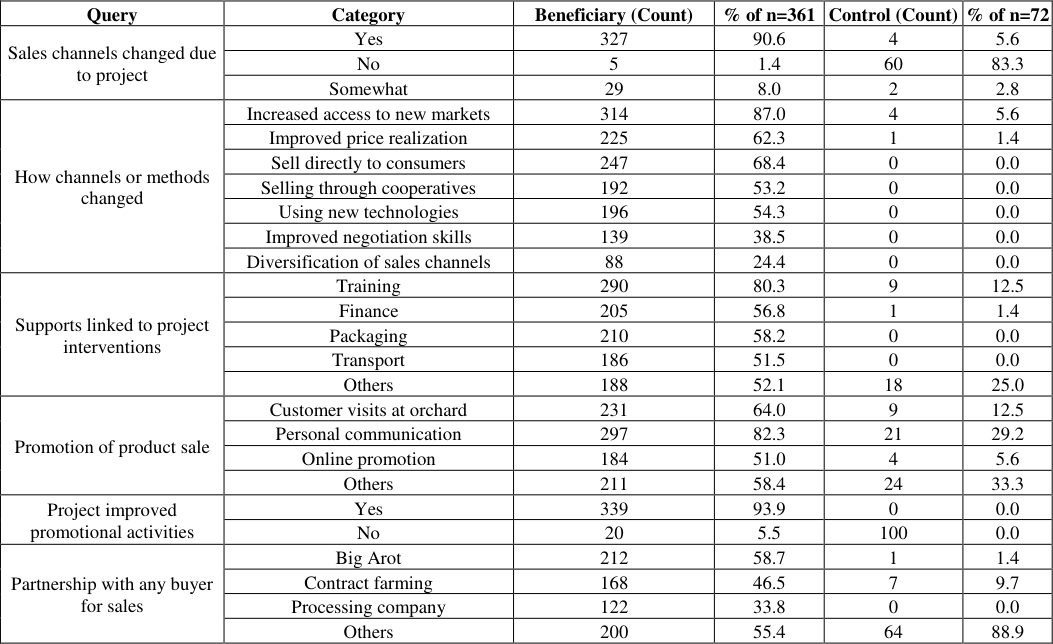 Table 7
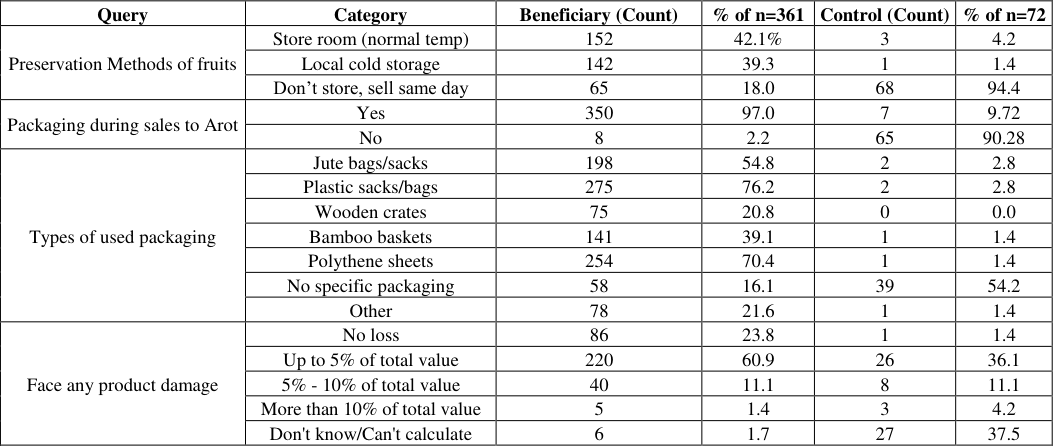 Table 8
 Table 9
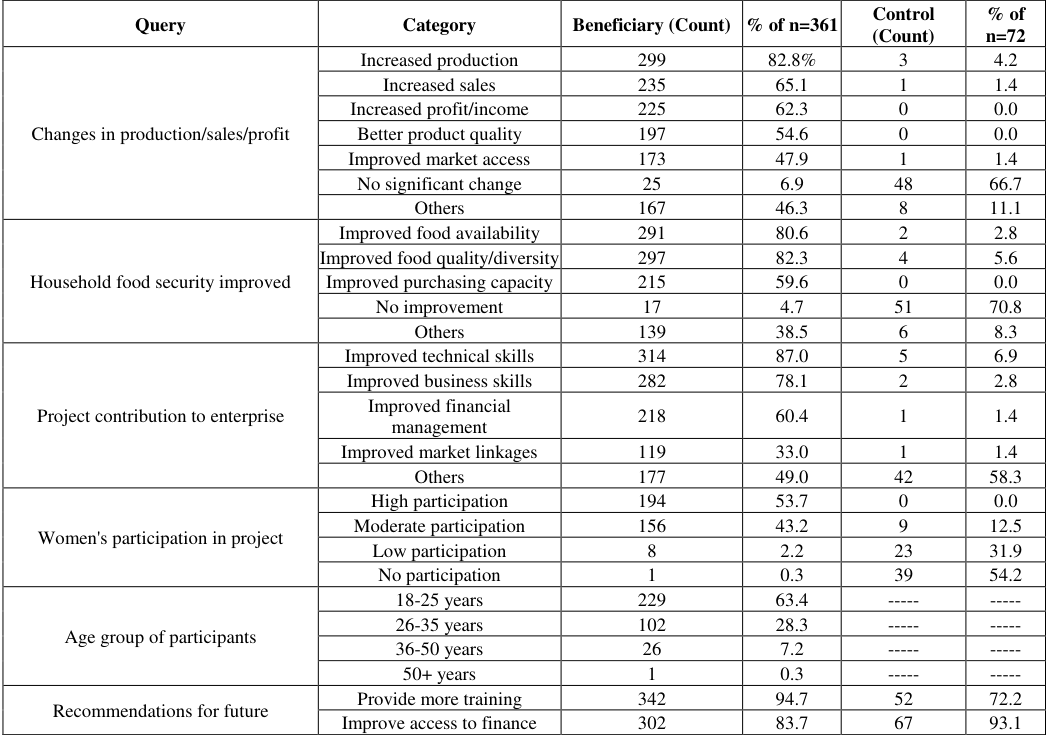 Table 10
Introduction
The structural transformation of rural agricultural systems is fundamental to alleviating poverty and combating malnutrition in South Asia (Asaduzzaman, 2010; Reardon and Timmer, 2012) [5,31] . Historically, agricultural interventions in Bangladesh have predominantly focused on staple cereal production to achieve caloric self-sufficiency (Pingali, 2015) [29] . However, as rural economies evolve, there is a recognized imperative to transition toward high-value agriculture specifically fruits, vegetables and commercial crops. These horticultural shifts offer superior income-generating potential, transform rural livelihoods and provide profound nutritional benefits (Weinberger and Lumpkin, 2007; Ali, 2008) [36,3] . High-Value Fruits and Crops present a unique opportunity to integrate marginalized smallholder farmers into expanding domestic and global value chains, thereby catalyzing rural microenterprise development and mitigating rural poverty (Rahman, 2017; Cock, 2020) [30,9] . The relationship between agricultural commercialization, income growth and household nutrition is complex and heavily mediated by market access, technology adoption and financial inclusion (Gómez and Ricketts, 2013; Awotide et al., 2016; Kuma et al., 2019) [11,7,22] . Increased agricultural income serves as the primary economic pathway to improved food security, enabling households to enhance their purchasing capacity and diversify their diets beyond staple grains (Parvin et al., 2014; Pingali, 2015) [28,29] . Dietary diversity, particularly Household Dietary Diversity (HDD), acts as a robust proxy for household food access and the micronutrient adequacy of the diet (Arimond and Ruel, 2004; FAO, 2011; Kennedy et al., 2011) [4,10,21] . Despite the known benefits of dietary diversification, rural smallholders in coastal and disaster-prone regions like Chattogram face systemic barriers. These include fragmented market linkages, limited access to climateresilient technologies and severe financing constraints (Ahmed et al., 2025; Hassan et al., 2010) [1,13] . Furthermore, post-harvest losses and inefficient supply chains consistently erode potential profit margins for perishable high-value commodities (Kaminski and Christiaensen, 2014; LightCastle Partners, 2023) [19,23] . Young Power in Social Action (YPSA) initiated the HVF&C Varieties Extension and Marketing project aimed to optimize production practices, promote Good Agricultural Practices (GAP) and establish robust backward and forward market linkages for smallholder farmers in Sitakunda and Mirsarai Upazilas. Central to this intervention is the hypothesis that targeted capacity building, financial support and market integration not only drive economic profitability but also empower women in agricultural decision making, ultimately leading to elevated HDD (Ruel and Alderman, 2013; Sraboni et al., 2014; IFAD, 2019) [32,14,18] . While broad literature supports the efficacy of value chain interventions (Torero, 2011; Trienekens, 2011) [34,35] , there remains a critical research gap regarding the localized, empirical impacts of such integrated microenterprise models on direct dietary outcomes in southeastern Bangladesh. This manuscript aims to bridge this gap by presenting a comprehensive comparative analysis between the RMTP endline beneficiary cohort and a non-intervention control group. Specifically, the study evaluates how shifts in agricultural decision making, land utilization, technological adoption, market channels and financial access function as direct pathways to achieving superior food security and HDD.
Methodology 2.1 Study area and design
The research employed a cross sectional comparative endline evaluation design to assess the outcomes of the HVF&C sub-project was conducted in the Chattogram district of Bangladesh. The beneficiary group was sampled from Sitakunda Upazila (unions including Bariyardhala, Sitakunda Sadar, Muradpur, Barbakund, Banshbaria, Bara Kumira, Sonaichari and Bhatiari) and Mirsarai Upazila (unions including Wahedpur, Khaiyachara and Mirsarai Municipality). The control group, mirroring the demographic and geographic characteristics of the beneficiary area but without project intervention, was selected from Hathazari Upazila (Fatehpur, Chattogram City Corporation Ward 1 and Chikondondi).
Sampling strategy and sample size
A mixed methods approach was utilized, though this manuscript focuses exclusively on the robust quantitative dataset. Statistical sampling was conducted using Cochran's formula to ensure a high confidence level and statistical significance. From a total project population of 6,038 households, a definitive quantitative sample size of N=433 was established. This cohort was strictly stratified into n=361 Beneficiary participants and a 20% proportional control group comprising n=72 non-beneficiary households.
Data collection and measurement indicators
Data were collected via semi structured, digitized questionnaires through direct interviews. The core measurement indicators assessed structural changes across seven domains: i. empowerment and decision making; ii. livelihood and income profiling; iii. land use and cropping patterns; iv. technology and climate adaptive practices; v. training and capacity building; vi. market linkages and postharvest management and vii. financial inclusion. To evaluate nutritional outcomes, the study utilized selfreported indicators of household food security, food availability and food quality/diversity as proxies for HDD, for measuring dietary diversity at the household level (Kennedy et al., 2011; FAO, 2011) [21,10] .
Data analysis
Quantitative data were processed and analyzed using SPSS and Microsoft Excel. Descriptive statistics, specifically frequencies and percentages, were calculated to systematically compare the performance and outcomes of the Beneficiary (n=361) and Control (n=72) groups.
Results
The empirical findings are presented through a comprehensive comparative analysis of the Beneficiary and Control cohorts. The tables and accompanying analyses highlight the major quantitative differences driven by the RMTP intervention. 1 demonstrates a substantial shift in intrahousehold empowerment and decision-making. Among beneficiaries, 89.5% reported a significant increase in their involvement in household financial decisions compared with before the project. In contrast, 58.3% of the control group reported no involvement, while only 6.9% reported significant involvement. A similar pattern was observed in agricultural planning, with 88.4% of beneficiaries significantly involved in agricultural decisions, compared with 43.1% of control households completely excluded and 51.4% reporting "somewhat" involvement.
Household financial and agricultural decision making: Table
Household financial and agricultural decision making: Table
Cultivable and leased land utilization and profitability:
Beneficiaries demonstrated superior land access, crop diversification, and profitability on both owned and leased land (Tables 3 and4). Almost all beneficiaries (98.6%) cultivated their own land, mainly using 11-30 decimal plots (49.3%), while controls primarily operated on smaller 1-10 decimal plots (44.4%). Beneficiaries diversified beyond cereals, cultivating vegetables (78.1%), pulses (74.8%), high-value fruits (46.3%), and spices/medicinal crops (12.5%). In contrast, controls cultivated fruits (2.8%), while pulses and spices were absent (0.0%). Consequently, 46.5% of beneficiaries achieved quarterly gross profits of BDT 15,001-40,000 on own land, compared with 2.8% of controls. Similarly, 85.0% of beneficiaries leased land versus 59.7% of controls, favoring vegetables (68.4%) and high-value fruits (56.5%). Thus, 49.3% earned BDT 15,001-40,000 quarterly, while losses affected 18.1% of controls compared with 3.3% of beneficiaries. 7 and8). An impressive 90.6% of beneficiaries changed their sales channels due to the project, gaining access to export and city markets (87
Access to financial support and constraints
Financial inclusion increased substantially through the intervention (Table 9). Overall, 95.3% of beneficiaries accessed financial support, mainly through MFIs/NGOs (65.1%) and cooperatives (26.3%). Within YPSA, beneficiaries used Buniyad (33.8%), Sufal (26.6%) and Jagoran (24.7%). Funds supported input purchases (52.1%), working capital (50.4%) and equipment/technology (45.4%). Key constraints included high interest rates (66.8%), lack of collateral (52.4%) and complex paperwork (46.8%). In contrast, 76.4% of controls remained excluded from formal financial support.
| Query | Category | Beneficiary (Count) | % of n=361 | Control (Count) | % of n=72 |
|---|---|---|---|---|---|
| Received financial support/loan | Yes | 344 | 95.3 | 17 | 23.6 |
| No | 17 | 4.7 | 55 | 76.4 |
Table text extracted from the original PDF; superscript letters are shown inline. The original table image is below.
View original table image
Discussion
From the RMTP endline assessment unequivocally demonstrates that comprehensive agricultural interventions targeting HVF&C can fundamentally transform rural microenterprises, driving profound improvements in HDD and sustainable livelihood metrics.
Economic transformation as a pathway to nutrition
The transition from staple centric, subsistence agriculture to commercial HVF&C acts as the primary engine for economic uplift (Birthal et al., 2013; Cock, 2020) [8,9] . Beneficiaries significantly outpaced controls in utilizing both owned (98.6%) and leased (85.0%) land for lucrative horticultural crops, moving decisively away from loweryield cereals. This structural shift yielded substantial economic returns, with 46.5% of beneficiaries reporting high quarterly profits on owned land. According to Pingali (2015) [29] and Kuma et al. (2019) [22] , increased agricultural income is arguably the most potent determinant of household food security. The socioeconomic impacts of HVF&C cultivation documented by Parvin et al. (2014) [28] and Rahman (2017) [30] are heavily corroborated by this study's data: as household income grew for 98.3% of beneficiaries, 59.6% reported directly improved purchasing capacity. This liquidity allowed households to transcend mere caloric sufficiency and purchase diverse food groups, directly leading to the 82.3% improvement in food quality and diversity observed among beneficiaries, mirroring the foundational findings of Arimond and Ruel (2004) [4] and aligning with the frameworks set forth by the FAO (2011) [10] .
The role of market integration and information technology:
A critical bottleneck in rural South Asian agriculture is the fragmented supply chain, which leads to high transaction costs and massive post-harvest losses (Hassan et al., 2010; Torero, 2011) [13,34] . The RMTP successfully dismantled these barriers by establishing direct market linkages and upgrading post-harvest infrastructure. 68.4% of beneficiaries successfully bypassed traditional middlemen to sell directly to consumers and 58.7% integrated with large institutional buyers (Big Arot).
Combined with rigorous post-harvest packaging using plastic sacks and polythene (97.0%), beneficiaries effectively curtailed product damage, addressing a vulnerability heavily documented in sub-Saharan and South Asian contexts (Kaminski and Christiaensen, 2014; Light Castle Partners, 2023) [19,23] . Furthermore, the integration of new technologies, such as mobile apps and online platforms, reported by 54.3% of beneficiaries, aligns with Zanello et al. (2014) [38] and Aker (2011) [2] , who highlight how ICT drastically lowers transaction costs for rural farmers. This commercial efficiency dramatically enhanced price realization for 62.3% of participants. The literature confirms that such insertion into advanced global and regional retail chains not only secures farmer welfare (Maertens and Swinnen, 2009;
Minten et al., 2009) [25,26] but indirectly elevates local nutritional landscapes by increasing the year round availability of micronutrient rich foods (Humphrey and Schmitz, 2002; Gómez and Ricketts, 2013) [16,11] .
Climate adaptive practices and sustainable intensification:
A standout dimension of the RMTP intervention was its success in embedding sustainable, climate adaptive practices into commercial agriculture. An overwhelming 93.9% of beneficiaries adopted climateadaptive technologies. The near universal utilization of biopesticides (94.5%) and bio-fertilizers (89.2%) indicates a profound behavioral shift toward ecological farming. As noted by Hossain and Pandit (2024) [15] , Hasan et al. (2025) [12] and Nale (2025) [27] , the commercialization and application of bio-pesticides and bio-agents in South Asia are crucial for safe food production and long term soil health. Furthermore, 89.2% of beneficiaries found these organic inputs cost effective compared to synthetic chemicals, mitigating the risks of input driven debt (Kassie et al., 2009) [20] . This massive adoption of climate-smart agronomy led to an 82.3% increase in reported yields among beneficiaries. This validates the assertions of Asfaw et al. (2016) [6] and Lipper et al. (2014) [24] that localized technological adaptation in vulnerable regions is paramount for maintaining productivity and food security amid climate variability.
Women's empowerment and intra household dynamics:
Agricultural commercialization can sometimes inadvertently marginalize women; however, the RMTP intervention actively fostered inclusivity (White, 2012; IFAD, 2019) [37,18] . 89.5% of beneficiaries experienced a significant increase in female involvement in financial decision making. Concurrently, 53.7% reported high overall participation of women in project activities. Literature consistently shows a strong positive correlation between women's empowerment in agriculture and household nutritional outcomes (Sraboni et al., 2014) [14] . When women exert control over agricultural income and microenterprise decisions, a substantially higher proportion of that income is allocated to dietary diversity and child health (Ruel and Alderman, 2013; Iannotti et al., 2014; FAO, 2011) [32,17,10] . Therefore, the 82.3% improvement in HDD among the intervention group is inextricably linked to the socio demographic shift empowering women as comanagers of the newly profitable farming enterprises.
Financial inclusion
Transforming subsistence farming into a competitive business requires robust capital access (Hazell et al., 2014) [14] . A highly inclusive financial environment where 95.3% of beneficiaries accessed customized loans, primarily via MFIs/NGOs. In stark contrast, 76.4% of the control group remained financially excluded. By directing these funds toward productive assets specifically, purchasing inputs (52.1%) and securing working capital (50.4%) beneficiaries
Figures and tables from the paper
| Query | Category | Beneficiary (Count) | % of n=361 | Control (Count) | % of n=72 |
|---|---|---|---|---|---|
| Involved in household financial decision making compared to before the project | Significantly | 323 | 89.5 | 5 | 6.9 |
| Somewhat | 38 | 10.5 | 25 | 34.7 |
Table text extracted from the original PDF; superscript letters are shown inline. The original table image is below.
View original table image
| Query | Category | Beneficiary (Count) | % of n=361 | Control (Count) | % of n=72 |
|---|---|---|---|---|---|
| Respondent or head of the household main occupation | Farming/Agriculture | 313 | 86.7 | 47 | 65.3 |
| Livestock | 7 | 1.9 | 6 | 8.3 | |
| Business/Trading | 29 | 8.0 | 6 | 8.3 | |
| Service/Job | 3 | 0.8 | 1 | 1.4 | |
| Daily labor | 3 | 0.8 | 9 | 12.5 | |
| Handicrafts | 3 | 0.8 | ---- | ---- | |
| Others | 3 | 0.8 | 3 | 4.2 | |
| Monthly income by main occupation | Less than 5,000 BDT | 23 | 6.4 | 11 | 15.3 |
| 5,001 - 10,000 BDT | 33 | 9.1 | 44 | 61.1 | |
| 10,001 - 20,000 BDT | 186 | 51.5 | 16 | 22.2 | |
| 20,001 - 30,000 BDT | 77 | 21.3 | 1 | 1.4 | |
| 30,001 - 50,000 BDT | 32 | 8.9 | --- | --- | |
| Above 50,000 BDT | 10 | 2.8 | --- | --- | |
| Yearly income generated by another household member | Less than 10,000 BDT | 48 | 13.3 | 30 | 41.7 |
| 10,001 - 20,000 BDT | 147 | 40.7 | 31 | 43.1 | |
| 20,001 - 40,000 BDT | 132 | 36.6 | 10 | 13.9 | |
| 40,001 - 70,000 BDT | 34 | 9.4 | 1 | 1.4 | |
| Household income changed due to the project | Yes | 355 | 98.3 | 7 | 9.7 |
| No | 6 | 1.7 | 65 | 90.3 |
Table text extracted from the original PDF; superscript letters are shown inline. The original table image is below.
View original table image
| Query | Category | Beneficiary (Count) | % of n=361 | Control (Count) | % of n=72 |
|---|---|---|---|---|---|
| Have any own cultivable land | Yes | 356 | 98.6 | 38 | 52.8 |
| No | 5 | 1.4 | 34 | 47.2 | |
| Total area (in decimal) | 1-10 decimal | 69 | 19.1 | 32 | 44.4 |
| 11-30 decimal | 178 | 49.3 | 6 | 8.3 | |
| 31-60 decimal | 88 | 24.4 | ---- | ---- | |
| 61-100 decimal | 20 | 5.5 | ---- | ---- | |
| 101 to above decimal | 1 | 0.3 | ---- | ---- | |
| Cultivated Main Crops | Rice/ Maize/ Wheat / Jute | 313 | 86.7 | 35 | 48.6 |
| Pulses | 270 | 74.8 | 0 | 0.0 | |
| Vegetables | 282 | 78.1 | 23 | 31.9 | |
| High-Value Fruits | 167 | 46.3 | 2 | 2.8 | |
| Spices/ Medicinal/ Aromatic | 45 | 12.5 | 0 | 0.0 | |
| Other Crops | 166 | 46.0 | 0 | 0.0 |
Table text extracted from the original PDF; superscript letters are shown inline. The original table image is below.
View original table image
| Quarterly Gross profit (BDT) | Loss (< 0) | 23 | 6.4 | 9 | 12.5 |
|---|---|---|---|---|---|
| 0-15,000 | 153 | 42.4 | 27 | 37.5 | |
| 15,001-40,000 | 168 | 46.5 | 2 | 2.8 | |
| 40,001-1,00,000 | 12 | 3.3 | --- | --- |
Table text extracted from the original PDF; superscript letters are shown inline. The original table image is below.
View original table image
| Query | Category | Beneficiary (Count) | % of n=361 | Control (Count) | % of n=72 |
|---|---|---|---|---|---|
| Have any leased cultivable land | Yes | 307 | 85.0 | 43 | 59.7 |
| No | 54 | 15.0 | 29 | 40.3 | |
| Total area (in decimal) | 1–50 decimal | 163 | 45.2 | 38 | 52.8 |
| 51–100 decimal | 93 | 25.8 | 5 | 6.9 | |
| 101–200 decimal | 42 | 11.6 | — | — | |
| 201–500 decimal | 9 | 2.5 | — | — | |
| Cultivated Main Crops | Rice/Maize/Wheat/Jute | 223 | 61.8 | 37 | 51.4 |
| Pulses | 196 | 54.3 | 8 | 11.1 | |
| Vegetables | 247 | 68.4 | 41 | 56.9 | |
| High-Value Fruits | 204 | 56.5 | 5 | 6.9 | |
| Spices/Medicinal/Aromatic | 71 | 19.7 | 2 | 2.8 | |
| Other Crops | 158 | 43.8 | 3 | 4.2 | |
| Quarterly Gross profit (BDT) | Loss (< 0) | 12 | 3.3 | 13 | 18.1 |
| 0–15,000 | 95 | 26.3 | 19 | 26.4 | |
| 15,001–40,000 | 178 | 49.3 | 11 | 15.3 | |
| 40,001–1,00,000 | 22 | 6.1 | — | — |
Table text extracted from the original PDF; superscript letters are shown inline. The original table image is below.
View original table image
| Query | Category | Beneficiary (Count) | % of n=361 | Control (Count) | % of n=72 |
|---|---|---|---|---|---|
| Knowledge/following climate adaptive tech | Have knowledge; I follow | 339 | 93.9 | 4 | 5.6 |
| Have knowledge; I don’t follow | 15 | 4.2 | 12 | 16.7 | |
| Have no knowledge | 7 | 1.9 | 56 | 77.8 | |
| Specific agronomic practices | Bio Pesticide | 341 | 94.5 | 10 | 13.9 |
| Bio Fertilizer | 322 | 89.2 | 1 | 1.4 | |
| Pheromone Trap | 146 | 40.4 | 1 | 1.4 | |
| Fruits Bag | 147 | 40.7 | 3 | 4.2 | |
| Others | 203 | 56.2 | 44 | 61.1 | |
| Availability of bio inputs at nearby market | Yes | 346 | 95.8 | 3 | 4.2 |
| No | 14 | 3.9 | 69 | 95.8 | |
| Cost-effective compared to chemical inputs | Cost effective | 322 | 89.2 | 3 | 4.2 |
| Costly | 39 | 10.8 | 69 | 95.8 | |
| Impact in production cost or yield | Increased production cost | 198 | 54.8 | 1 | 1.4 |
| Decreased production cost | 144 | 39.9 | 1 | 1.4 | |
| Increased yield | 297 | 82.3 | 2 | 2.8 | |
| Decreased yield | 10 | 2.8 | --- | --- | |
| No significant change | 6 | 1.7 | 10 | 13.9 | |
| Perceive the overall environmental impact | Positive | 351 | 97.2 | 2 | 2.8 |
| Negative | 4 | 1.1 | 29 | 40.3 | |
| No change | 4 | 1.1 | 36 | 50.0 | |
| Adopted/improved technology via project | Farming/Agricultural technology | 337 | 93.4 | 2 | 2.8 |
| Processing/Manufacturing tech | 270 | 74.8 | 0 | 0.0 | |
| Digital/ICT technology | 169 | 46.8 | 0 | 0.0 | |
| Others | 186 | 51.5 | 1 | 1.4 | |
| Impact of this technology | Increased productivity | 313 | 86.7 | ---- | ---- |
Table text extracted from the original PDF; superscript letters are shown inline. The original table image is below.
View original table image
| Query | Category | Beneficiary (Count) | % of n=361 | Control (Count) | % of n=72 |
|---|---|---|---|---|---|
| Received training (technical/managerial) | Yes | 353 | 97.8% | 8 | 11.1% |
| No | 4 | 1.1 | 64 | 88.9 | |
| Provided the training organization | RMTP/YPSA Staff | 329 | 91.1 | 1 | 1.4 |
| Research or academic institution | 34 | 9.4 | 0 | 0.0 | |
| Government agricultural dept. | 103 | 28.5 | 3 | 4.2 | |
| NGO / Development organization | 184 | 51.0 | 7 | 9.7 | |
| Private company/Fertilizer supplier | 47 | 13.0 | 2 | 2.8 | |
| Farmer cooperatives/Associations | 45 | 12.5 | 1 | 1.4 | |
| Others | 97 | 26.9 | 0 | 0.0 | |
| Specify the topics covered in training | Proper use of organic fertilizers | 333 | 92.2 | 8 | 11.1 |
| Benefits for crops/environment | 263 | 72.9 | 1 | 1.4 | |
| Marketing and sales techniques | 247 | 68.4 | 1 | 1.4 | |
| Safe storage and handling | 164 | 45.4 | 3 | 4.2 | |
| Composting/bio-fertilizer prod | 200 | 55.4 | 1 | 1.4 | |
| Cost-benefit and record keeping | 95 | 26.3 | 4 | 5.6 | |
| Climate-resilient practices | 167 | 46.3 | 0 | 0.0 | |
| Digital/online marketing | 103 | 28.5 | 1 | 1.4 | |
| Others | 180 | 49.9 | 3 | 4.2 | |
| How training improved capacity | Improved technical skills | 306 | 84.8 | 6 | 8.3 |
| Improved skills | 270 | 74.8 | 5 | 6.9 | |
| Improved financial management | 223 | 61.8 | 0 | 0.0 | |
| Improved knowledge on quality | 209 | 57.9 | 3 | 4.2 | |
| Improved ability to find buyers | 127 | 35.2 | 0 | 0.0 | |
| Other | 191 | 52.9 | 1 | 1.4 |
Table text extracted from the original PDF; superscript letters are shown inline. The original table image is below.
View original table image
| Query | Category | Beneficiary (Count) | % of n=361 | Control (Count) | % of n=72 |
|---|---|---|---|---|---|
| Sales channels changed due to project | Yes | 327 | 90.6 | 4 | 5.6 |
| No | 5 | 1.4 | 60 | 83.3 | |
| Somewhat | 29 | 8.0 | 2 | 2.8 | |
| How channels or methods changed | Increased access to new markets | 314 | 87.0 | 4 | 5.6 |
| Improved price realization | 225 | 62.3 | 1 | 1.4 | |
| Sell directly to consumers | 247 | 68.4 | 0 | 0.0 | |
| Selling through cooperatives | 192 | 53.2 | 0 | 0.0 | |
| Using new technologies | 196 | 54.3 | 0 | 0.0 | |
| Improved negotiation skills | 139 | 38.5 | 0 | 0.0 | |
| Diversification of sales channels | 88 | 24.4 | 0 | 0.0 | |
| Supports linked to project interventions | Training | 290 | 80.3 | 9 | 12.5 |
| Finance | 205 | 56.8 | 1 | 1.4 | |
| Packaging | 210 | 58.2 | 0 | 0.0 | |
| Transport | 186 | 51.5 | 0 | 0.0 | |
| Others | 188 | 52.1 | 18 | 25.0 | |
| Promotion of product sale | Customer visits at orchard | 231 | 64.0 | 9 | 12.5 |
| Personal communication | 297 | 82.3 | 21 | 29.2 | |
| Online promotion | 184 | 51.0 | 4 | 5.6 | |
| Others | 211 | 58.4 | 24 | 33.3 | |
| Project improved promotional activities | Yes | 339 | 93.9 | 0 | 0.0 |
| No | 20 | 5.5 | 100 | 0.0 | |
| Partnership with any buyer for sales | Big Arot | 212 | 58.7 | 1 | 1.4 |
| Contract farming | 168 | 46.5 | 7 | 9.7 | |
| Processing company | 122 | 33.8 | 0 | 0.0 | |
| Others | 200 | 55.4 | 64 | 88.9 |
Table text extracted from the original PDF; superscript letters are shown inline. The original table image is below.
View original table image
| Query | Category | Beneficiary (Count) | % of n=361 | Control (Count) | % of n=72 |
|---|---|---|---|---|---|
| Preservation Methods of fruits | Store room (normal temp) | 152 | 42.1% | 3 | 4.2 |
| Local cold storage | 142 | 39.3 | 1 | 1.4 | |
| Don’t store, sell same day | 65 | 18.0 | 68 | 94.4 | |
| Packaging during sales to Arot | Yes | 350 | 97.0 | 7 | 9.72 |
| No | 8 | 2.2 | 65 | 90.28 | |
| Types of used packaging | Jute bags/sacks | 198 | 54.8 | 2 | 2.8 |
| Plastic sacks/bags | 275 | 76.2 | 2 | 2.8 | |
| Wooden crates | 75 | 20.8 | 0 | 0.0 | |
| Bamboo baskets | 141 | 39.1 | 1 | 1.4 | |
| Polythene sheets | 254 | 70.4 | 1 | 1.4 | |
| No specific packaging | 58 | 16.1 | 39 | 54.2 | |
| Other | 78 | 21.6 | 1 | 1.4 | |
| Face any product damage | No loss | 86 | 23.8 | 1 | 1.4 |
| Up to 5% of total value | 220 | 60.9 | 26 | 36.1 | |
| 5% - 10% of total value | 40 | 11.1 | 8 | 11.1 | |
| More than 10% of total value | 5 | 1.4 | 3 | 4.2 | |
| Don't know/Can't calculate | 6 | 1.7 | 27 | 37.5 |
Table text extracted from the original PDF; superscript letters are shown inline. The original table image is below.
View original table image
| Query | Category | Beneficiary (Count) | % of n=361 | Control (Count) | % of n=72 |
|---|---|---|---|---|---|
| Changes in production/sales/profit | Increased production | 299 | 82.8% | 3 | 4.2 |
| Increased sales | 235 | 65.1 | 1 | 1.4 | |
| Increased profit/income | 225 | 62.3 | 0 | 0.0 | |
| Better product quality | 197 | 54.6 | 0 | 0.0 | |
| Improved market access | 173 | 47.9 | 1 | 1.4 | |
| No significant change | 25 | 6.9 | 48 | 66.7 | |
| Others | 167 | 46.3 | 8 | 11.1 | |
| Household food security improved | Improved food availability | 291 | 80.6 | 2 | 2.8 |
| Improved food quality/diversity | 297 | 82.3 | 4 | 5.6 | |
| Improved purchasing capacity | 215 | 59.6 | 0 | 0.0 | |
| No improvement | 17 | 4.7 | 51 | 70.8 | |
| Others | 139 | 38.5 | 6 | 8.3 | |
| Project contribution to enterprise | Improved technical skills | 314 | 87.0 | 5 | 6.9 |
| Improved business skills | 282 | 78.1 | 2 | 2.8 | |
| Improved financial management | 218 | 60.4 | 1 | 1.4 | |
| Improved market linkages | 119 | 33.0 | 1 | 1.4 | |
| Others | 177 | 49.0 | 42 | 58.3 | |
| Women's participation in project | High participation | 194 | 53.7 | 0 | 0.0 |
| Moderate participation | 156 | 43.2 | 9 | 12.5 | |
| Low participation | 8 | 2.2 | 23 | 31.9 | |
| No participation | 1 | 0.3 | 39 | 54.2 | |
| Age group of participants | 18-25 years | 229 | 63.4 | ----- | ----- |
| 26-35 years | 102 | 28.3 | ----- | ----- | |
| 36-50 years | 26 | 7.2 | ----- | ----- | |
| 50+ years | 1 | 0.3 | ----- | ----- | |
| Recommendations for future | Provide more training | 342 | 94.7 | 52 | 72.2 |
| Improve access to finance | 302 | 83.7 | 67 | 93.1 |
Table text extracted from the original PDF; superscript letters are shown inline. The original table image is below.
View original table image
References
36 in the original paper- Ahmed S, Debnath M, Haque A, Bhandari H. Transforming Bangladesh's coastal agriculture needs bridging innovation with policy action. Int Rice Res Inst. 2025:1-13.
- Aker JC. Dial "A" for agriculture: a review of information and communication technologies for agricultural extension in developing countries. Agric Econ. 2011;42(6):631-647. DOI:10.1111/j.1574-0862.2011.00545.x.
- Ali M. Horticulture revolution for the poor: nature, challenges and opportunities. Washington, DC: World Bank; 2008. DOI:10.1596/9127.
- Arimond M, Ruel MT. Dietary diversity is associated with child nutritional status: evidence from 11 demographic and health surveys. J Nutr. 2004;134(10):2579-2585. DOI:10.1093/jn/134.10.2579.
- Asaduzzaman M. Agriculture and rural development in Bangladesh: a review. Bangladesh Dev Stud. 2010;33(1):1-32.
- Asfaw S, Di Battista F, Lipper L. Agricultural technology adoption under climate change in the Sahel: micro-evidence from Niger. J Afr Econ. 2016;25(5):637-669. DOI:10.1093/jae/ejw005.
- Awotide BA, Karimov AA, Diagne A. Agricultural technology adoption, commercialization and smallholder rice farmers' welfare in rural Nigeria. Agric Econ. 2016;4(1):2-24. DOI:10.1186/s40100-0160047-8.
- Birthal PS, Joshi PK, Roy D, Thorat A. Diversification in Indian agriculture toward high-value crops: the role of small farmers. Can J Agric Econ. 2013;61(1):61-91. DOI:10.1111/j.1744-7976.2012.01258.x.
- Cock JH. High-value fruits and crops: opportunities and challenges for rural development. Agric Syst. 2020;182:102832.
- FAO. Guidelines for measuring household and individual dietary diversity. Rome: Food and Agriculture Organization of the United Nations; 2011.
- Gómez MI, Ricketts KD. Food value chain transformations in developing countries: selected hypotheses on nutritional implications. Food Policy. 2013;42:139-150. DOI:10.1016/j.foodpol.2013.06.010.
- Hasan ME, Mithila ST, Akhter S, Sifa M, Ratul AA, Rahman MM. Assessment of farmers' knowledge, attitude and challenges towards biofertilizer application in the Northern Region of Bangladesh. Eur J Sustain Dev Res. 2025;9(2):279-289. DOI:10.29333/ejosdr/15941.
- Hassan MK, Halim MA, Hossain MI. Value chain analysis of fruits and vegetables in Bangladesh. J Agric Sci Technol. 2010;12(3):263-274.
- Hazell PBR, Rahman A, editors. New directions for smallholder agriculture. Oxford: Oxford University Press; 2014. DOI:10.1093/acprof:oso/9780199689347.001.0001. 15. Hossain ST, Pandit T. Applications and commercialization of bio-pesticides in Bangladesh. FFTC J Agric Policy. 2024;7:22-31.
- Humphrey J, Schmitz H. How does insertion in global value chains affect upgrading in industrial clusters? Reg Stud. 2002;36(9):1017-1027. DOI:10.1080/0034340022000022198.
- Iannotti LL, Lutter CK, Bunn DA, Stewart CP. Eggs: the uncracked potential for improving maternal and young child nutrition among the world's poor. Nutr Rev. 2014;72(6):355-368. DOI:10.1111/nure.12107.
- IFAD. Rural development report 2019: creating opportunities for rural youth. Rome: International Fund for Agricultural Development; 2019.
- Kaminski J, Christiaensen L. Post-harvest loss in subSaharan Africa: what do farmers say? Glob Food Sec. 2014;3(3-4):149-158. DOI:10.1016/j.gfs.2014.10.002.
- Kassie M, Zikhali P, Manjur K, Edwards S. Adoption of sustainable agriculture practices: evidence from a semi-arid region of Ethiopia. Nat Resour Forum. 2009;33(3):189-198. DOI:10.1111/j.1477-8947.2009.01224.x.
- Kennedy G, Ballard T, Dop MC. Guidelines for measuring household and individual dietary diversity. Rome: Food and Agriculture Organization of the United Nations; 2011.
- Kuma T, Dereje M, Hirvonen K, Minten B. Cash crops and food security: evidence from Ethiopian smallholder coffee producers. J Dev Stud. 2019;55(6):1267-1284. DOI:10.1080/00220388.2018.1425396.
- LightCastle Partners. Bangladesh horticultural value chain: overcoming long-standing challenges. Dhaka: LightCastle Partners; 2023.
- Lipper L, Thornton P, Campbell BM, Baedeker T, Braimoh A, Bwalya M, et al. Climate-smart agriculture for food security. Nat Clim Chang. 2014;4(12):10681072. DOI:10.1038/nclimate2437.
- Maertens M, Swinnen JFM. Trade, standards and poverty: evidence from Senegal. World Dev. 2009;37(1):161-178. DOI:10.1016/j.worlddev.2008.04.006.
- Minten B, Randrianarison L, Swinnen JF. Global retail chains and poor farmers: evidence from Madagascar. World Dev. 2009;37(11):1728-1741. DOI:10.1016/j.worlddev.2008.08.024.
- Nale GS. Biofertilizers and bioagents in Indian agriculture: scientific mechanisms, quality standards and legal regulatory framework. Agritech Publ. 2025;3(8):35-37. DOI:10.5281/zenodo.17838405.
- Parvin MT, Ali MH, Rahman MM. Socio-economic impacts of high value crops cultivation on rural livelihoods in Bangladesh. Asian J Agric Ext Econ Sociol. 2014;3(4):301-312.
- Pingali P. Agricultural policy and nutrition outcomes: getting beyond the preoccupation with staple grains. Food Sec. 2015;7(3):583-591. DOI:10.1007/s12571-015-0461-x.
- Rahman S. High value crops and rural poverty in Bangladesh. J Dev Econ. 2017;45(2):234-245.
- Reardon T, Timmer CP. The economics of the food system revolution. Annu Rev Resour Econ. 2012;4(1):225-264. DOI:10.1146/annurev.resource.050708.144147. 32. Ruel MT, Alderman H. Nutrition-sensitive interventions and programmes: how can they help to accelerate progress in improving maternal and child nutrition? Lancet. 2013;382(9891):536-551.
- Sraboni E, Malapit HJ, Quisumbing AR, Ahmed AU. Women's empowerment in agriculture: what role for food security in Bangladesh? World Dev. 2014;61:1152. DOI:10.1016/j.worlddev.2014.03.025.
- Torero M. A framework for linking small farmers to markets. Paper presented at: IFAD Conference on New Directions for Smallholder Agriculture; 2011; Rome, Italy. International Fund for Agricultural Development; 2011.
- Trienekens JH. Agricultural value chains in developing countries: a framework for analysis. Int Food Agribus Manag Rev. 2011;14(2):51-83. DOI:10.22004/ag.econ.103987.
- Weinberger K, Lumpkin TA. Diversification into horticulture and poverty reduction: a research agenda. World Dev. 2007;35(8):1464-1480. DOI:10.1016/j.worlddev.2007.05.002.
- White B. Agriculture and the generation problem: rural youth, employment and the future of farming. IDS Bull. 2012;43:9-19. DOI:10.1111/j.1759-5436.2012.00375.x.
- Zanello G, Srinivasan CS, Shankar B. Transaction costs, information technologies and the choice of marketplace among farmers in northern Ghana. J Dev Stud. 2014;50(9):1226-1239. DOI:10.1080/00220388.2014.903244.