
Research article · 2026 · Full text
International Journal of Geography Geology and EnvironmentSpatio-temporal assessment of climate variability and its influence on mangrove ecosystem dynamics along the bapatla coast, Andhra Pradesh (1996-2026)
Volume 8(9) · Pages 42–50 · DOI: 10.22271/27067483.2026.v8.i9a.864 ↗
Research areasCoastal wetland ecosystem dynamicsCoastal and Marine DynamicsWetland Management and Conservation
Abstract
Author-writtenMangroves are very crucial and important ecosystems that protect coastal areas; however, they can be vulnerable to climate fluctuations and anthropogenic activities. The current research analysed the changes in climate factors, namely, the amount of rainfall and temperature, and the mangrove cover in the Bapatla coastal panchayat, Andhra Pradesh, over 30 years (1996-2026). First of all, the current study utilised the time series of decadal statistical patterns of mangrove cover to explore its spatial variations with the annual trends of climate factors. Furthermore, the study employed the Normalised Difference Vegetation Index (NDVI) to estimate the percentage of mangrove vegetation in the research site based on decadal spatial mapping and annual time series analysis consistent with the Global Mangrove Watch. The current research found that the NDVI of mangroves demonstrated a significant long-term positive tendency (p-value<0.05) with a high strength (R² = 0.7003), ranging from 110 km 2 in 1996 to a peak of 170 km 2 around 2023 and a sudden decrease to 130 km 2 in 2026. On the other hand, the annual variation of rainfall and temperature was nearly chaotic, with insignificant long-term trends (p-value=R² = 0.0393 and 0.0087). Moreover, the spatial analysis revealed that the growth of mangroves was mainly observed along the coast of Nizampatnam, Karlapalem, and Repalle, whereas a small area was noted in Chinaganjam. Meanwhile, there were no mangroves in the internal and northern mandals. Overall, the current study concluded that the growth of mangroves is more likely associated with favourable climate conditions over multiple years rather than a linear long-term trend, and the recent decline was probably triggered by the deviation of temperature and rainfall.
Summary
Source-checkedPlain-language reading of the full paper, prepared with AI and checked against the text. Each point links to the authors' own words.
Why it matters
- Mangrove forests are vital ecosystems that provide essential services including shoreline protection, nutrient cycling, and carbon sequestration to help mitigate climate change. View evidence ↗
- The health, distribution, and function of mangroves are highly sensitive to climate change and depend on factors like temperature, rainfall, and salinity. View evidence ↗
- Mangroves on India's eastern coast are diverse but face threats from both human activities and natural disturbances such as cyclones and erosion. View evidence ↗
The question
- The study aims to investigate the relationship between long-term climate variability and changes in mangrove forest cover along the Bapatla coast. View evidence ↗
What they did
- The research analyzed rainfall, temperature, and mangrove cover in the Bapatla coastal panchayat of Andhra Pradesh over a 30-year period from 1996 to 2026. View evidence ↗
- The study used the Normalised Difference Vegetation Index (NDVI), remote sensing, and GIS to evaluate vegetation cover trends. View evidence ↗
- Mangrove information was extracted using Surface Reflectance data from Landsat 5, 7, 8, and 9 sensors. View evidence ↗
- Annual rainfall and temperature were characterized using CHIRPS v3 daily precipitation data and ERA5-Land daily aggregated data. View evidence ↗
What they found
- Mangrove cover showed a significant long-term positive trend (R² = 0.7003), increasing from 110 km² in 1996 to a peak of 170 km² around 2023, before dropping to 130 km² in 2026. View evidence ↗
- Annual rainfall and temperature variations were found to be chaotic, with insignificant long-term trends (R² = 0.0393 for rainfall and 0.0087 for temperature). View evidence ↗
- Mangrove growth was primarily concentrated along the coasts of Nizampatnam, Karlapalem, and Repalle, with only a small area in Chinaganjam. View evidence ↗
- No mangrove vegetation was found in the northern or internal mandals of the study area. View evidence ↗
- The sudden decline in mangrove cover to 130 km² in 2026 coincided with a decrease in temperature (30.61-32.87 °C) and rainfall levels falling below previous peaks. View evidence ↗
What it means
- The authors conclude that mangrove growth is driven by favorable climate conditions over several years rather than a linear trend, and the recent decline was likely caused by deviations in temperature and rainfall. View evidence ↗
- The study recommends prioritizing the conservation of the central coastal mandals of Nizampatnam, Karlapalem, and Repalle because of their high mangrove cover. View evidence ↗
- The authors suggest that future research should evaluate trends beyond 2026 and consider the impact of rising sea levels and coastal process changes. View evidence ↗
Visual summary
1 visualsIllustrations explain the paper; they do not show study data.
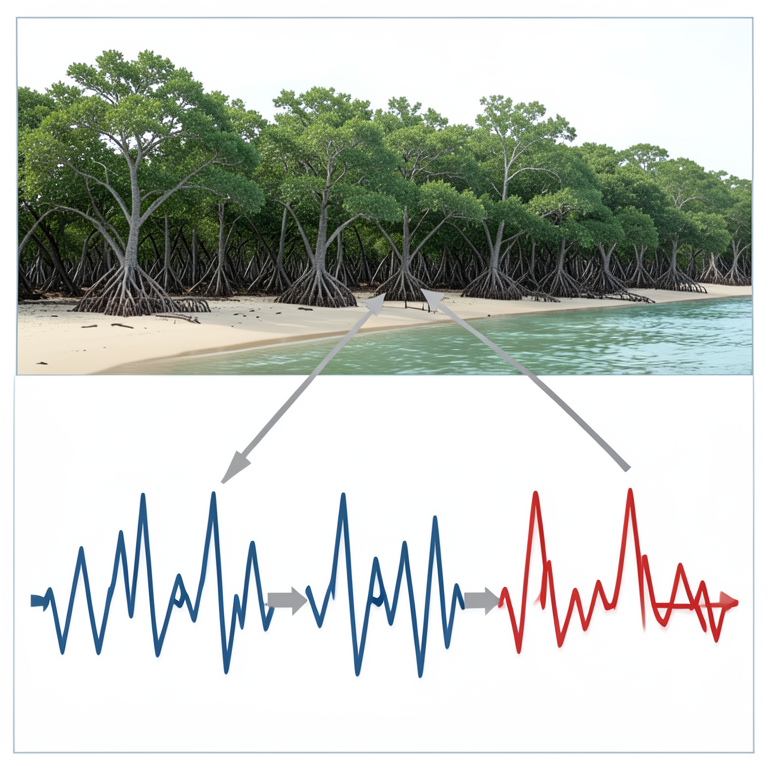
Mangrove Growth vs Climate Volatility
AI-generated conceptual illustration (Mangrove forests along a tropical coastline). It explains the idea and does not show study data.
View source evidence ↗Figures & tables
From the original paper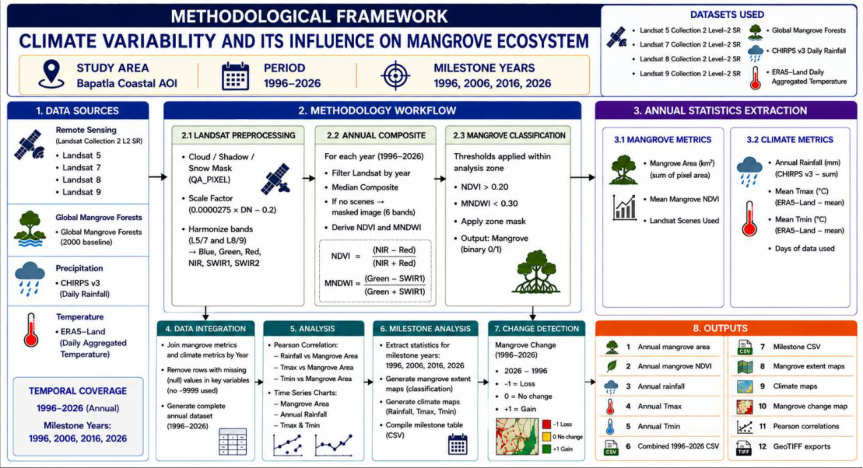 Figure 1
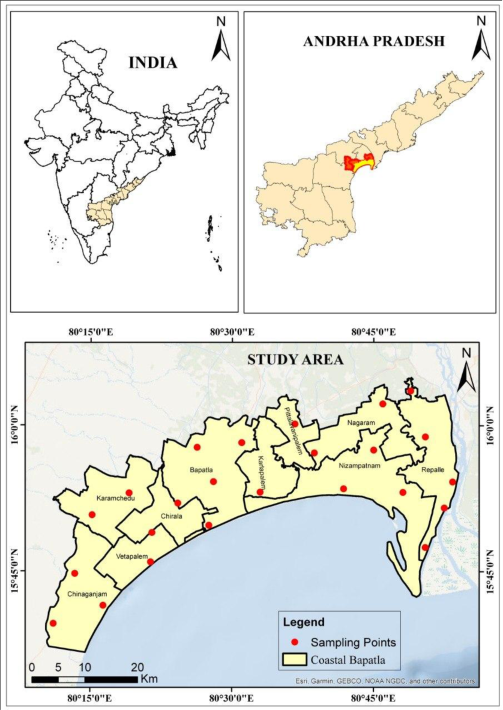 Figure 2
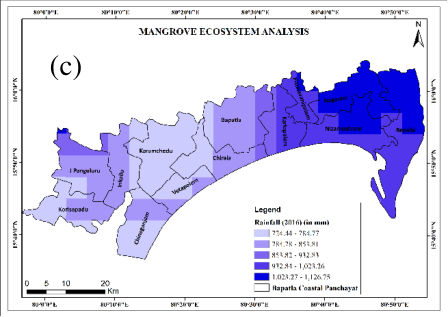 Figure 3
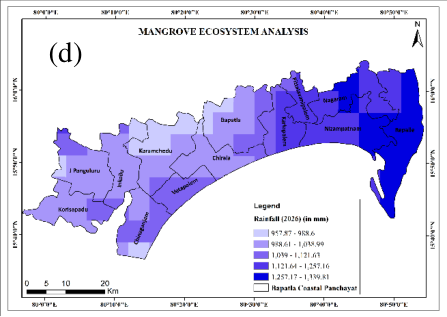 Figure 3
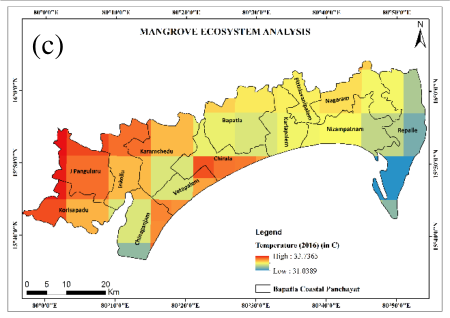 Figure 4
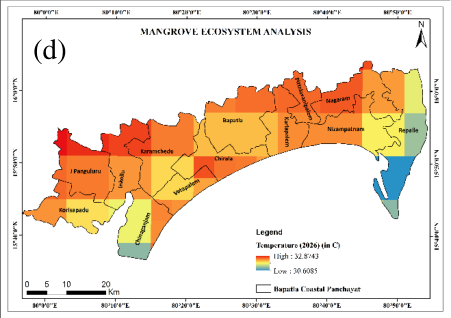 Figure 4
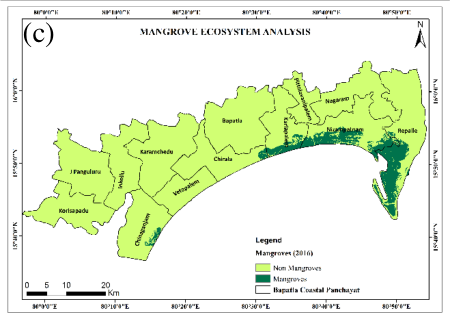 Figure 5
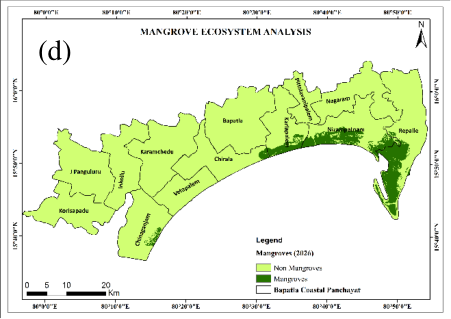 Figure 5
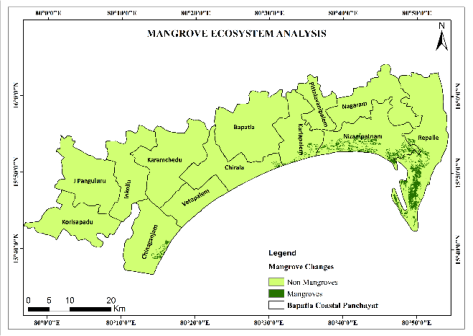 Figure 6
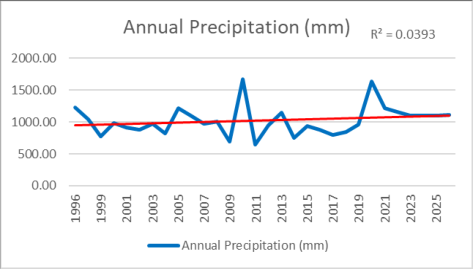 Figure 7
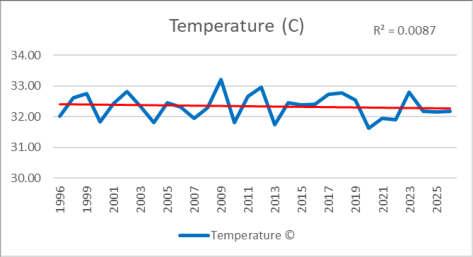 Figure 8
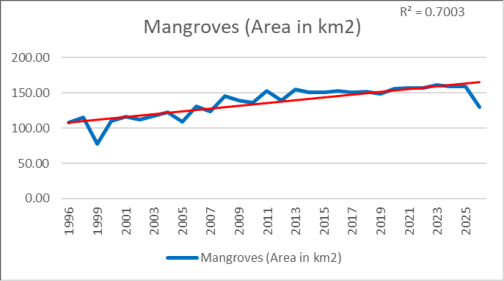 Figure 9
Introduction
Mangrove Forests are highly productive and dynamic ecosystems that provide a wide range of goods and services to coastal tropical and subtropical communities, such as shoreline protection and stabilization, nutrient cycling and retention, and significant carbon stocks, offering carbon sequestration and storage capacities, and playing an important role in climate change mitigation (Spalding et al., 2010; Atwood et al., 2017; Donato et al., 2011) [3,5,16] . They are located mainly in tidal flats, estuaries, lagoons, deltas, and other sheltered coastal saline landforms (Alongi, 2009) [1] . Mangrove health depends upon temperature, rainfall, freshwater availability, tides, salinity, sedimentation, and wave action, making them highly sensitive to climate change, which determines mangrove distribution, structure, and function (Gilman et al., 2008; Ward et al., 2016) [7,19] . Temperature changes may affect plant physiology and productivity and promote species invasion; moreover, sea-level rise can cause mangroves to migrate inland or seaward or become permanently submerged (Lovelock et al., 2015; Saintilan et al., 2020) [13,15] . Therefore, to understand regional forest responses and adaptations, the analysis of climate variability both short-and long-term is critical. Recent studies highlight that anthropogenic activities have converted significant mangrove areas to other land cover types (Valiela et al., 2001; Polidoro et al., 2010) [14,18] . Indeed, the net change in mangrove distribution has been inconsistent throughout the continent since the 1990s (Hamilton & Casey, 2016; Goldberg et al., 2020) [9,10] . Global Mangrove Watch allows for analysing land cover changes at a continental scale from 1996 to 2021 (Bunting et al., 2022) [4] . If year-over-year analysis shows inter-annual variability, a decade-scale assessment reveals patterns of change across different study sites.
Indian mangroves, especially those located along the eastern coast and found in estuaries and deltas, are highly diverse, widespread, and threatened by natural (cyclones, erosion, silting) and anthropogenic disturbances (Forest Survey of India, 2023) [6] . Their status needs to be evaluated using Earth observation data. Andhra Pradesh, India's East Coast state, is recognised for its large-scale mangrove forests under seasonal climatic variations (rainfall, cyclones, and droughts). The region around Bapatla is a low-lying coastal tract exposed to natural and human-induced environmental changes that might influence land cover. For instance, natural climate variability may increase biomass production through rising temperatures, impact the number of canopies, and promote saline water intrusion during cyclones and droughts. At the same time, monsoon floods may lead to increased freshwater discharge and silting affecting estuarine forest ecosystems. Moreover, long-term evaluation highlights that vegetation cover changes on both a decadal and inter-annual scale determine forest response to climatic variability. Therefore, earth observation methods are necessary to detect the associations between environmental/climate factors and forest cover changes. Normalised Difference Vegetation Index (NDVI) is a valuable indicator to assess trends in mangrove forests since remote sensing technologies, such as Landsat or Sentinel-2 satellites, allow for quantifying vegetation cover at different dates (Landsat's temporal resolution is appropriate for a decadal-scale assessment while Sentinel-2's high-resolution is optimal for small-scale mangrove mapping). The comparison of vegetation indices with climate data will highlight the possible relationships. Overall, remote sensing technologies and GIS can provide a comprehensive understanding of the relationship between climate change and mangrove forest cover changes (Kuenzer et al., 2011; Thomas et al., 2017) [12,17] . The long-term assessment of mangrove forests is crucial because their distribution ranges from year to year, showing both gains and losses over time (Goldberg et al., 2020) [9] . The analysis of inter-annual and decadal changes in mangrove forest cover in India's East Coast and its association with climate variability highlights possible mechanisms in the Bapatla region, which will further help to identify the climate change impact. Mangroves' ecosystem services such as shoreline protection, breeding and nursery grounds for commercial fish and shellfish, improving water quality, serving as carbon sinks, and decreasing erosion make them highly important for coastal communities (Donato et al., 2011; Alongi, 2014) [2,5] . Their current and future status is closely related to the state and resilience of mangrove forests. Therefore, a long-term assessment of their dynamic changes is critical to understanding their response to climate change. This study aims to analyse long-term climate trends and their impact on mangrove forests in the study area, investigating potential relationships between climate variability and forest cover changes. The research will employ NDVI data for the 1996-2026 period to evaluate vegetation cover trends, applying remote sensing and GIS to study the relationship between climate change and mangrove forests along the Bapatla coast. The study area was selected because of the high diversity of mangrove forests, high exposure to climate change, and the availability of remote sensing data for the study area. Decadal analysis of the climate and NDVI trends will be used to identify patterns of climate change and mangrove forest cover dynamics for the past three decades (following the Global Mangrove Watch initiative, 1996-2021; Bunting et al., 2022) [4] .
Data and Methodology 2.1 Data
The current work utilises satellite imagery and climatic datasets that are appropriate for long-term mangrove monitoring. In particular, Landsat Collection 2 Level-2 Surface Reflectance data from Landsat 5, Landsat 7, Landsat 8, and Landsat 9 sensors were applied to extract mangrove information. For mangrove baseline/reference data, Global Mangrove Forests were used, which define the mangrove analysis area. The former was used as an input layer for training the random forest classifier, whereas the latter was utilised to determine the extent of mangrove cover throughout the study region. In addition, CHIRPS v3 daily precipitation data and ERA5-Land daily aggregated data were employed to characterise the annual amount of rainfall and temperature, respectively. The processed data were combined and analysed as a function of time to establish a relationship between the climate conditions and the status of the mangrove forest.
Methodology
Methodology
Objectives of the Study
1. To study the status of mangrove cover in Bapatla coast (1996-2026). 2. To examine the pattern of rainfall and temperature during 1996-2026. 3. To understand the association between climatic factors and mangrove cover.
Study Area
The study area falls under the Bapatla coastal belt of Andhra Pradesh, India. It is a coastal zone surrounding the Bay of Bengal. Hence, the geographical location covers latitudes 15°45′N-16 00′N and longitudes 80 15′E -80 45′E (Fig. 2), extending from the Bay of Bengal to the interior parts of the province. The study area comprises coastal and near-coastal mandals such as Chinaganjam, Karamchedu, Chirala, Vetapalem, Bapatla, Karlapalem, Pittalavanipalem, Nizampatnam, Nagaram, and Repalle. The physiography of the study region consists of agricultural land, settlements, coastal swamps, estuarine, and shoreline habitats as the main land cover utilisation. It is a key coastal ecological region that interacts with the Bay of Bengal and is exposed to climate variability and change, cyclones, floods, coastal erosion, and salinity-freshwater regimes. The rainfall is derived from South-West and North-East monsoon flows. Consequently, the climate variables considered for the study comprised annual and seasonal rainfall, maximum and minimum temperatures, mean temperature, temperature and rainfall anomalies, rainy days, extreme rainfall events, and cyclones to evaluate their impacts on coastal ecology and vegetation. The coastal belt of Bapatla hosts a considerable number of villages and towns engaged in agriculture, fisheries, aquaculture, and allied activities. It is a heavily populated region, with the selected coastal and near-coastal mandals recorded with a total population of 784000 people according to the 2011 census. Private organisations, agricultural activities, trading, and other human developments thrive in this region. Among the mandals, Chirala and Bapatla are considered hotspots for population density, whereas Nizampatnam, Repalle, Vetapalem, Nagaram, Karlapalem, and Pittalavanipalem record high rural and coastal settlements. Coastal regions are anthropogenically influenced by population growth, agricultural lands, aquaculture, and human developments, and consequent impacts are expected on coastal ecology. Thus, population distribution is an essential parameter for analysing the relationship between climate variability, land use/land cover, and the coastal environment in the study area.
Result and Discussion
The Results and Discussion contains temporal and spatial analysis of climate variables (rainfall, temperature) and mangrove cover in the Bapatla Coastal Panchayat between 1996 and 2026, using decadal spatial data and annual trends for assessment. The findings indicate a strong positive longterm trend in mangrove growth, contrasting with the highly volatile, almost chaotic nature of rainfall and only marginally positive temperature trends. This analysis aims to highlight the relationship between the region's climate and geographic features and the patterns of vegetation growth, specifically in the area of the Eastern Coast of India. have a gradually decreasing rainfall amount of 1,061-1,215 mm from north to south. The overall pattern of the rainfall distribution is consistent with the previous decade, although the ranges appear to have decreased, indicating a gradual decrease in annual rainfall. This suggests a potential longterm negative trend in the region's annual rainfall.
Rainfall
Rainfall 2016: Compared to the rainfall pattern of 2006, the ranges of the choropleth values have significantly decreased, with the annual rainfall (Fig. 3c) amount varying between 724.44 and 1,126.75 mm. Similar to the trends of the previous decades, the eastern coastal mandals of Repalle, Nizampatnam, and Nagaram recorded the highest amount of rainfall, of 1,061-1,126.75 mm, while the central mandals of Bapatla and its neighbour Karamchedu saw a noticeable decrease in rainfall. The gradual decrease from east to west and from coastal areas to the interior is a consistent pattern across all decades, suggesting that it is a common characteristic of the region. The gradual decrease in the annual rainfall amounts across three consecutive decades indicates a potential long-term negative trend in the panchayat's rainfall.
Rainfall 2026: The rainfall pattern in 2026 appears to be generally consistent with the trends of the previous decades, with a gradual increase in annual rainfall (Fig. 3d) compared to 2016. Across the panchayat, the annual rainfall varies between 957.87 and 1,339.81 mm, with the highest amount of rainfall, 1,215-1,339.81 mm, recorded on the eastern coastal strip of Repalle. Similar to the pattern in 1996, the central mandals of Bapatla and its neighbour Karamchedu have a lower rainfall amount than the coastal areas, with the western interior mandals being the driest. Thus, the overall pattern of the rainfall distribution remains consistent with a gradual increase in annual rainfall amounts from decade to decade over the 30 years. Temperature 2026: Compared to the temperature pattern (Fig. 4d) in 2016, the values in 2026 appear to have decreased slightly, ranging between 30.61 °C and 32.87 °C. Similar to the pattern in 1996, the temperature increased gradually from the eastern coastal area to the western interior region, with the warmest area being the western mandals of Repalle and the coolest being the eastern coastal peninsula of Repalle. The central mandals of Bapatla, Karlapalem, and Pittalavanipalem have a moderate temperature of 31.48-31.85 °C, comparable to the values in 1996. Thus, the temperature distribution pattern appears to have remained consistent across the panchayat over the decade, with only small decreases in the values, similar to the trend in 2006. Combined with the gradual increase in temperature across the previous decades, it suggests that the temperature rise in the panchayat follows a long-term positive trend with only minor annual variations. Mangroves 2026: The mangrove distribution map (Fig. 5d) for the Bapatla Coastal Panchayat visualises the distribution of mangroves for the last 30 years. It can be seen that the mangroves in the coastal area are primarily distributed within the same general region as they have been throughout the study period. It is centred along the coastal edge of Nizampatnam district and the Karlapalem coastal fringe area, which appears to be the largest concentration. Another region of vegetation is observed in the south-west part of the territory, namely, in the small area of Chinaganjam. This site seems to be the only other settlement of significant size within the Bapatla region, although the growth appears comparable to previous years, and the region has remained stagnant since 2016. Overall, compared to the 2016 map, there is a slight decrease in the overall coverage, especially in the central region of the Repalle peninsula, which corresponds to the decline observed in the mangrove area chart towards the end of the study period (between 160 and 130 SqKm). Finally, most of the interior and northern regions of the Bapatla coastal Panchayat, specifically the areas of Bapatla, Chirala, Karamchedu, Nagaram, and Pittalawanipalem, do not appear to have vegetation. Therefore, the 2026 mangrove distribution map illustrates a recent decrease observed in the last period after several decades of continuous growth in the coastal region around Nizampatnam, Karlapalem, and Repalle areas.
Temperature
Temperature
Mangroves
Mangrove Changes: This map (Fig. 6) displays the overall coverage of mangroves in the Bapatla Coastal Panchayats, indicating the densest areas. The majority of the vegetation is present along the Nizampatnam and Repalle coastlines, with the coverage being densest around the Repalle peninsula. Another area of vegetation can be seen in Chinaganjam, with the coverage being much lower than in the other two regions. Other than these three local areas, the rest of the panchayat has little to no mangroves. Thus, the map shows that the vegetation is generally limited to the local coastal areas, with no significant coverage along the majority of the coastline. The rapid rise to 170 km2 in 2023 suggests that the increase in coverage was most significant around this time, possibly due to favourable environmental conditions. The sharp decrease to 130 km2 in 2026 indicates a sudden environmental change that had a significantly negative impact on the mangrove ecosystem. Overall, the chart demonstrates a generally positive trend in the long-term mangrove coverage in the Bapatla Coastal Panchayat, with some sharp decreases, such as the one in 1998-1999, that had little impact on the general trend. Rainfall and temperature demonstrate a limited degree of linear trends, characterised by substantial year-to-year variability, with R2 of 0.0393 and 0.0087, respectively, while the growth pattern of mangroves is positive and steep (R² = 0.7003). Therefore, it could be concluded that the development of mangroves along the Bapatla coast is primarily driven by the interplay of multiple-year relationships with favourable weather conditions rather than individual factors. Indeed, the temperature in 1996 -2016 gradually increased from 30.55-32.73 °C to 31.04-33.74 °C, which may explain the expansion of mangroves during the same period, as high temperatures facilitate plant growth. However, the significant rainfall peaks in 2010 and 2020 probably provided the estuarine mangrove ecosystem with the freshwater inflow and sediment deposits necessary for its stability, which, in turn, contributed to the gradual increase of mangrove coverage through 2016 and its rapid rise through 2023. Nevertheless, the abrupt decline of vegetation to 130 km2 in 2026 occurred alongside the decrease in temperatures to 30.61-32.87 °C and rainfall to levels below the 2010/2020 peaks, which could also impact the salinity of the coastal waters and, thus, the growth of mangroves. Overall, the trends suggest that the mangrove ecosystems of Bapatla are highly resilient to short-term weather fluctuations over thirty years, but the combination of lower temperatures and rainfall in the last years contributed to the abrupt decline in vegetation coverage.
Conclusion
The study analysed the pattern of temporal and spatial variations in climate and mangrove vegetation in Bapatla coastal Panchayat, Andhra Pradesh, over 30 years (1996-2026) using decadal spatial analysis and inter-annual trends of rainfall, temperature, and mangrove cover. The first notable observation was that the erratic and weak trends of rainfall (p-value: R² = 0.0393) and temperature (p-value: R² = 0.0087) were dissociated from a strongly positive longterm trend in mangrove cover (p-value: R² = 0.7003), suggesting that the response of mangroves to annual weather variations is non-linear. While the mean mangrove cover in 1996 was 110 km2, it rose to 170 km2 in 2023 before dropping to 130 km2 in 2026. The analysis further showed that the areal extent of mangrove vegetation remained concentrated along the Nizampatnam and Repalle coasts during all the decadal periods. The maximum percentage of total mangrove cover was found in the Repalle peninsula, with smaller patches found on the island of Chinaganjam. No mangroves were found in the interior and northern mandals in any of the surveyed years. These observations suggest that local physiography plays a critical role in mangrove distribution, as only the coastal areas have the necessary saltwater habitats to sustain these ecosystems. While dynamic weather conditions appear to impact the growth of mangroves, they have little effect on their distribution, which follows the same pattern throughout the study period. The drop in mangrove cover between 2023 and 2026 appears to be precipitated by multiple factors, as the vegetation was impacted by simultaneous decreases in temperature and rainfall during this period. Over the 30-year study period, mangroves had displayed remarkable resilience to short fluctuations in climate, but prolonged decreases in both temperature and rainfall appear to negatively affect them in the short term. Future studies should build on this work by considering such factors as rising sea levels and changes in coastal processes and evaluating trends after 2026 to further understand the dynamics of coastal vegetation in the region. In addition, the present analysis recommends prioritising the central coastal mandals of Nizampatnam, Karlapalem, and Repalle for conservation due to their consistently high mangrove cover.
Acknowledgement:
The authors sincerely acknowledge the U.S. Geological Survey (USGS) for providing Landsat 5, Landsat 7, Landsat 8, and Landsat 9 satellite data used for historical and recent mangrove mapping and extraction. We gratefully acknowledge the mangrove forest reference datasets used to establish baseline and reference zones for accurate mangrove assessment. We extend our sincere thanks to the Climate Hazards Centre for providing CHIRPS daily rainfall data used to assess annual precipitation variability. We also acknowledge the European Centre for Medium-Range Weather Forecasts (ECMWF) for providing ERA5-Land daily temperature data used to analyse temperature variability. The authors sincerely thank the Department of Geography, Kannur University, for providing academic guidance, computational facilities, and institutional support throughout the study. Finally, we express our gratitude to all data providers, researchers, and technical contributors whose valuable resources and support contributed to the successful completion of this research.
Figures and tables from the paper
References
24 in the original paper- Alongi DM. Mangrove forests: resilience, protection from tsunamis, and responses to global climate change. Estuar Coast Shelf Sci. 2009;76(1):1-13. DOI:10.1016/j.ecss.2007.08.024.
- Alongi DM. Carbon cycling and storage in mangrove forests. Annu Rev Mar Sci. 2014;6:195-219. DOI:10.1146/annurev-marine-010213-135020.
- Atwood TB, Connolly RM, Almahasheer H, Carnell PE, Duarte CM, Ewers Lewis CJ, et al. Global patterns in mangrove soil carbon stocks and losses. Nat Clim Chang. 2017;7(7):523-528. DOI:10.1038/nclimate3326.
- Bunting P, Rosenqvist A, Hilarides L, Lucas RM, Thomas N, Tadono T, et al. Global mangrove extent change 1996-2020: Global Mangrove Watch version 3.0. Remote Sens. 2022;14(15):3657. DOI:10.3390/rs14153657.
- Donato DC, Kauffman JB, Murdiyarso D, Kurnianto S, Stidham M, Kanninen M. Mangroves among the most carbon-rich forests in the tropics. Nat Geosci. 2011;4(5):293-297. DOI:10.1038/ngeo1123.
- Forest Survey of India. India State of Forest Report 2023. Dehradun: Ministry of Environment, Forest and Climate Change, Government of India; 2023.
- Gilman EL, Ellison J, Duke NC, Field C. Threats to mangroves from climate change and adaptation options: a review. Aquat Bot. 2008;89(2):237-250.
- Giri C, Ochieng E, Tieszen LL, Zhu Z, Singh A, Loveland T, et al. Status and distribution of mangrove forests of the world using Earth observation satellite data. Glob Ecol Biogeogr. 2011;20(1):154-159. DOI:10.1111/j.1466-8238.2010.00584.x.
- Goldberg L, Lagomasino D, Thomas N, Fatoyinbo T. Global declines in human-driven mangrove loss. Glob Change Biol. 2020;26(10):5844-5855. DOI:10.1111/gcb.15275.
- Hamilton SE, Casey D. Creation of a high spatiotemporal resolution global database of continuous mangrove forest cover for the 21st century (CGMFC21). Glob Ecol Biogeogr. 2016;25(6):729-738. DOI:10.1111/geb.12449.
- Jayakumar K. Spatio-temporal changes in the Godavari mangroves: a study examining land-use change and sustainable management. Indian J Geo-Mar Sci. 2023;52(1):[page range not provided].
- Kuenzer C, Bluemel A, Gebhardt S, Quoc TV, Dech S. Remote sensing of mangrove ecosystems: a review. Remote Sens. 2011;3(5):878-928. DOI:10.3390/rs3050878.
- Lovelock CE, Cahoon DR, Friess DA, Guntenspergen GR, Krauss KW, Reef R, et al. The vulnerability of Indo-Pacific mangrove forests to sea-level rise. Nature. 2015;526:559-563. DOI:10.1038/nature15538.
- Polidoro BA, Carpenter KE, Collins L, Duke NC, Ellison AM, Ellison JC, et al. The loss of species: mangrove extinction risk and geographic areas of global concern. PLoS One. 2010;5(4):e10095. DOI:10.1371/journal.pone.0010095.
- Saintilan N, Khan NS, Ashe E, Kelleway JJ, Rogers K, Woodroffe CD, et al. Thresholds of mangrove survival under rapid sea-level rise. Science. 2020;368(6495):1118-1121. DOI:10.1126/science.aba2656.
- Spalding M, Kainuma M, Collins L. World atlas of mangroves. London: Earthscan; 2010.
- Thomas N, Lucas R, Bunting P, Hardy A, Rosenqvist A, Simard M. Distribution and drivers of global mangrove forest change, 1996-2010. PLoS One. 2017;12(6):e0179302. DOI:10.1371/journal.pone.0179302.
- Valiela I, Bowen JL, York JK. Mangrove forests: one of the world's threatened major tropical environments. BioScience. 2001;51(10):807-815. DOI:10.1641/00063568(2001)051[0807:MFOOWT]2.0.CO;2.
- Ward RD, Friess DA, Day RH, MacKenzie RA. Impacts of climate change on mangrove ecosystems: a region-by-region overview. Ecosyst Health Sustain. 2016;2(4):e01211. DOI:10.1002/ehs2.1211.
- Duke NC, Meynecke JO, Dittmann S, Ellison AM, Anger K, Berger U, et al. A world without mangroves? Science. 2007;317(5834):41-42. DOI:10.1126/science.317.5834.41.
- Friess DA, Yando ES, Alemu JB, Wong LW, Bhatia N, MacKenzie RA. Mangroves give cause for conservation optimism, for now. Curr Biol. 2022;32(4):R153-R154. DOI:10.1016/j.cub.2021.12.042.
- Friess DA, Yando ES, Alemu JB, Wong LW, Bhatia N, MacKenzie RA. Mangroves give cause for conservation optimism, for now. Curr Biol. 2019;29(10):R405-R407. DOI:10.1016/j.cub.2019.04.002.
- Murray NJ, Worthington TA, Bunting P, Duce S, Hagger V, Lovelock CE, et al. High-resolution mapping of losses and gains of Earth's tidal wetlands. Science. 2022;376(6594):744-749. DOI:10.1126/science.abm9583.
- Worthington TA, Andradi-Brown DA, Bhargava R, Buelow C, Bunting P, Duncan C, et al. A global biophysical typology of mangroves and its relevance for ecosystem structure and deforestation. Sci Rep. 2020;10:14652. DOI:10.1038/s41598-020-71194-5.